In what is a reversal compared to many of the trends we have seen over the past few quarters, Dell and HPE have seen massive market share gains but went about it in slightly different ways. In this article, we are going to discuss the IDC 3Q20 Quarterly Server Tracker and show how this quarter’s numbers did not align with an industry narrative.
IDC 3Q20 Quarterly Server Tracker
First off, we generally look at revenue. Here are the revenue numbers by vendor:
| Top 5 Companies, Worldwide Server Vendor Revenue, Market Share, and Growth, Third Quarter of 2020 (Revenues are in US$ Millions) | |||||
| Company | 3Q20 Revenue | 3Q20 Market Share | 3Q19 Revenue | 3Q19 Market Share | 3Q20/3Q19 Revenue Growth |
| T1. Dell Technologies | $3,757.8 | 16.65% | $3,779.1 | 17.12% | -0.6% |
| T1. HPE/New H3C Group | $3,596.9 | 15.94% | $3,737.9 | 16.93% | -3.8% |
| 3. Inspur/Inspur Power Systems | $2,114.7 | 9.37% | $1,973.3 | 8.94% | 7.2% |
| 4. Lenovo | $1,326.0 | 5.88% | $1,189.8 | 5.39% | 11.4% |
| 5. Huawei | $1,098.9 | 4.87% | $916.7 | 4.15% | 19.9% |
| ODM Direct | $6,303.3 | 28.03% | $5,816.0 | 26.34% | 8.4% |
| Rest of Market | $4,367.9 | 19.36% | $4,663.8 | 21.13% | -6.3% |
| Total | $22,565.6 | 100.00% | $22,076.6 | 100.00% | 2.2% |
| Source: IDC Worldwide Quarterly Server Tracker, December 8, 2020 | |||||
We had a 2.2% growth in revenue on a year/ year basis. On a quarterly basis, Dell Technologies grew by over $400M and HPE was relatively flat. IBM which had almost $1.45B in revenue last quarter could not pull ahead of Lenovo or Huawei. In something that does not happen often, we saw the ODM Direct and Rest of Market numbers go down on a quarterly basis. Inspur was down on revenue by over $400M on a quarterly basis, but one must remember that it was at $1.43B in 2Q20 making this still a huge upward trend.
Of course, revenue only tells part of the story, we also have to look at units sold:
| Top 5 Companies, Worldwide Server Unit Shipments, Market Share, and Growth, Third Quarter of 2020 | |||||
| Company | 3Q20 Unit Shipments | 3Q20 Market Share | 3Q19 Unit Shipments | 3Q19 Market Share | 3Q20/3Q19 Unit Growth |
| 1. Dell Technologies | 502,409 | 16.39% | 502,306 | 16.36% | 0.0% |
| 2. HPE/New H3C Group | 425,117 | 13.87% | 459,395 | 14.96% | -7.5% |
| 3. Inspur/Inspur Power Systems | 296,121 | 9.66% | 314,975 | 10.26% | -6.0% |
| T4. Huawei | 177,729 | 5.80% | 156,150 | 5.08% | 13.8% |
| T4. Lenovo | 163,908 | 5.35% | 204,040 | 6.64% | -19.7% |
| ODM Direct | 989,024 | 32.26% | 896,625 | 29.19% | 10.3% |
| Rest of Market | 511,482 | 16.68% | 537,752 | 17.51% | -4.9% |
| Total | 3,065,791 | 100.00% | 3,071,244 | 100.00% | -0.2% |
| Source: IDC Worldwide Quarterly Server Tracker, December 8, 2020 | |||||
Here we are seeing some very different trends.
Dell EMC was essentially flat on an annual basis. Dell’s 2Q20 shipments only amounted to 432,556 while HPE was at 456,642. Dell’s numbers effectively-being flat in the same quarter for 2019 and 2020 is amazing. HPE was down revenue and units but remained solidly in second place.
Inspur saw lower unit sales but higher revenue which we will show in the next section means higher ASPs. Lenovo’s unit volume went down as revenue went up. In 2019, Lenovo seems to have sold a lot of lower-value servers which pushed volumes sacrificing ASPs. Huawei made a strong move up as IBM and Supermicro fell off of lists. We are also going to note that ODM Direct did extremely well while the “Rest of Market” category had a weak quarter.
Annual and Quarterly Server ASP Movement
When we look at year/ year average selling price (ASP) performance, we can see some big moves:
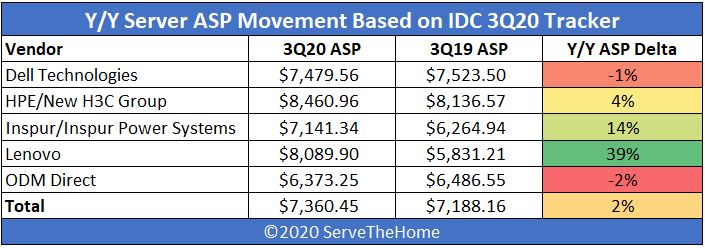
Here we can see that Dell took a small ASP hit but was able to generate higher volumes. That is particularly impressive as we are now very late in the Intel Xeon product cycle. IDC did note that AMD EPYC server sales saw strong growth.
Perhaps the biggest Y/Y ASP increase was Lenovo. Again, this is probably more to do with Lenovo doing a lot of volume on lower ASP servers in 2019. These figures are more in-line with what we would expect from Lenovo.
One will notice we do not have Huawei here. That is simply because we have historically tracked the big four (Dell, HPE, Inspur, and Lenovo) that are consistently on lists since we started this series. Huawei sometimes falls off this list.
Here are the quarterly numbers:
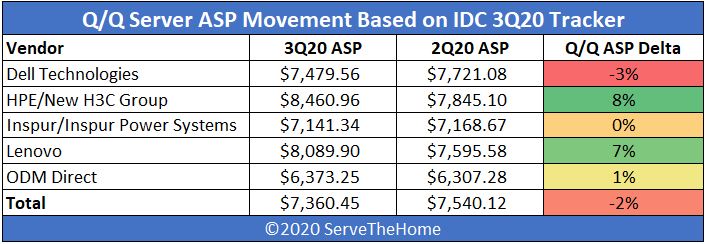
Looking at quarterly data, we see Dell EMC pushing more heavily into lower-cost servers. Not only did Dell EMC see a ~3% ASP decline while its competitors were 0-8% up, but even the broader market only was lower by around 2% on a quarterly basis (albeit up 2% on a Y/Y) basis.
HPE has had a large bump on a quarterly basis, helping to offset falling shipment volumes. Anecdotally, our HPE deal pricing for models we buy through the channel has gone up in the past year or so and we have stopped ordering as many HPE boxes, so this feels like it makes sense.
Lenovo has also pushed pricing so that it now has higher ASPs than Dell which has not been true for some time. Dell often touts how its servers are a premium product over other brands, but when it comes to their 3Q20 ASP, the company is actually only about 1.6% higher than the industry average. Indeed, while Lenovo moved from within 1% of the industry average in 2Q20 to a much higher level, Dell has moved below the previous quarter’s average.
Bucking “The Trend”
Something that we track at STH is the path of those big companies that feature more proprietary management solutions as part of their value proposition. Of the big 4 vendors (Dell, HPE, Inspur, and Lenovo), Dell, HPE, and Lenovo all feature a larger management component than we typically see on an Inspur, Supermicro, and other servers, even including some IBM metal that we have in the lab. Those companies that do not have big management components tend to rely on more industry-standard tooling as we see with many of the ODM Direct and other categories. While this is not a perfectly clean distinction, that is the delineation we made many quarters ago. This leads to the following chart:
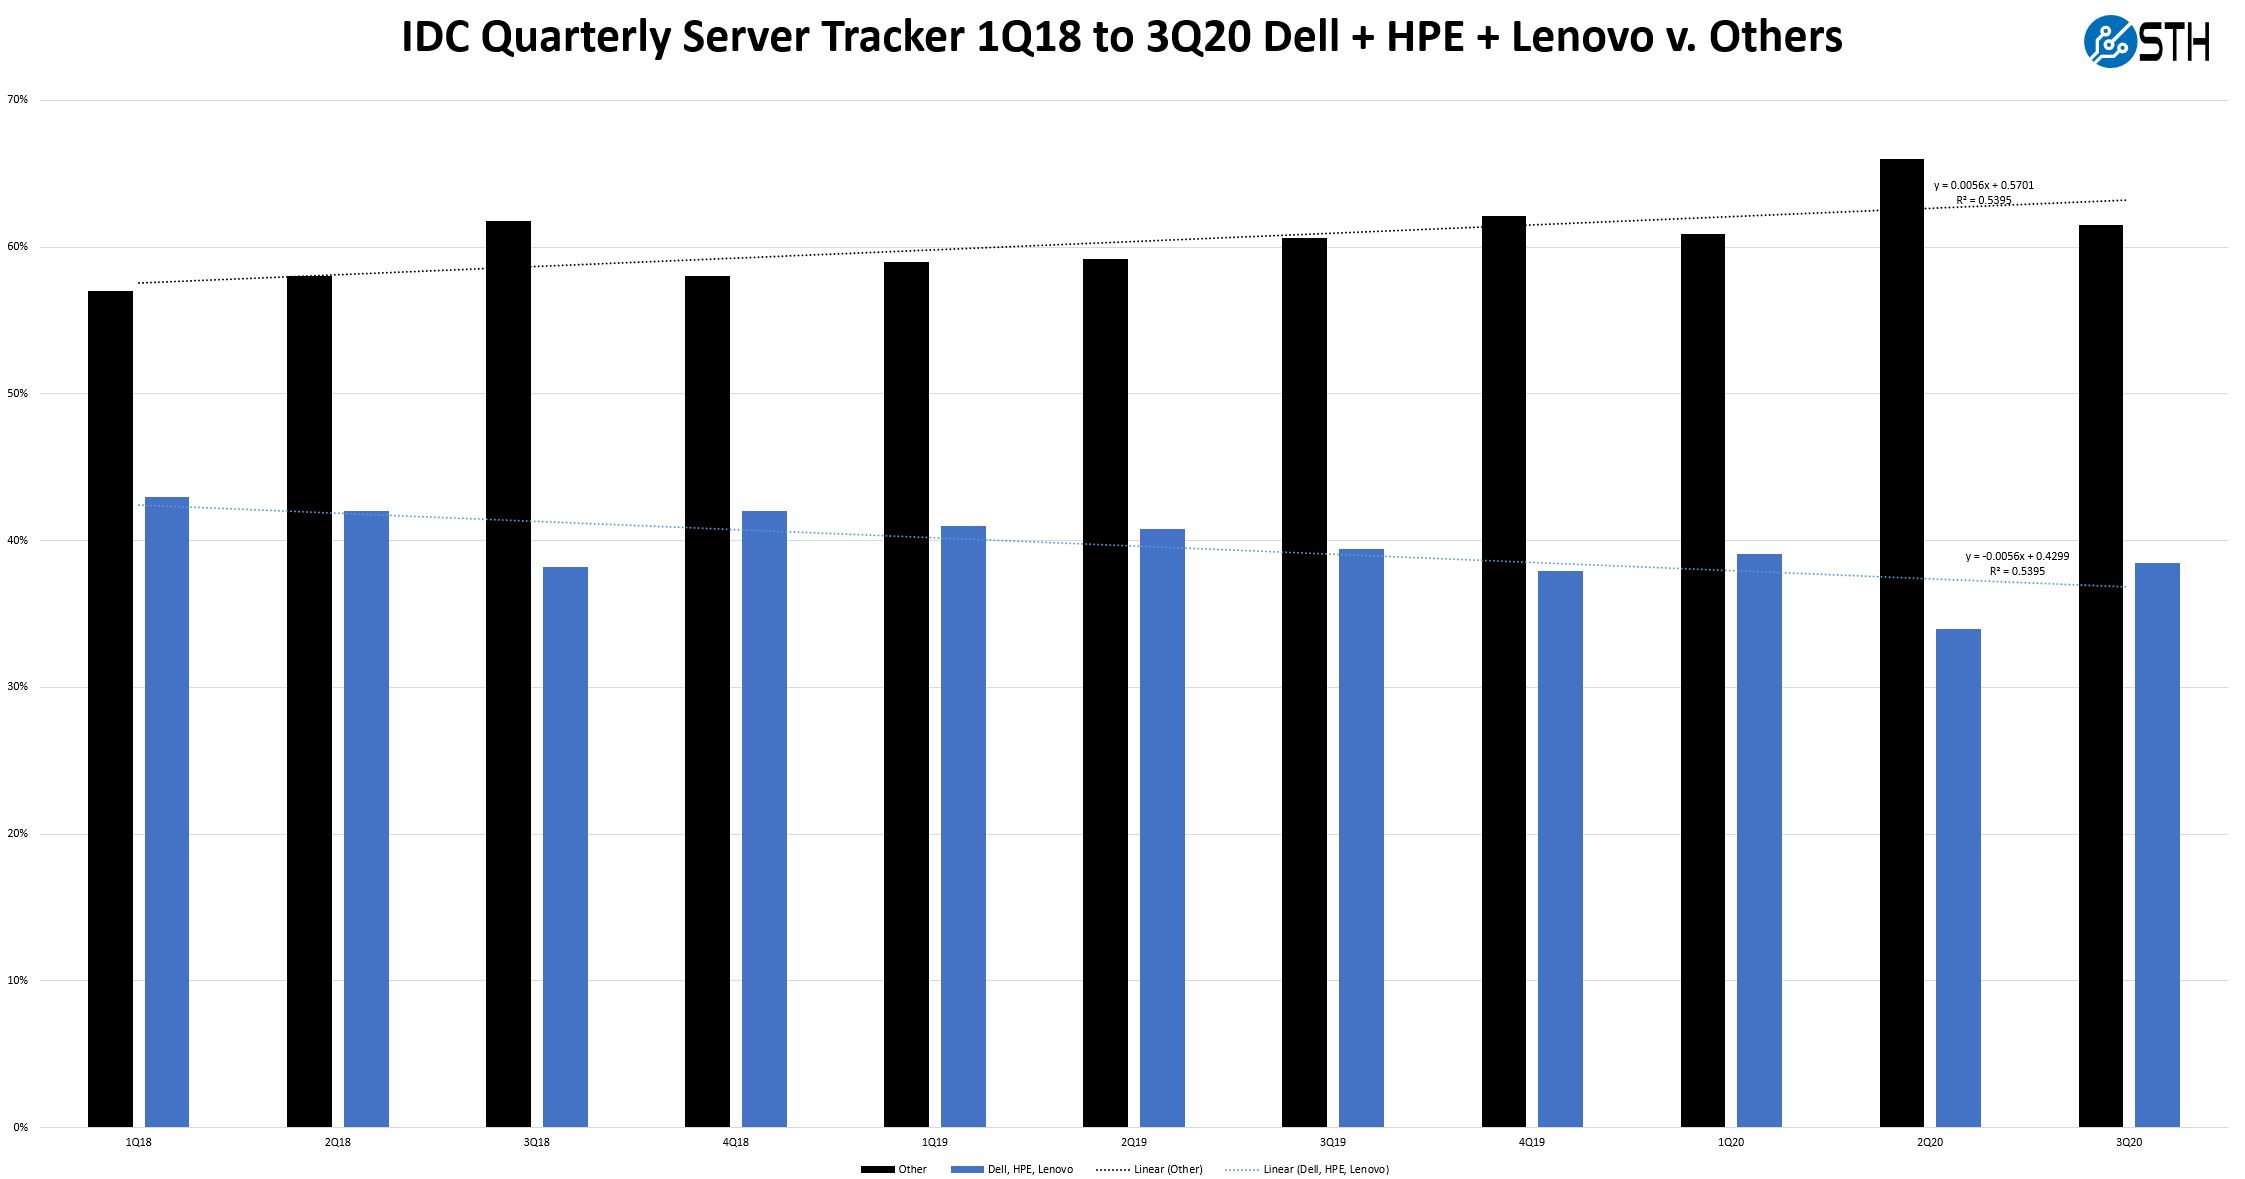
As one can see, the Dell, HPE, and Lenovo combined bars (blue) are steadily decreasing over time as the industry as a whole moves away from the more proprietary vendors. This latest quarter is actually more akin to the share that these companies had in 3Q19/ 4Q19 at ~38% combined share. 2Q20 was the low point where the companies had only 34% share combined.
ODM Direct and Other categories are not full of small players doing a few hundred million per year at most. Indeed, some of the well-known ODM Direct players such as Wiwynn are at around a $5.8-6B/ year annual run rate that would put them ahead of Lenovo on these charts if they were included. They are keeping costs low to compete in low margin businesses. Wiwynn was running a $5B/ year server business with only around 550 employees selling to large companies like Facebook and Microsoft. You can read more about them here: Where Cloud Servers Come From Visiting Wiwynn in Taipei. As workloads get concentrated to cloud and hyperscale clients, volume shifts from legacy players to those such as Wiwynn, QCT, Inspur, and others which is why we see the diverging trendlines. It is also what makes Dell’s ~$400M jump this quarter impressive.
Final Words
Overall, these are some cool trends in the industry. We are gearing up for a very exciting Q1 (expecting AMD Milan) and Q2 (Intel Ice Lake) in 2021 as well as a slew of other architectures coming out. On a competitive front, we appreciate that IDC shared some of its chip insights in the press release with “worldwide revenues for servers running AMD CPUs were up 112.4% year over year while ARM-based servers grew revenues 430.5% year over year, albeit on a very small base of revenue.” (Source: IDC)
As always, head over to the IDC site for more or to get their more detailed reports.



Patrick,
first paragraph after “IDC 3Q20 Quarterly Server Tracker” is in conflict with the the table shows. E.g. “On a quarterly basis, Dell Technologies grew by over $400M and HPE was relatively flat.” — yet Dell is -0.6% and HPE even -3.8%. Also Dell is not +400M, but rather -40M — so either columns in table got switched or I’m completely out of idea you are talking about.
BTW: such mistakes in first paragraph and I lost any interest to read more…
Thanks,
Karel
I was also confused but read again more closely: “On a quarterly basis” vs. table showing yearly basis.
The comparison is 2Q20 ($3,339.80) from the previous IDC report/STH article vs. 3Q20 ($3,757.8) or $418M.
KarelG – S is spot on. That is not an error and it is discussing a quarterly trend in addition to the tables which have the Y/Y trend. Our 2Q20 article is linked in that paragraph for the quarterly reference.
S & Patrick, guys, thanks for explanation, as a not-native English speaker I sometimes simply drown in terms understanding. Anyway, lesson learn so “quarterly basis” means xQ compared to (x-1)Q. Whole Y/Y basis means xQy compared to xQ(y-1). Cool! Learn something new. Thanks! Karel