Our publishing queue has been full for some time, but we wanted to cover the IDC 4Q19 Quarterly Server Tracker results. There were some significant shifts in the market. Notably, Dell Technologies ceded significant share while HPE, Lenovo, and Inspur saw growth in key areas. These trends often align with how well companies are pricing and getting their product messaging across in the market. We also saw server average selling prices dip by around 6% while the number of units being sold increased.
IDC 4Q19 Quarterly Server Tracker
We wanted to show two data excerpts from the press release before getting to our discussion. The first is IDC’s revenue figures showing a market growth of 7.5% on a year/ year basis. This compares to the 3Q19 tracker’s decline of 6.7%.
| Top 5 Companies, Worldwide Server Vendor Revenue, Market Share, and Growth, Fourth Quarter of 2019 (Revenues are in US$ Millions) | |||||
| Company | 4Q19 Revenue | 4Q19 Market Share | 4Q18 Revenue | 4Q18 Market Share | 4Q19/4Q18 Revenue Growth |
| T1. HPE/New H3C Group | $4,137.2 | 16.3% | $4,281.0 | 18.2% | -3.4% |
| T1. Dell Technologies | $3,986.6 | 15.7% | $4,426.4 | 18.8% | -9.9% |
| 3. IBM | $2,295.2 | 9.1% | $1,951.0 | 8.3% | 17.6% |
| 4. Inspur/Inspur Power Systems | $1,736.1 | 6.8% | $1,548.8 | 6.6% | 12.1% |
| T5. Lenovo* | $1,417.6 | 5.6% | $1,455.8 | 6.2% | -2.6% |
| T5. Huawei* | $1,284.5 | 5.1% | $1,262.3 | 5.4% | 1.8% |
| ODM Direct | $6,470.9 | 25.5% | $4,693.3 | 19.9% | 37.9% |
| Rest of Market | $4,023.7 | 15.9% | $3,963.9 | 16.8% | 1.5% |
| Total | $25,351.9 | 100% | $23,582.4 | 100% | 7.5% |
| Source: IDC Worldwide Quarterly Server Tracker, March 12, 2020 | |||||
Second, we wanted to show IDC’s figures for unit shipments which grew 14% year on year.
| Top 5 Companies, Worldwide Server Unit Shipments, Market Share, and Growth, Fourth Quarter of 2019 | |||||
| Company | 4Q19 Unit Shipments | 4Q19 Market Share | 4Q18 Unit Shipments | 4Q18 Market Share | 4Q19/4Q18 Unit Growth |
| 1. Dell Technologies | 549,488 | 16.1% | 580,579 | 19.4% | -5.4% |
| 2. HPE/New H3C Group | 507,228 | 14.9% | 484,668 | 16.2% | 4.7% |
| 3. Inspur/Inspur Power Systems | 270,567 | 8.0% | 247,600 | 8.3% | 9.3% |
| T4. Lenovo* | 233,896 | 6.9% | 190,721 | 6.4% | 22.6% |
| T4. Huawei* | 216,734 | 6.4% | 211,618 | 7.1% | 2.4% |
| ODM Direct | 1,054,743 | 31.0% | 689,394 | 23.1% | 53.0% |
| Rest of Market | 570,667 | 16.8% | 582,070 | 19.5% | -2.0% |
| Total | 3,403,323 | 100% | 2,986,651 | 100% | 14.0% |
| Source: IDC Worldwide Quarterly Server Tracker, March 12, 2020 | |||||
Both the revenue figures and units ship figures also increased quarter on quarter ($22B to $25B and 3.1M to 3.4M respectively.)
The information is in IDC’s numbers above, but to save our readers from the math of what is going on, here is what the ASP trends IDC is showing.
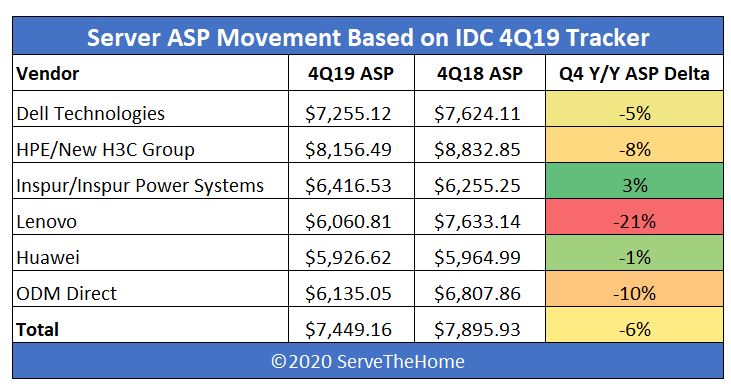
We removed IBM from the list since it does not have unit volumes in the tables above. Still, what we can see here is that the server ASP for the quarter actually decreased by around 6% to $7,449.16.
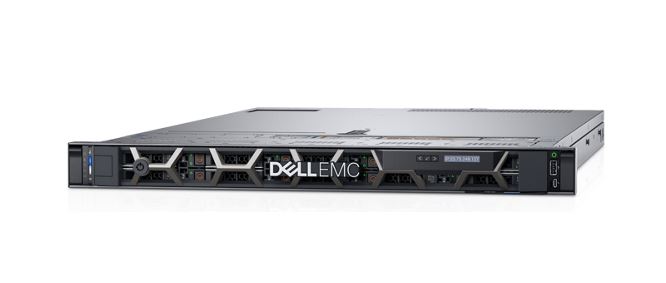
Dell Technologies has been reveling in its top ranking for both revenue and server shipments for several quarters. According to IDC it still is shipping a single-digit percentage more servers than HPE, but it has lost the revenue crown. This move is due to a -5.4% unit shipment and -9.9% revenue slide on a year/ year basis. That tells us that Dell EMC has shifted to lower ASP (average selling price) sales, and is still losing volume even with a 5% ASP dip.
HPE for its part grew unit shipments by 4.7% yet still saw a revenue decline of -3.4% in the IDC 4Q19 numbers. Here it seems HPE is also doing more lower ASP server deals, but those lower ASP deals are winning in the market. That is leading to a dip of 8% on the Y/Y ASP side according to IDC’s numbers, but HPE is the only major volume player that is above the industry average ASP, beating that average by almost 9.5%. We have seen the company also embrace alternative architectures such as with the HPE ProLiant DL325 Gen10 which helps capture more areas of the market.

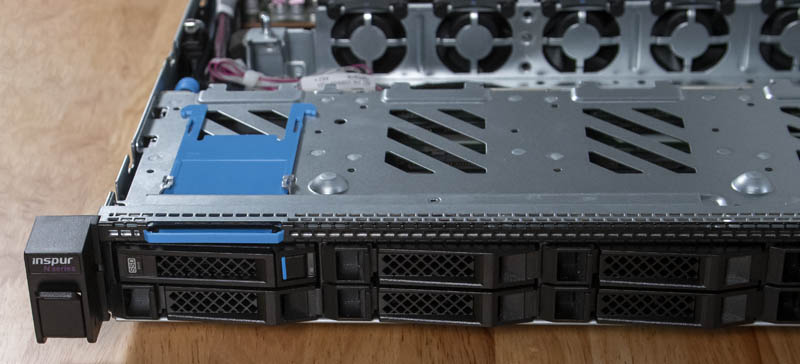
Inspur continued its torrid pace of growth with 12.1% revenue and 9.3% unit volume growth. These rates are slightly down from 3Q19 which were 15.3% and 11.1% respectively. Still, compared to Dell Technologies and HPE we are seeing revenue increase faster than unit growth which means that ASPs are increasing for Inspur. Inspur not only has mainstream servers like the Inspur NF5180M5, but also high-end AI training servers like the Inspur NF5468M5. Our next Inspur review, which is almost complete, will be of something far more innovative on the AI side than a traditional shop such as Dell EMC offers.
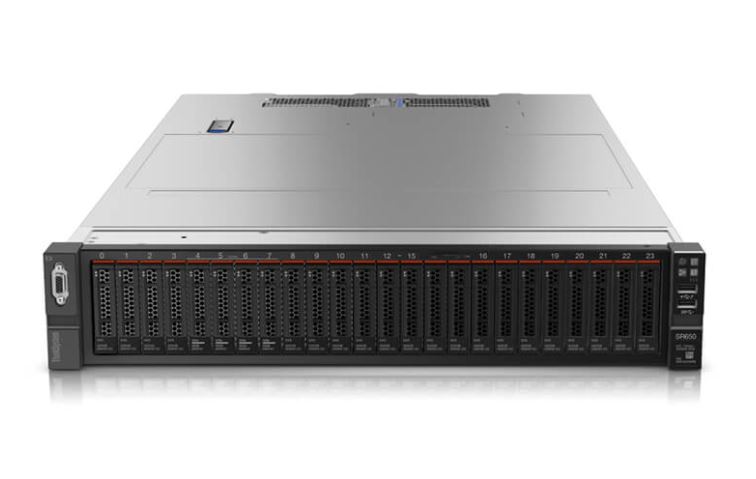
Lenovo went on a unit share blitz growing 22.6% in the Y/Y quarters. At the same time, it saw a 2.6% drop in revenue which leads to a 21% erosion in ASP. If you look at the derived 4Q18 ASP and the 4Q19 ASP changes in our chart compared to the “Total” line, you will see that Lenovo went from an ASP near the industry average and in a virtual dead-heat with Dell Technologies. The current numbers show its ASPs are now below the ODM Direct category which includes players such as Wiwynn and Quanta. This is nothing short of a monumental shift in its business which is either due to heavy discounting, selling more lower margin systems, or selling low-dollar servers.
Very quickly we wanted to discuss the “ODM Direct” segment. In the IDC 4Q19 Quarterly Server Tracker results, this segment is now almost as big as Dell and HPE combined in terms of units and closing in on the revenue side. ASPs are lower, as we would expect here. From a quality standpoint, many of the ODM Direct vendors are doing an excellent job, and are rivaling Dell EMC and HPE in terms of fit and finish yet at a lower price point. In 2020, we may see ODM Direct grow beyond Dell and HPE revenue if IDC does not break this category out.
Final Words
What is fascinating is that in January 2020 this trend was abundantly clear from STH data. I actually sent the Dell EMC team, as an example, some more detailed data showing that people are looking at their products on STH less often. Likewise, relative to HPE, Dell has been losing ground over the past year. Of course, while I was sending data I thought was important, Dell likely had better data showing the same trend in its business. Vendors such as Inspur are seeing fairly rapid 2018 to 2019 growth on STH as well.
While the IDC 4Q19 Quarterly Server Tracker showed growth, I think every major vendor is re-thinking its 2020 strategy in light of recent events. My sense is that Q2 2020 volumes, especially outside of ODM Direct, will fall along with ASPs. The Big 2nd Gen Intel Xeon Scalable Refresh will help. Also with the Intel Cooper Lake Rationalized Still Launching 1H 2020, server vendors will have aging Intel Xeon platforms in the mainstream 2-socket market until Ice Lake Xeon parts are released. Macroeconomic budget pressures plus aging technology is not a great recipe for unit and revenue growth.



Maybe I misunderstand the metrics, but why is Supermicro not included in this report?
I am guessing SuperMicro belongs to OEM Direct ? ( That is actually a good Question )
Ya’ll are like a review site and analyst firm all in 1.
Hi guys. We usually just look at top 5 server vendors by units shipped and volume. You will notice in IDC’s top 5 charts they have ODM Direct and Rest of Market. In the more detailed reports, IDC has additional detail, including this ~16% that Supermicro is in.
You will notice from the 3Q19 piece that Cisco was in the Top 5 for revenue but not units and Supermicro in the Top 5 for units, not revenue.
Not having access to the actual IDC reports limits conclusions to what is reported elsewhere.
Based on Patrick’s comments, it sounds like SM ships lots of lower end units or simply lower cost units, while Cisco ships fewer units (or simply high-end units where lower volume is typical) for which they charge a higher price (with higher pricing being typical of higher-end units, and also typical of Cisco).
As a former Cisco customer I can say with some confidence that Cisco is WELL known for shipping higher priced units when features are comparable to other vendors.
No wonder IBM does not reveal shipped units due to their business selling high-price s390 and power boxes.
KarelG – they are in “Rest of Market” for units shipped along with Cisco and others.
Took me a moment to figure out that ODM Direct wasn’t a manufacturer. A brief note would probably help to avoid confusion.
Cheers :)
@sleepy : Cisco would claim those higher costs are down to quality and the ecosystem. Damn! I’m five days too early for April Fools ;-)
* I should add that I spent over 10 years as a cisco infra guy.