
AMD EPYC 9996 Performance: Peak Venice
For our Venice launch review, we have AMD’s flagship many-core part, the EPYC 9996. This is peak Venice, with 256 Zen 6c CPU cores running at a maximum boost clock of 4.1GHz, 1024MB of L3 cache, and a toasty 600 Watt TDP. Suffice it to say, this is a chip designed for throughput, be it a handful of workloads that can be spread out over so many threads, or many workloads that together can saturate the CPU.
We wanted to see how the AMD EPYC 9996 stacks up, so we ran it against the AMD EPYC 9965 (the previous-generation high-core-count part), NVIDIA Vera, the Intel Xeon 6980P, and NVIDIA Grace in the Supermicro GB300 station. Unless we say otherwise, these results use one socket. A number of these machines are dual-socket servers, so we bound the tests to one socket to keep the comparison fair.
| STH Venice Launch Test Systems | |||||
| Processor | Cores / Threads | Memory | Kernel | Page size | SMT |
|---|---|---|---|---|---|
| AMD EPYC 9996 | 256 / 512 | 2,011 GB | 7.0.0-42-generic | 4K | Off for AgentSTH scaling; on for SPEC and workloads |
| AMD EPYC 9965 | 192 / 384 | 1,507 GB | 7.0.0-42-generic | 4K | Off for AgentSTH scaling; on for SPEC and workloads |
| NVIDIA Vera | 88 / 176 | 1,526 GB | 7.0.0-2018-nvidia-bos-64k | 64K | Off for AgentSTH scaling and workloads; on for SPEC |
| Intel Xeon 6980P | 128 / 256 | 2,304 GB | 7.0.0-42-generic | 4K | Off for AgentSTH scaling; on for SPEC and workloads |
| NVIDIA Grace Superchip (GB300) | 72 / 72 | 496 GB | 7.0.0-1019-nvidia-64k | 64K | No SMT |
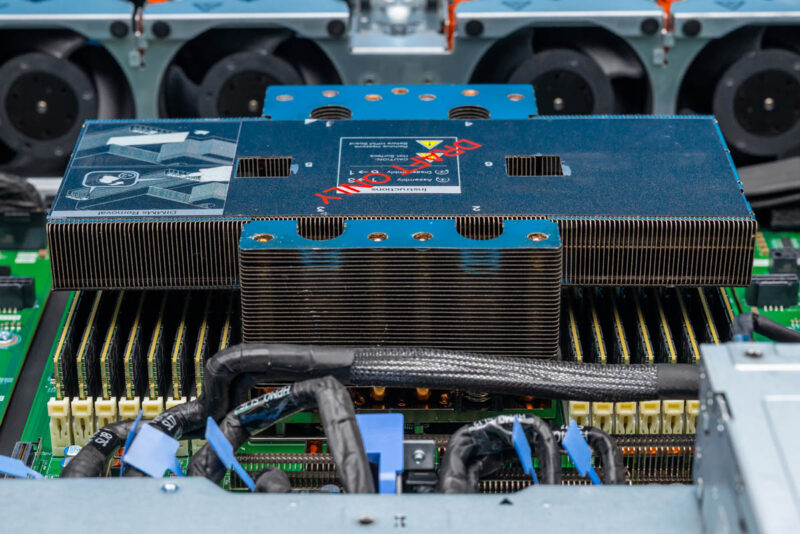
One of the challenges that we had was that our 2P test system from AMD ended up being “delivered” per the freight company tracking on October 22, but in reality it arrived about two weeks later. So instead of using that 2P system with MRDIMMs and both the high core count and higher clock speed parts, we are using the Dell PowerEdge R9815, a 2U single-socket system with just the EPYC 9996 and standard ECC RDIMMs. Not ideal, but we ended up creating something really neat. The other implication is that our power figures at the PDU will be a bit off. We have been working on the new test suite since December 2025 to get ready for the new generation, and so I was hoping for exquisite numbers. Instead, we have pretty good directional numbers, so we will be doing a follow-up.
Beyond that, I wanted an NVIDIA Grace generation part, and we had the Supermicro Super AI Station based on the NVIDIA GB300, so we added that in here. That gives us PCIe Gen5 and Gen6 NVIDIA GPUs, high-core-count PCIe Gen5 and Gen6 AMD CPUs, and the latest P-core Intel CPU. I reached out to Intel about Clearwater Forest because it technically has more cores than the EPYC 9996. We have data from Sierra Forest, and just seeing Intel’s projections on Clearwater Forest uplift, I do not think it would be in the same class as the EPYC 9996.
On the NVIDIA Vera and Grace, we use the recommended 64K page-size setup, only changing it when the benchmark application can’t handle 64K.
AMD EPYC 9996 Latency
We will start with latency, the one place in this review where lower is better. Before a chip can use all those cores, the cores need to talk to each other and reach memory.
Core-to-Core Latency
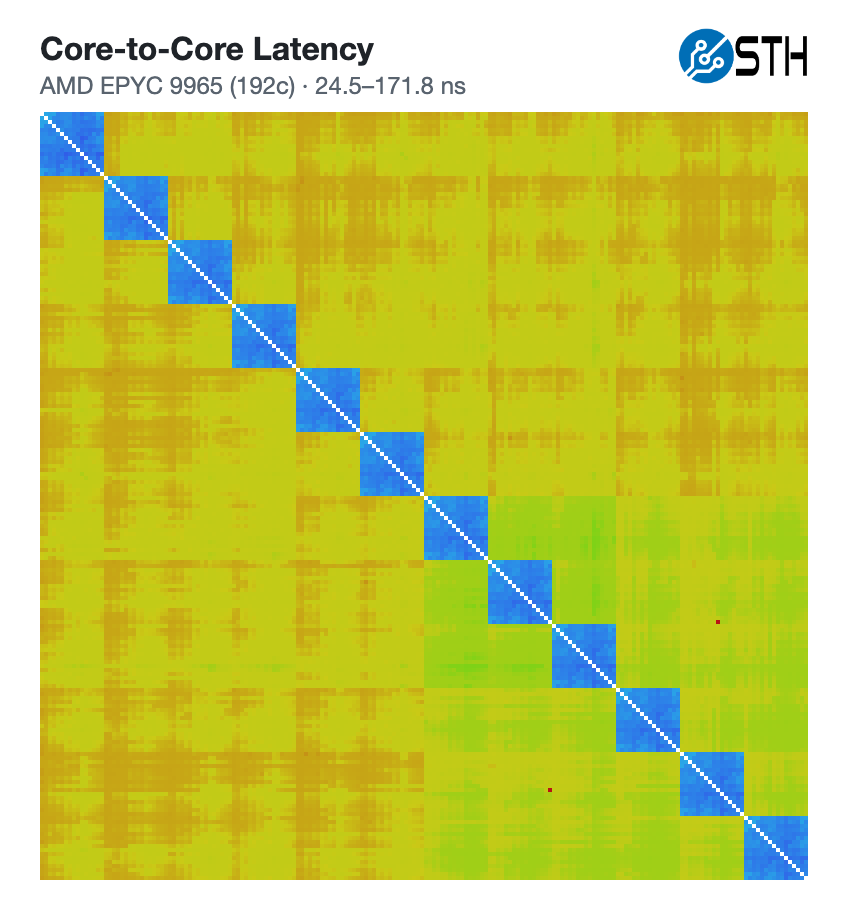
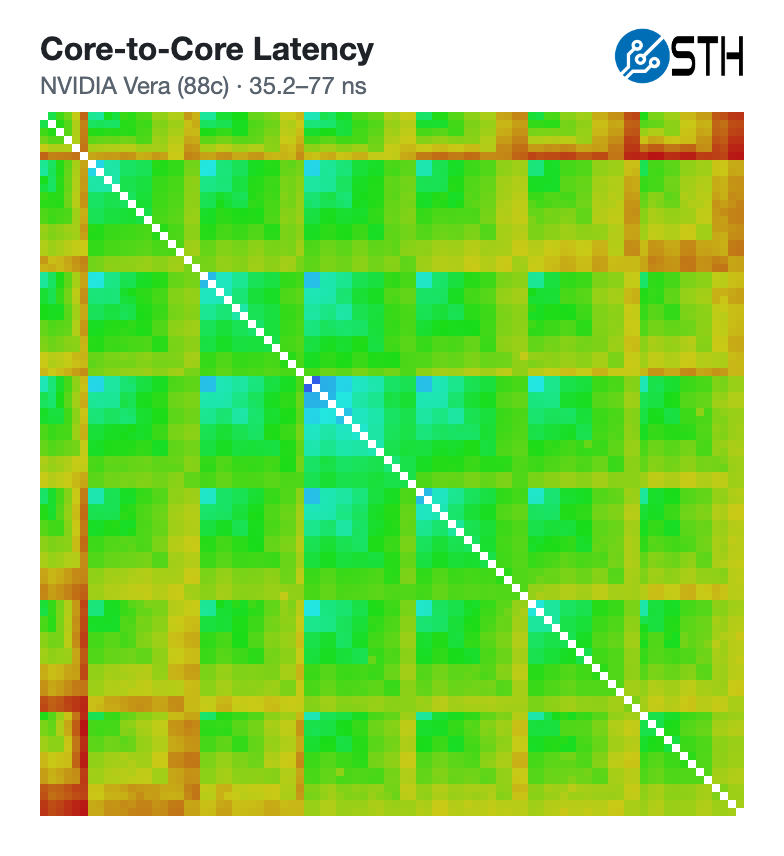
This test measures the round-trip time for a cache line to move between two physical cores. It is one of our favorite ways to see how a chip is built, since clusters and die boundaries show up as blocks and bands. Here is the challenge: on a CPU with 256 cores, this becomes an eye chart very quickly.
Here are the maps, starting with the AMD EPYC 9996 with its 256×256 matrix (65K data points).
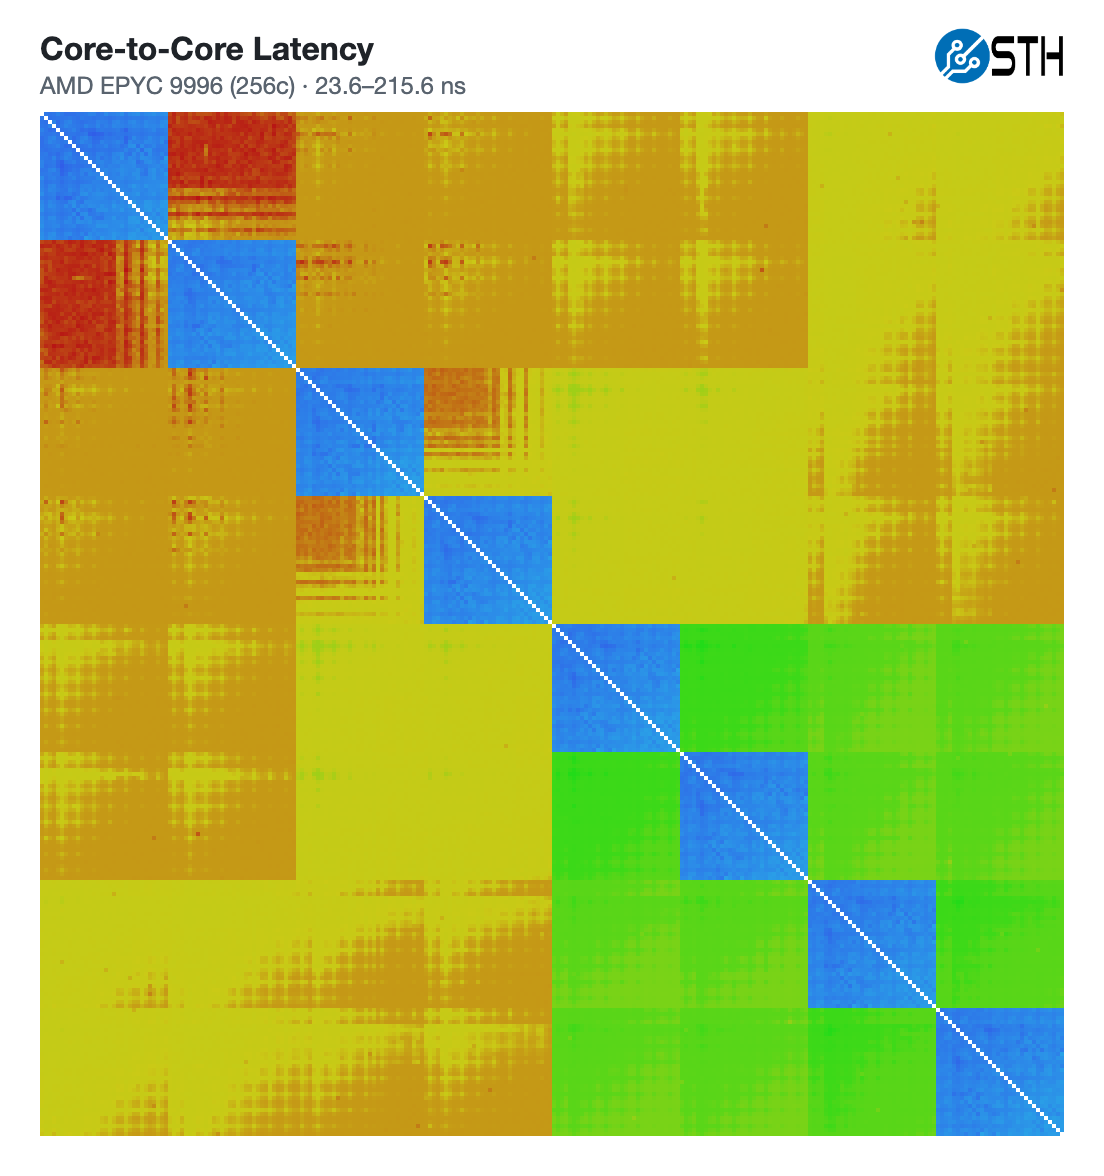
Here, you can see the 32-core CCDs in blue, and you can also see the eight different CCDs in this chart. For context, this would be different if we were looking at a 96-core, higher-frequency part using 12-core CCDs. Maybe the big takeaway is that there are neighborhoods on the EPYC where latency is very good, but there is a hit for a chiplet architecture. We can see something similar when we get to the EPYC 9965 192-core part, but with more chiplets.
NVIDIA Vera has 88 cores, and you can see some localization, but it is more consistent. Interestingly, the best case is higher than Venice’s 32-core CCDs, but the entire chip has only 2.75x the cores of a Venice CCD.
Here is the Intel Xeon 6980P:
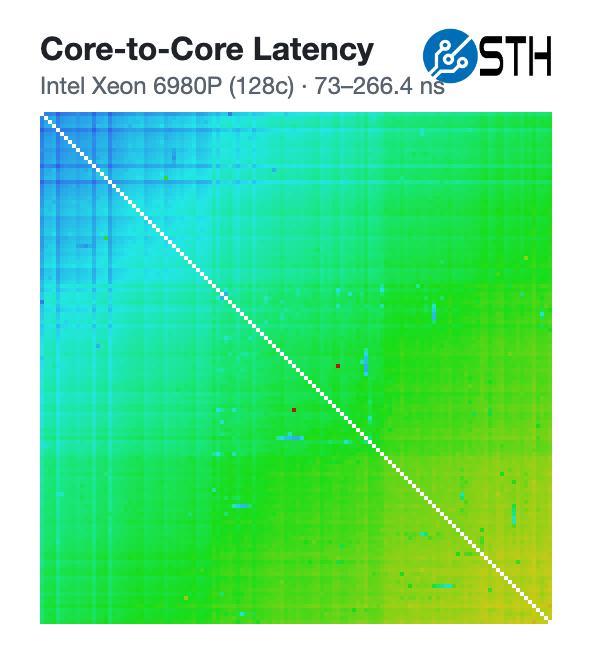
The NVIDIA Grace and Intel Xeon have higher minimums. We also see small blips along the test matrix.
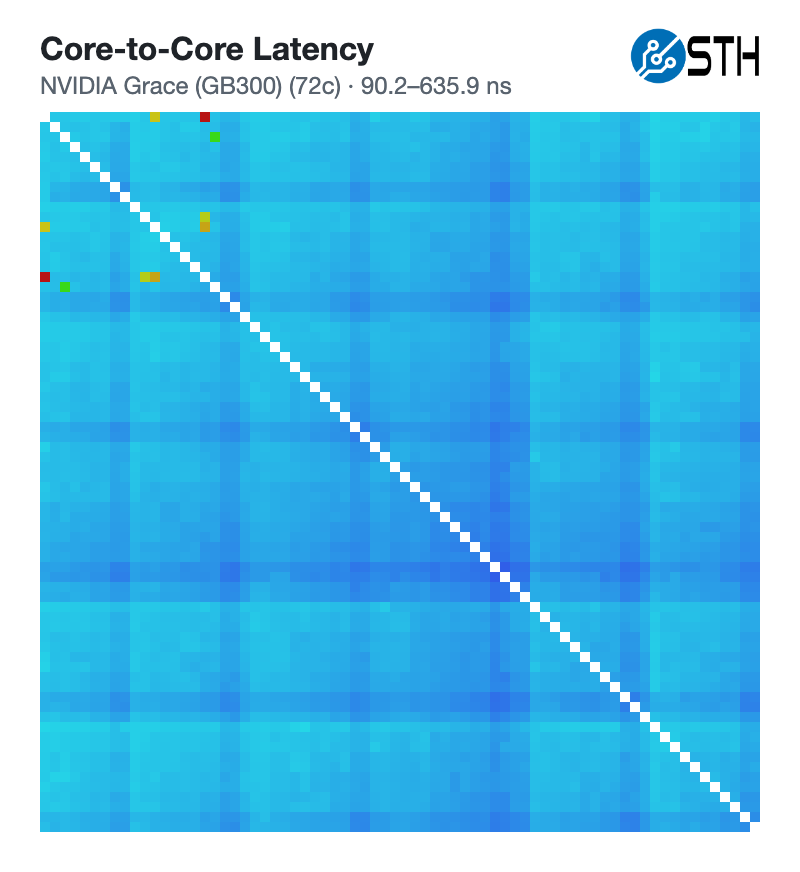
A few of the maximum values seem like we captured little blips, but here are the min, median, and max from what we captured.
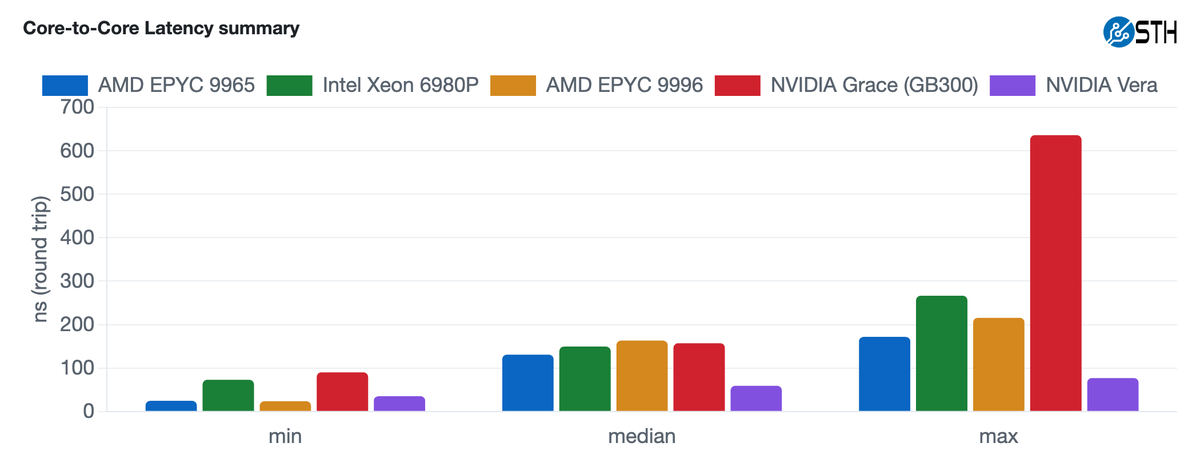
AMD has the tough task of connecting 256 cores on a single socket. As the topology gets larger, we would expect latencies to rise. Compared to the Xeon 6980P with half the cores, AMD looks pretty good.
Keep in mind here that all of this follows numerous architectural changes with Venice. The CCDs on our 256 core chip have twice as many CPU cores as before, the IOD is now split in two – meaning that reaching far CCDs now requires going through multiple IODs instead of just one – and the CCDs have been moved to be directly adjacent to the IODs in order to eliminate the physical distance between them. The latter appears to be doing a lot of the heavy lifting here, as shortening the paths from the IODs to the CCDs has trimmed off enough latency to keep the median latency in check even with the additional cores.
Multichase Memory Latency
Multichase is a pointer-chasing test. Each load depends on the last one, so the prefetchers cannot hide much. As the working set grows, it spills out of each cache level, and you can read the latency of each level off the curve.
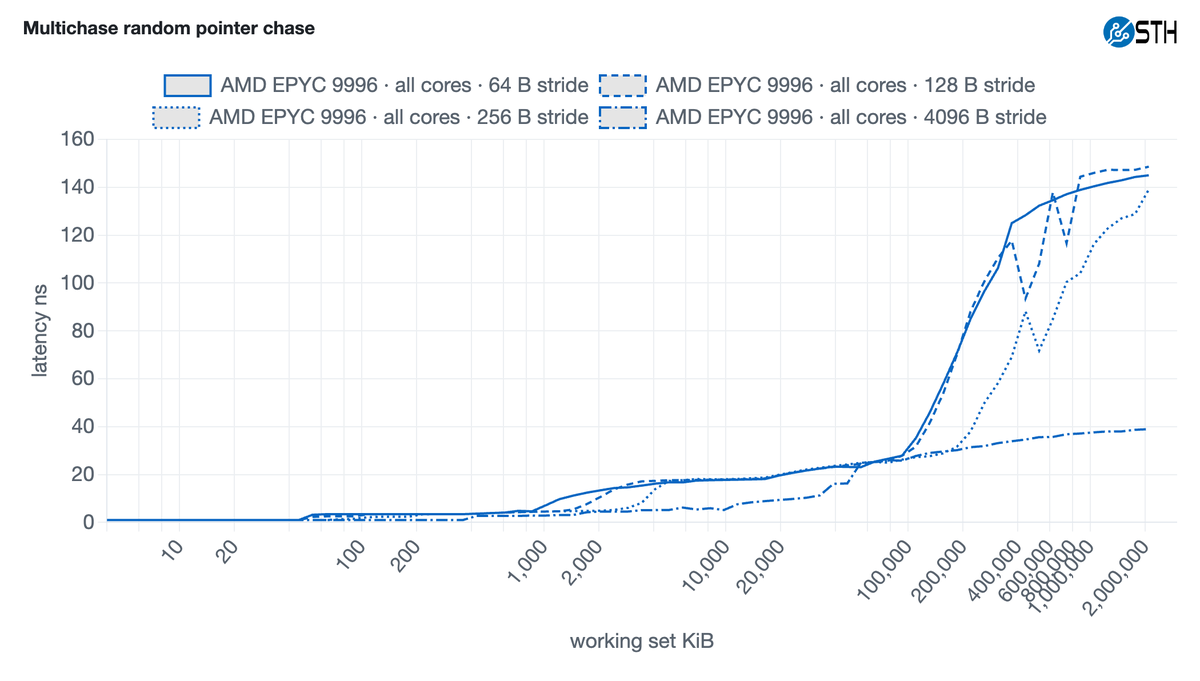
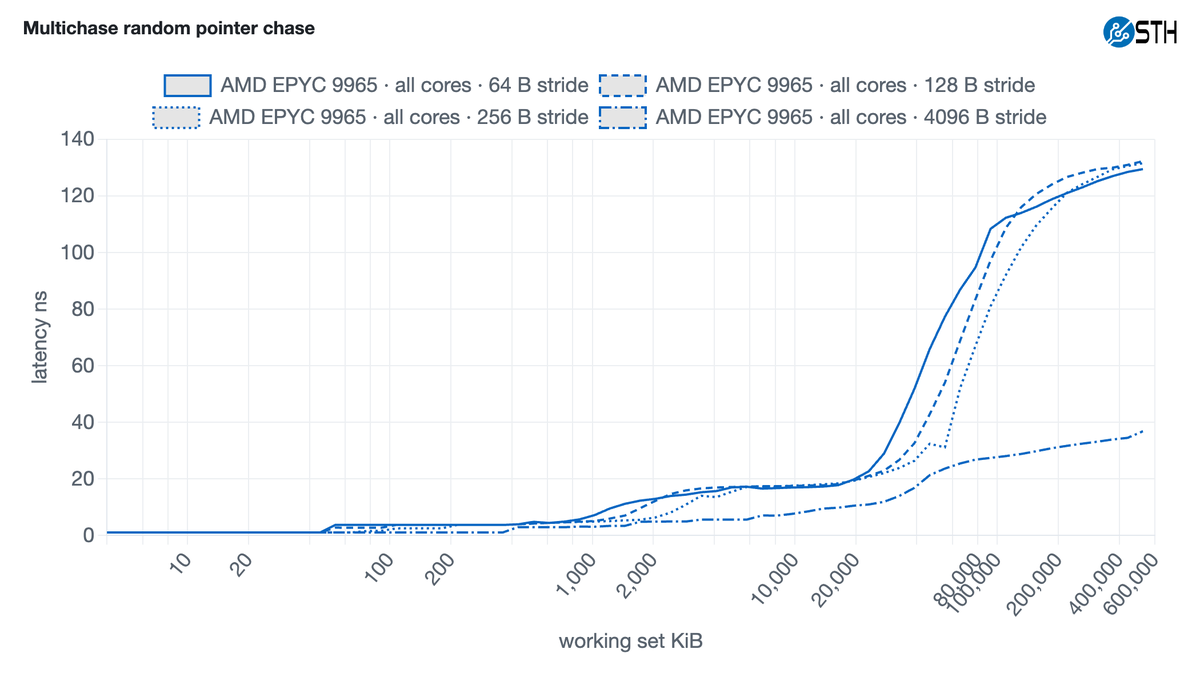
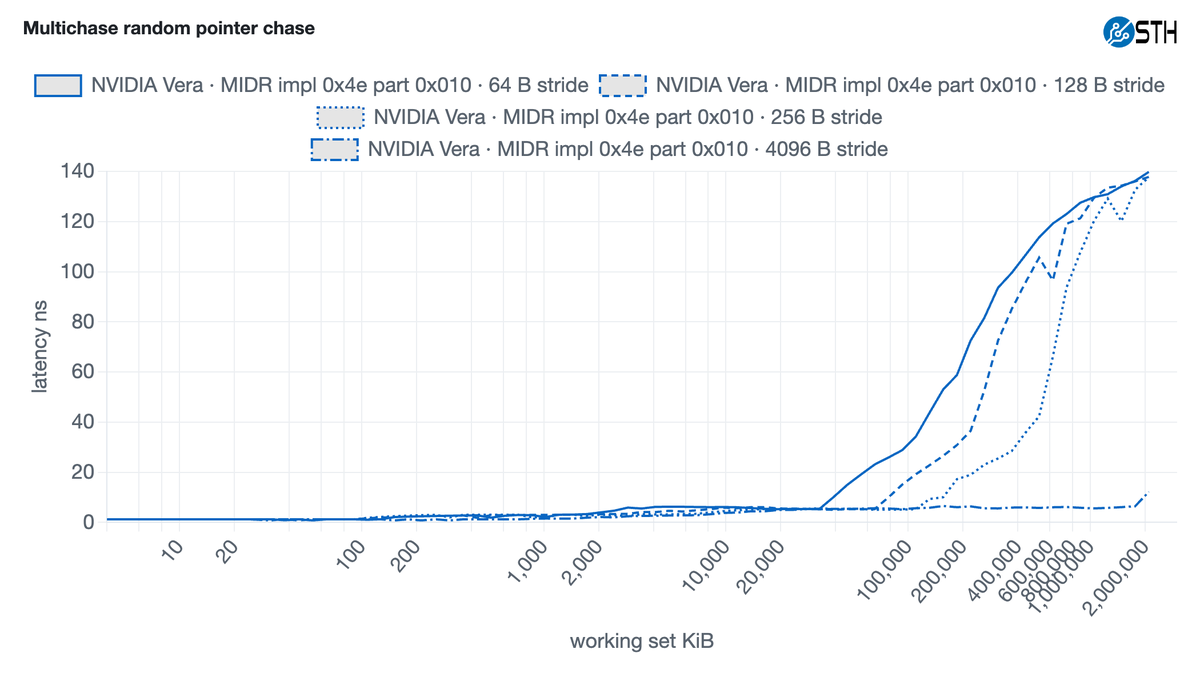
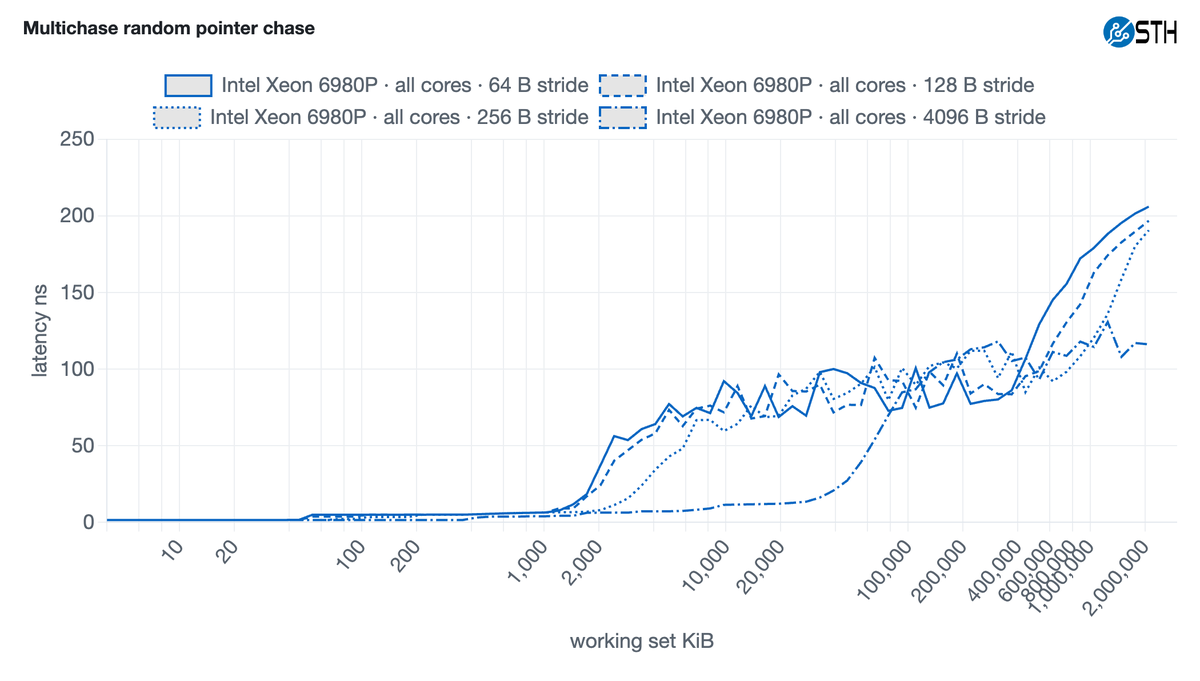
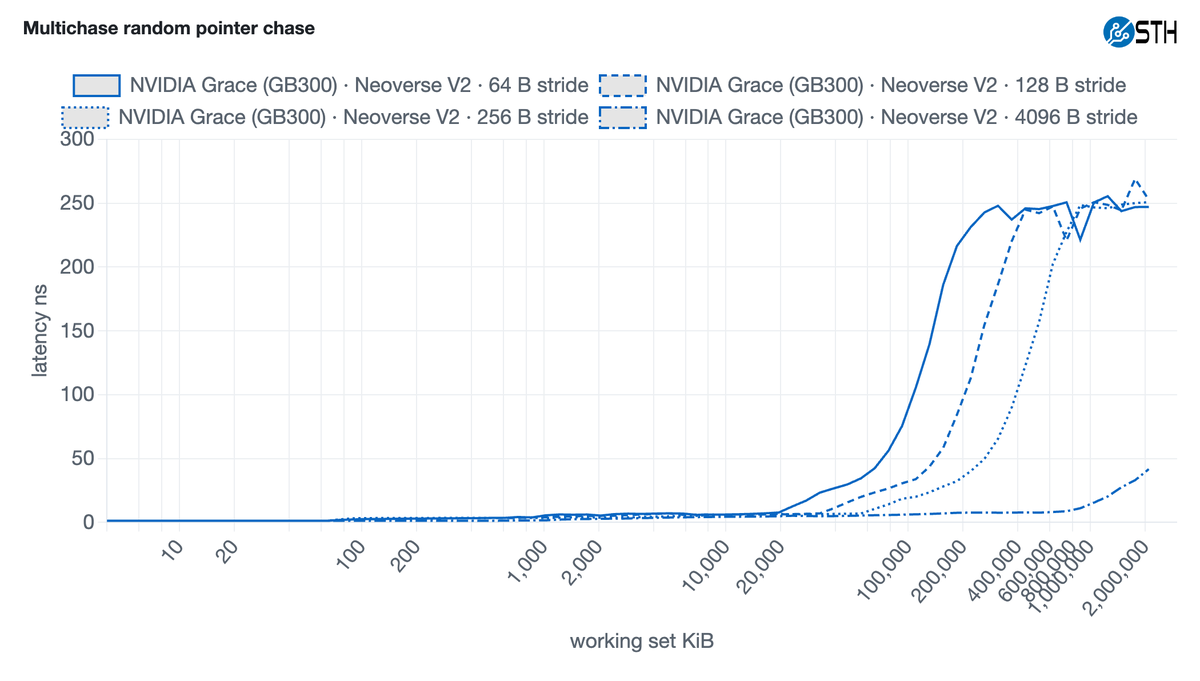
With a 64 byte stride, the EPYC 9996 climbs to about 143 ns once the working set is well past L3. The 4096 B stride stays much lower at the same sizes, so the prefetchers are covering a lot of that walk.
To compare the chips directly, here is the 64 B stride from each system on one chart.
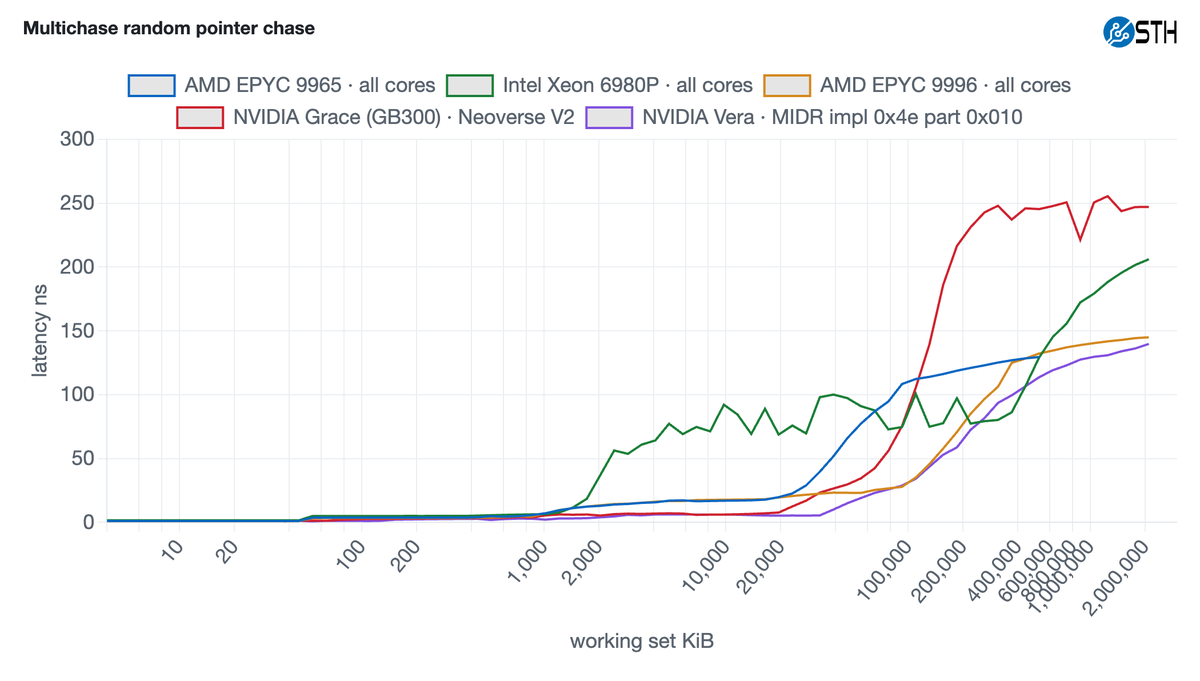
At the largest working sets, the EPYC 9996 is at 143 ns, a little behind the EPYC 9965 at 127 ns and Vera at 134 ns, and well ahead of the Xeon 6980P at 196 ns and Grace at 247 ns. The Xeon 6980P and Vera curves come from the full 2-socket machines pinned to a socket 0 CPU, and the Xeon’s L3 region is pretty noisy even through re-runs.