Intel Xeon Gold 6250 Benchmarks
For this exercise, we are using our legacy Linux-Bench scripts which help us see cross-platform “least common denominator” results we have been using for years as well as several results from our updated Linux-Bench2 scripts. Starting with our 2nd Generation Intel Xeon Scalable benchmarks, we are adding a number of our workload testing features to the mix as the next evolution of our platform.
At this point, our benchmarking sessions take days to run and we are generating well over a thousand data points. We are also running workloads for software companies that want to see how their software works on the latest hardware. As a result, this is a small sample of the data we are collecting and can share publicly. Our position is always that we are happy to provide some free data but we also have services to let companies run their own workloads in our lab, such as with our DemoEval service. What we do provide is an extremely controlled environment where we know every step is exactly the same and each run is done in a real-world data center, not a test bench.
We are going to show off a few results, and highlight a number of interesting data points in this article.
Python Linux 4.4.2 Kernel Compile Benchmark
This is one of the most requested benchmarks for STH over the past few years. The task was simple, we have a standard configuration file, the Linux 4.4.2 kernel from kernel.org, and make the standard auto-generated configuration utilizing every thread in the system. We are expressing results in terms of compiles per hour to make the results easier to read:
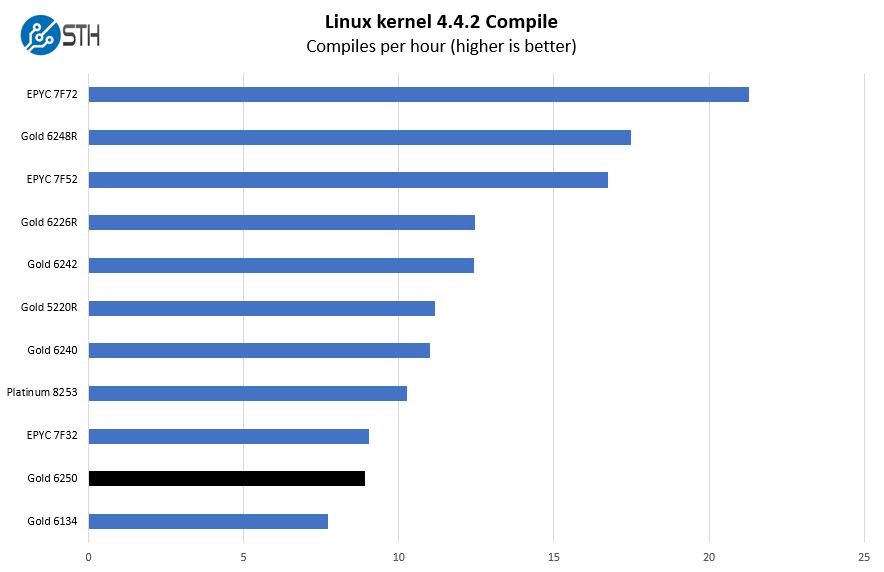
We are adding a lot more to the comparison set. Often, the Intel Xeon Gold 6134 and AMD EPYC 7F32 age going to be the primary competitors here based on core counts. Still, when we did this, the charts became very repetitive with three results.
Here, we see the EPYC 7F32, AMD’s frequency optimized 8-core part slightly ahead of the Xeon Gold 6250, but they are fairly close.
c-ray 1.1 Performance
We have been using c-ray for our performance testing for years now. It is a ray tracing benchmark that is extremely popular to show differences in processors under multi-threaded workloads. We are going to use our 8K results which work well at this end of the performance spectrum.
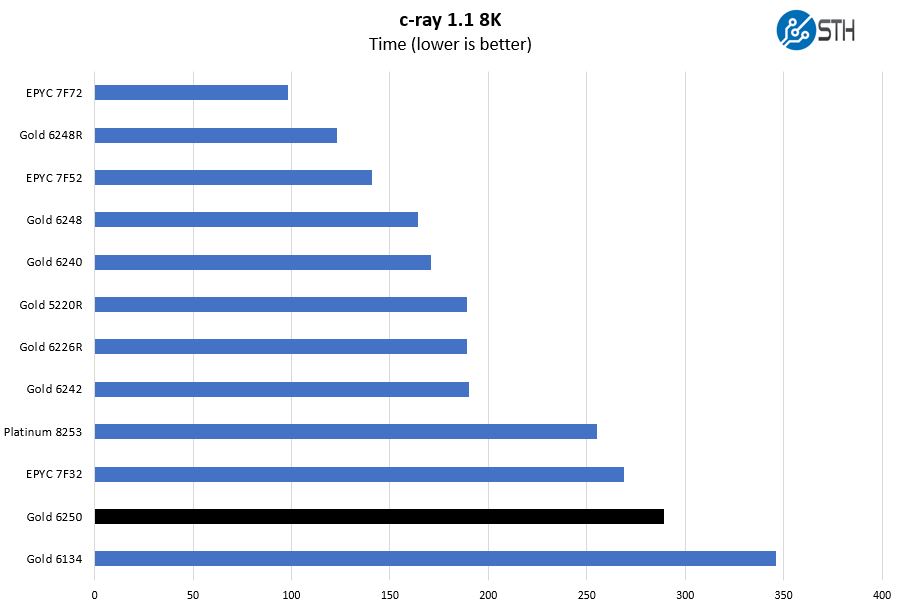
This test tends to highly favor the AMD core and cache hierarchy. That is one reason, for example, that AMD tends to use benchmarks such as Cinebench on the workstation marketing side. We somewhat predictably see the EPYC 7F32 ahead here.
7-zip Compression Performance
7-zip is a widely used compression/ decompression program that works cross-platform. We started using the program during our early days with Windows testing. It is now part of Linux-Bench.
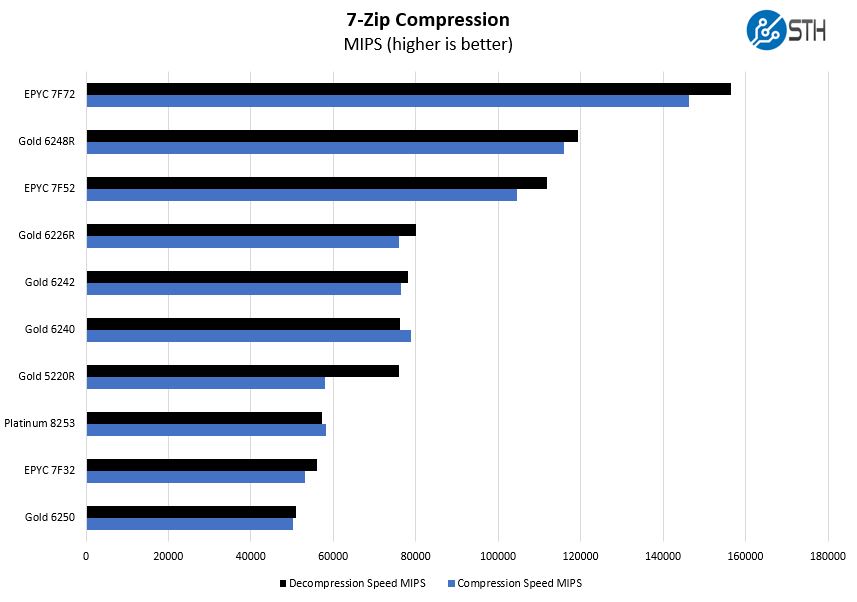
Here we wanted to point out how much of a premium one is paying. At $3400, it is around $700 list price or close to 30% more than the Intel Xeon Gold 6248R, but offers dramatically less overall performance. Instead, focusing on per-core performance means the market will accept and demand a much higher cost per core here.
NAMD Performance
NAMD is a molecular modeling benchmark developed by the Theoretical and Computational Biophysics Group in the Beckman Institute for Advanced Science and Technology at the University of Illinois at Urbana-Champaign. More information on the benchmark can be found here. With GROMACS we have been working hard to support AVX-512 and AVX2 architectures. Here are the comparison results for the legacy data set:
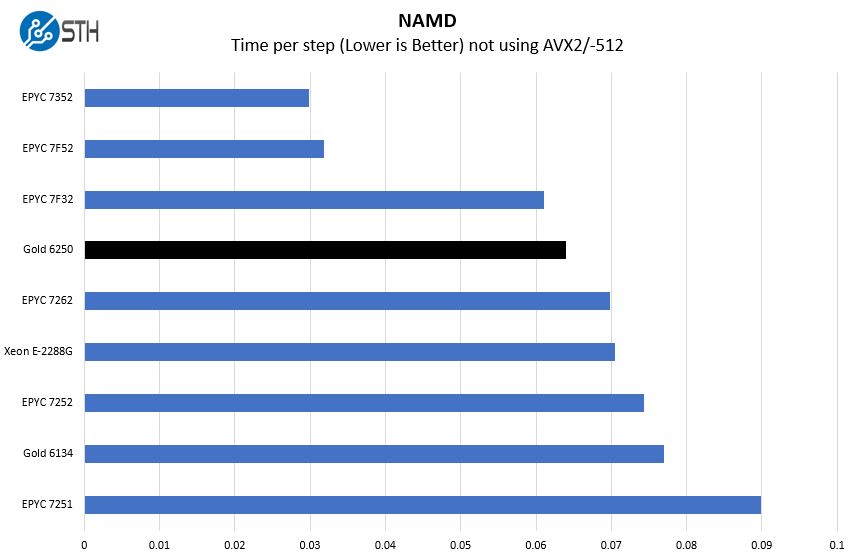
We pulled in single-socket results here of smaller CPUs to highlight an interesting comparison. Many may ask whether the Xeon E-2288G which can hit an even 5GHz turbo clock and is also an 8-core Xeon is a competitor in this market. The Xeon Scalable parts are much more robust platforms. While on simple tests we can see the 8-core entry Xeons perform well, as environments get more demanding, the Xeon E-2288G cannot keep up. We will revisit this in our GROMACS testing where we can utilize AVX-512 as well.
Sysbench CPU test
Sysbench is another one of those widely used Linux benchmarks. We specifically are using the CPU test, not the OLTP test that we use for some storage testing. Here are single-threaded results:
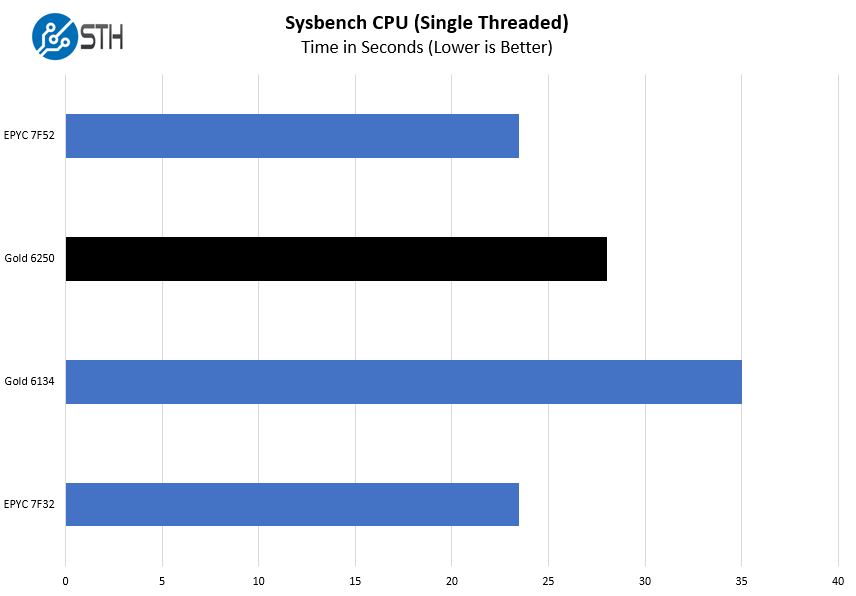
There is a fairly common misconception among some that these chips are all about single core performance. In some ways, that is true since there are software packages completely limited by a single core. On the other hand, we tend to find that most applications are limited by software licenses thus are seeking the most performance per core, not the highest single-core performance. If you think about that conceptually, if we simply wanted the highest single-core performance we would not see dual-socket database servers as an example since firing up the UPI link takes package power budget. Still for those looking at single-thread performance, here is an example.
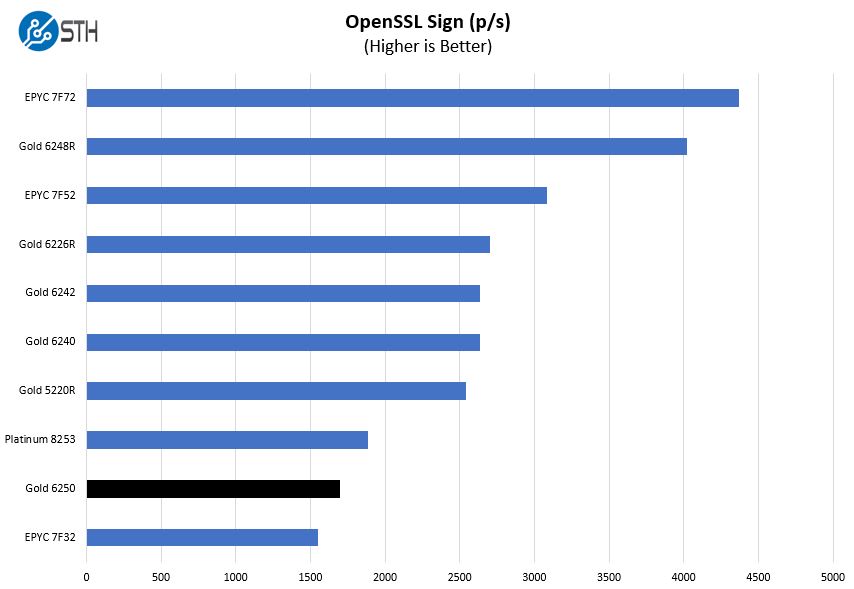
OpenSSL Performance
OpenSSL is widely used to secure communications between servers. This is an important protocol in many server stacks. We first look at our sign tests:
Here are the verify results:
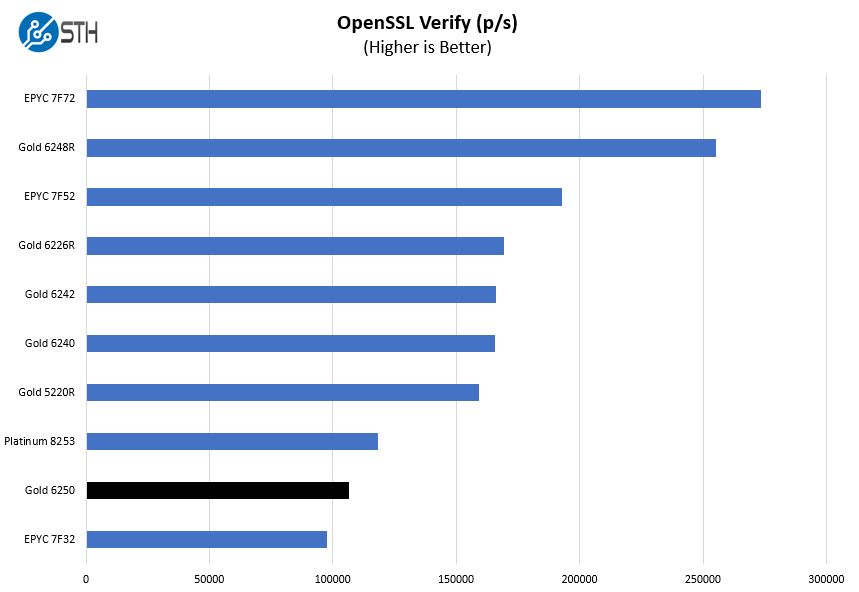
In our OpenSSL testing, we found the Gold 6250 out-performs the AMD EPYC 7F32. OpenSSL is a very important fundamental technology so it is important to see how the Gold 6250 performs here.
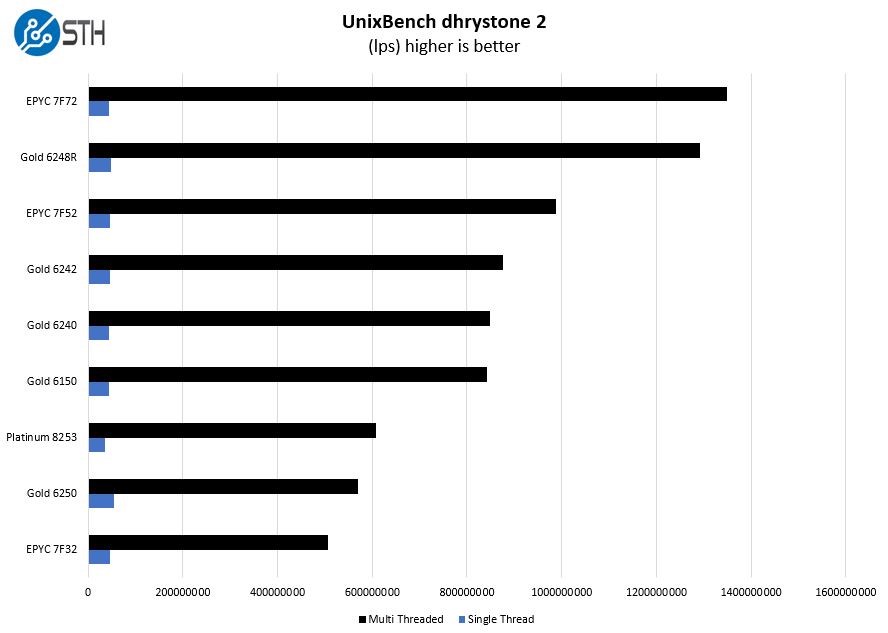
UnixBench Dhrystone 2 and Whetstone Benchmarks
Some of the longest-running tests at STH are the venerable UnixBench 5.1.3 Dhrystone 2 and Whetstone results. They are certainly aging, however, we constantly get requests for them, and many angry notes when we leave them out. UnixBench is widely used so we are including it in this data set. Here are the Dhrystone 2 results:
Here are the whetstone results:
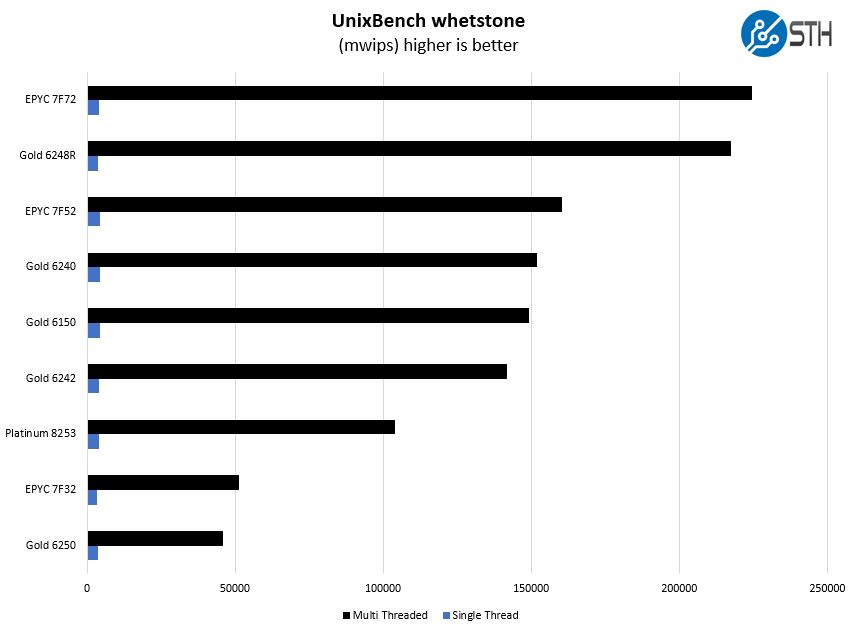
We wanted to address something here that may confuse many of our readers. The Intel Xeon Gold 6150 was priced around the same $3400 level which may lead buyers to think the Gold 6250 is a direct replacement. The Gold 6150 is an 18-core CPU while the Gold 6250 is an 8-core CPU. While the model numbers and prices are similar and there is an “8” digit in their core counts they are intended for vastly different markets.
It would be hard to recommend a Xeon Gold 6150 today given the 2nd Gen Intel Xeon Scalable and Big 2nd Gen Intel Xeon Scalable Refresh parts changing the market. The Gold 6250, however, is going to be a popular chip in some segments.
GROMACS STH Medium AVX2/ AVX-512 Enabled
We have a small GROMACS molecule simulation we previewed in the first AMD EPYC 7601 Linux benchmarks piece. In Linux-Bench2 we are using our “small” case which is appropriate for single-socket servers. Our GROMACS test will use the AVX-512 and AVX2 extensions if available.
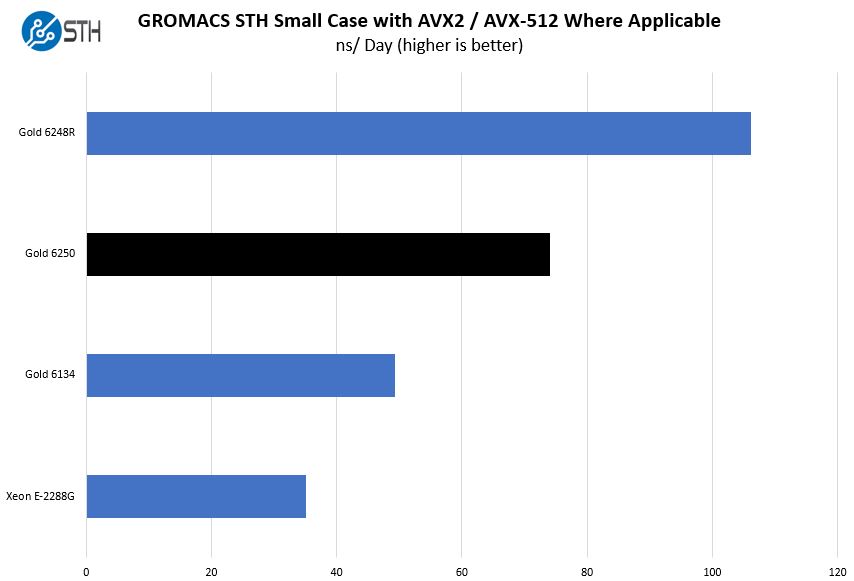
Taking a step back and looking at what AVX-512 can do for a chip, we wanted to pull out a few examples. In this case, that builds on our NAMD results in some ways, one can see the impact of a few things. The Xeon Gold 6250 has a higher TDP and AVX-512 capabilities. As a result, it absolutely crushes the Xeon E-2288G here.
Another interesting note is that we see the impacts of hitting scaling and TDP walls here. The Intel Xeon Gold 6248R turns in a far better result than the Xeon Gold 6250 due to having three times the number of cores. At the same time, the increase is not 3x. That has to do with application scaling, frequencies, and TDP limits.
Chess Benchmarking
Chess is an interesting use case since it has almost unlimited complexity. Over the years, we have received a number of requests to bring back chess benchmarking. We have been profiling systems and now use the results in our mainstream reviews:
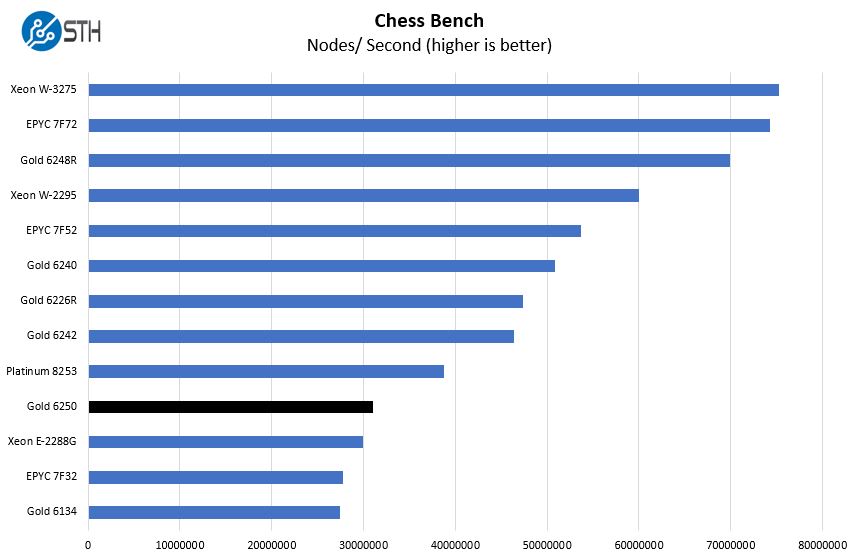
One may have noticed the Xeon Gold 6134 here. That was a previous-gen 8-core frequency optimized part that we actually used heavily at STH. The new Xeon Gold 6250 shows vastly higher performance.
STH STFB KVM Virtualization Testing
One of the other workloads we wanted to share is from one of our DemoEval customers. We have permission to publish the results, but the application itself being tested is closed source. This is a KVM virtualization-based workload where our client is testing how many VMs it can have online at a given time while completing work under the target SLA. Each VM is a self-contained worker.
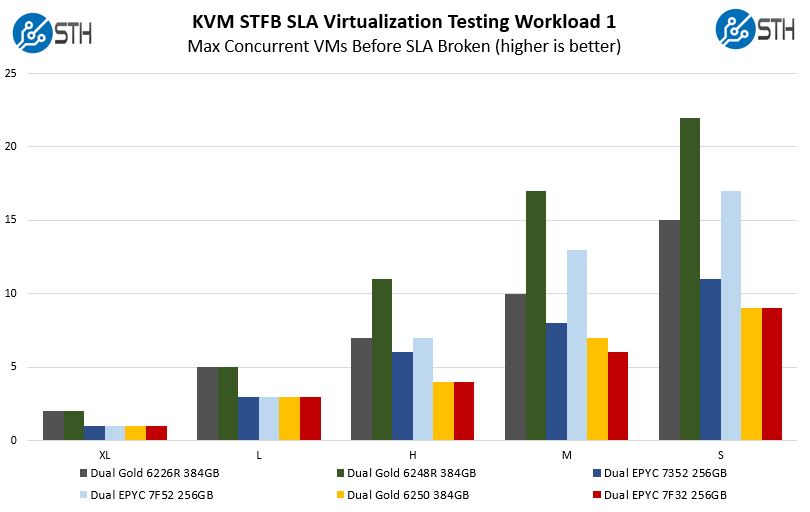
Here we tried giving some sense of what we are getting in terms of virtualization performance. Looking at the direct comparison between the Xeon Gold 6250 and EPYC 7F32 we can see nearly identical performance when hitting SLAs.
As we mentioned in the EPYC 7F32 review, something that is not obvious from the chart is that the Medium delta looks bigger than it is. When we do our test runs, throw out the top and bottom quartile of results, then average the remaining, we rounded up for Intel and down for AMD. Intel did perform better, but it was much closer than it looks on these charts. Part of the reason is that these tests were designed for higher core counts assuming that the EPYC 7F32 and Gold 6250 would be about the minimum required to run one of the XL VMs. Since we are at the lower end of the test spectrum, we lose resolution here.
SPECrate2017_int_base
The last benchmark we wanted to look at is SPECrate2017_int_base performance. Specifically, we wanted to show the difference between what we get with Intel Xeon icc and AMD EPYC AOCC results.
Server vendors get better results than we do, but this gives you an idea of where we are at in terms of what we have seen:
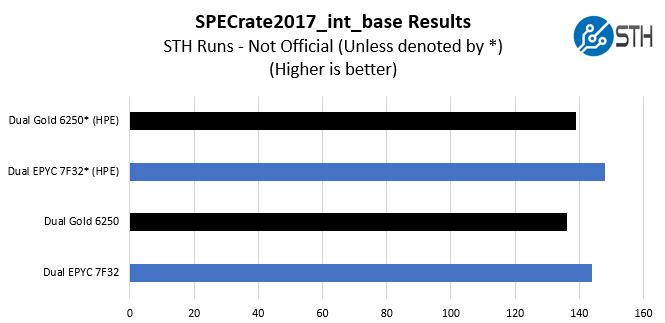
We received some comments noting we were a bit behind vendor results for some of our other tests, a fact that we noted in those reviews. Here we wanted to show both what we measured, and what server OEMs are measuring comparing the two chips.
HPE is a large server vendor so we are using their results from their dual-socket platforms (Gold 6250 on the HPE ProLiant DL380 Gen10 here and EPYC 7F32 on the ProLiant DL385 Gen10 Plus here.) If the actual values are important, then we suggest looking at the published results for the server(s) you are evaluating.
In either case with HPE’s results, or ours, we get a similar delta between the two chips. The AMD EPYC 7F32 pulls ahead of the Xeon Gold 6250 by a notable margin. For some buyers, this will be enough to jump to the EPYC platform. For others, they will want to see a larger delta. That is the market reality.
Next, we are going to discuss market positioning and impact before getting to our final words.


Looking forward to ZEN3
I really appreciate the high-frequency reviews. In my industry (semiconductors) simulation is (usually) a single-core process with very high licensing costs so money spent on faster cores is a no-brainer. While the proprietary software is obviously difficult to include in benchmarks I’d love to see Verilator benchmarks against an open-source core (e.g. Rocketchip)
There’s another facet that is perhaps too obvious to mention, but when the “long-pole” to tapeout are jobs that may run for 2-3 weeks, a high frequency part may get you there a week earlier. That’s real money, especially for a small company which, if it misses its window, might have to wait more than a month to get another slot at the fab.
so, roughly an 8700K with ECC support for $3400?
Seems tad….pricey. Might as well just include an Epyc mainboard and CPU at that cost
Review is written (seems to me) from the server oriented point of view. If someone needs workstation and does not need that much RAM, he/she can also try to use Threadripper or Xeon W line of CPUs. In the former case RAM max on 256GB, in later on 1TB. Both lines provide high frequency cores cheaper than compared/considered Epyc F/Xeon Gold.
Comments are closed.