Intel Xeon Gold 6134 Benchmarks
For this exercise, we are using our legacy Linux-Bench scripts which help us see cross-platform “least common denominator” results we have been using for years as well as several results from our updated Linux-Bench2 scripts. At this point, our benchmarking sessions take days to run and we are generating well over a thousand data points. We are also running workloads for software companies that want to see how their software works on the latest hardware. As a result, this is a small sample of the data we are collecting and can share publicly. Our position is always that we are happy to provide some free data but we also have services to let companies run their own workloads in our lab, such as with our DemoEval service. What we do provide is an extremely controlled environment where we know every step is exactly the same and each run is done in a real-world data center, not a test bench.
Python Linux 4.4.2 Kernel Compile Benchmark
This is one of the most requested benchmarks for STH over the past few years. The task was simple, we have a standard configuration file, the Linux 4.4.2 kernel from kernel.org, and make the standard auto-generated configuration utilizing every thread in the system. We are expressing results in terms of compiles per hour to make the results easier to read.
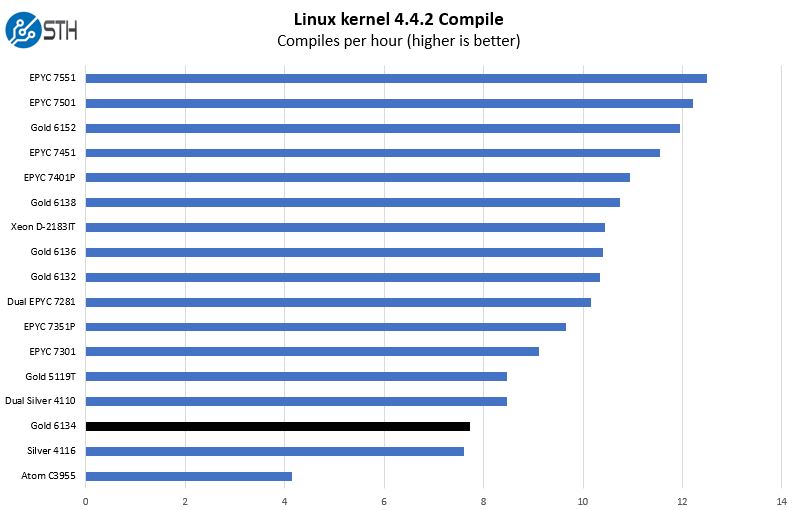
Here you can see the clock speed and cache impact. The Intel Xeon Silver 4116 has 12 cores, the dual Intel Xeon Silver 4110 setup has 16 cores total, yet the 8 core Intel Xeon Gold 6134 falls between those two.
c-ray 1.1 Performance
We have been using c-ray for our performance testing for years now. It is a ray tracing benchmark that is extremely popular to show differences in processors under multi-threaded workloads. Given the speed of this generation of CPUs, our older generation 4K results did not show a large enough difference between CPUs. Instead, we are using our Linux-Bench2 8K results to show differences.
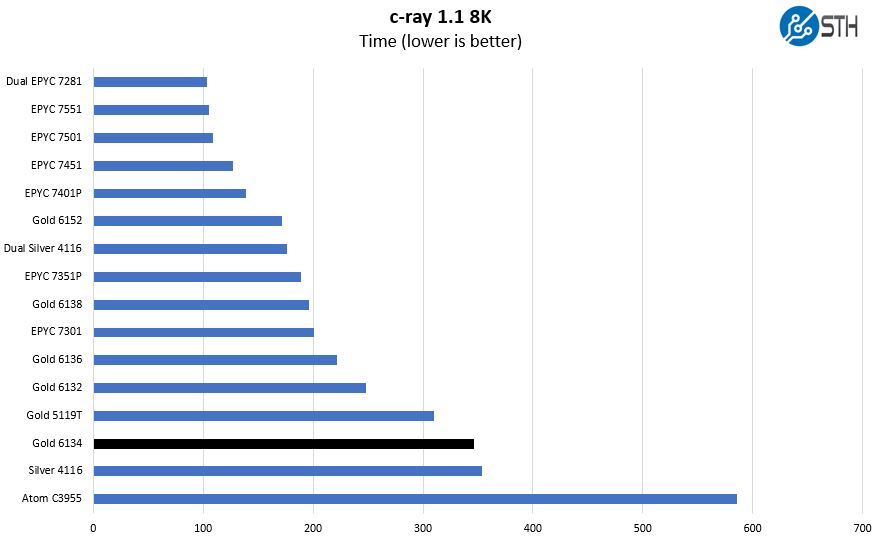
This is a workload where we see the 8 core Intel Xeon Gold 6134 again perform between 12 and 14 core options. At the same time, this test runs mostly out of L1/L2 cache on Intel Xeon Scalable CPUs so we are not seeing benefits from the additional L3 cache here.
7-zip Compression Performance
7-zip is a widely used compression/ decompression program that works cross-platform. We started using the program during our early days with Windows testing. It is now part of Linux-Bench.
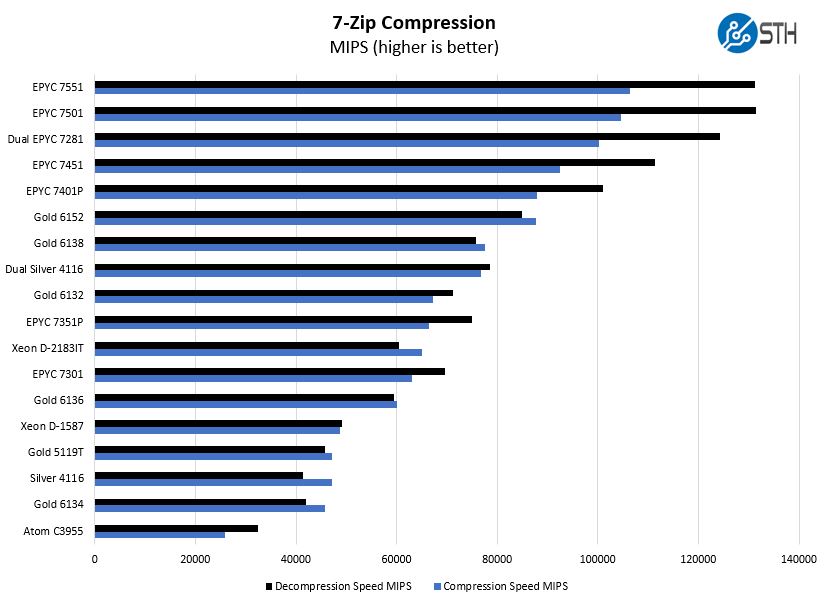
Again, we see that performance is about on par with 12 core Xeon Silver while 14 core Intel Xeon Gold CPUs pull ahead slightly.
NAMD Performance
NAMD is a molecular modeling benchmark developed by the Theoretical and Computational Biophysics Group in the Beckman Institute for Advanced Science and Technology at the University of Illinois at Urbana-Champaign. More information on the benchmark can be found here. We are going to augment this with GROMACS in the next-generation Linux-Bench in the near future. With GROMACS we have been working hard to support Intel’s Skylake AVX-512 and AVX2 supporting AMD Zen architecture. Here are the comparison results for the legacy data set:
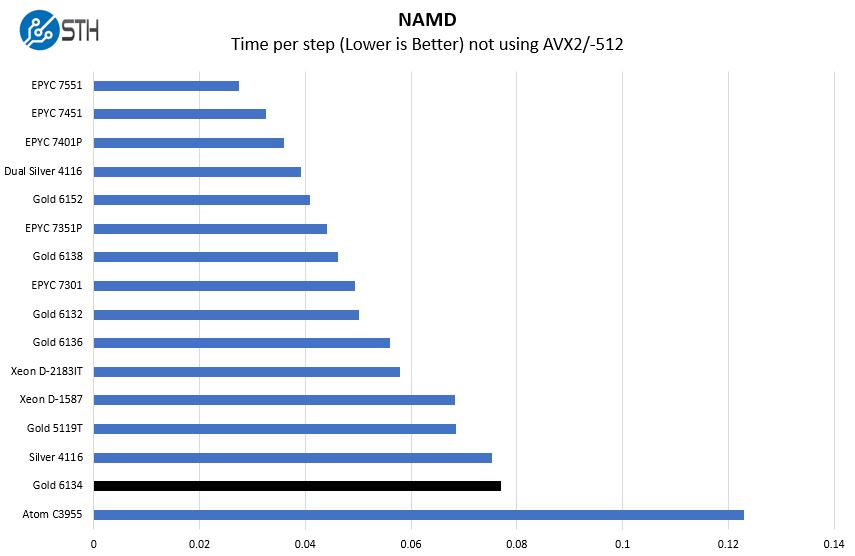
While it may look more like a CPU with only 50% more cores in this test, when we get to the GROMACS benchmark you will clearly see the impact of the dual port FMA present in the Xeon Gold 6100 and Platinum 8100 series products.
Sysbench CPU test
Sysbench is another one of those widely used Linux benchmarks. We specifically are using the CPU test, not the OLTP test that we use for some storage testing.
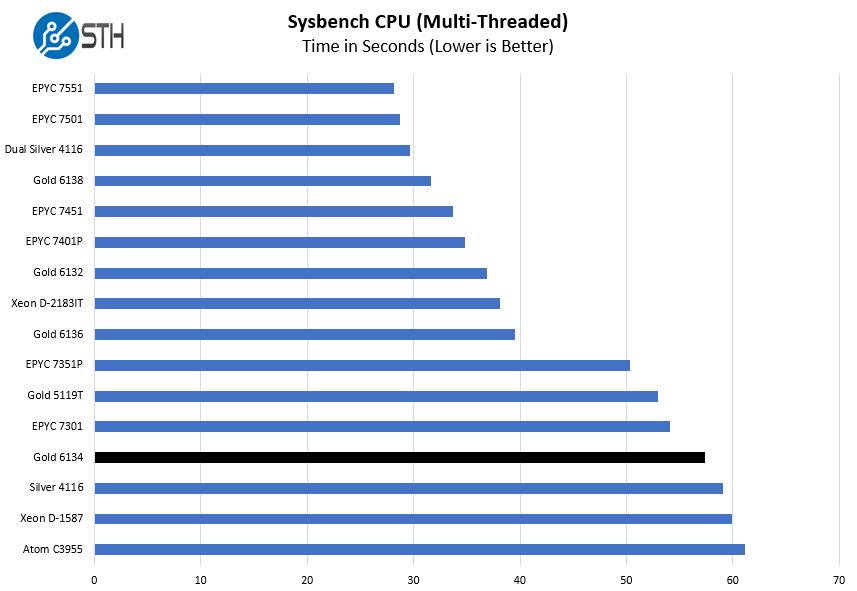
Here we see the Intel Xeon Gold 6134 perform better than the 12 core Intel Xeon Silver 4116 and the 16 core Intel Xeon D-1587 embedded part. That is impressive given the lower core count.
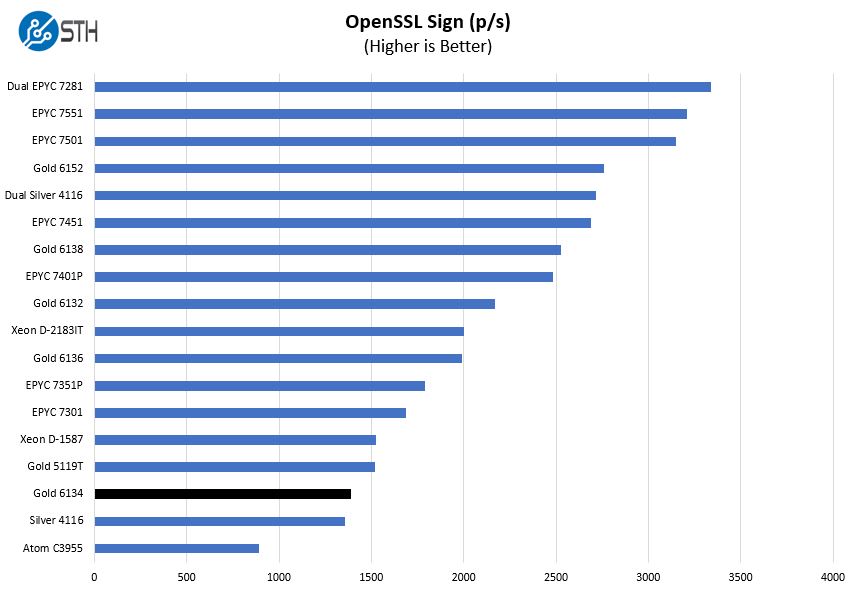
OpenSSL Performance
OpenSSL is widely used to secure communications between servers. This is an important protocol in many server stacks. We first look at our sign tests:
Here are the verify results:
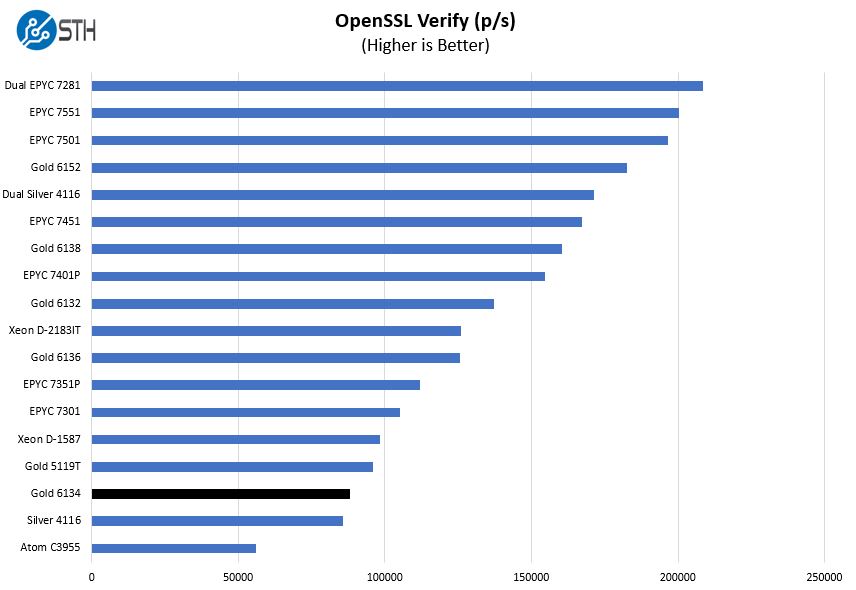
OpenSSL is a popular component in many applications these days so the performance here is important. Again, we are seeing performance above a 12 core Intel Xeon Silver 4116.
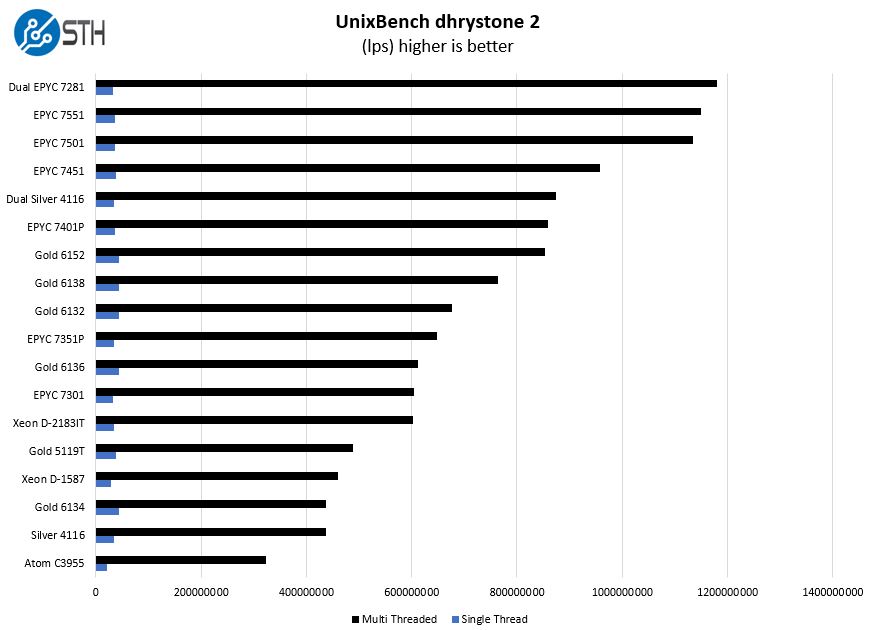
UnixBench Dhrystone 2 and Whetstone Benchmarks
Some of the longest-running tests at STH are the venerable UnixBench 5.1.3 Dhrystone 2 and Whetstone results. They are certainly aging, however, we constantly get requests for them, and many angry notes when we leave them out. UnixBench is widely used so we are including it in this data set. Here are the Dhrystone 2 results:
and the whetstone benchmarks:
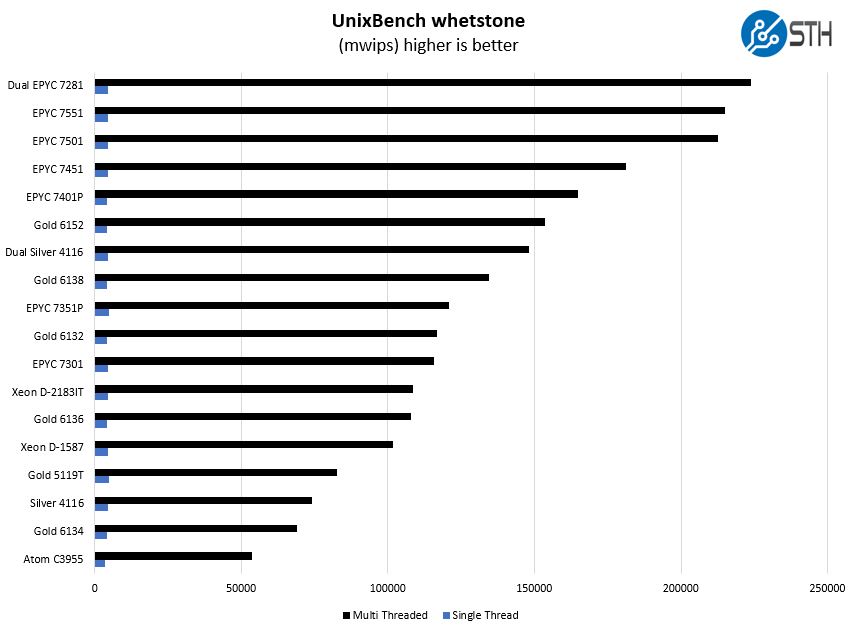
On the dhrystone 2 chart, due to the scale, you can better see the impact of the clock speeds. The per-core performance is much higher with these CPUs.
GROMACS STH Small AVX2/ AVX-512 Enabled
We have a small GROMACS molecule simulation we previewed in the first AMD EPYC 7601 Linux benchmarks piece. In Linux-Bench2 we are using a “small” test for single and dual socket capable machines. Our medium test is more appropriate for higher-end dual and quad socket machines. Our GROMACS test will use the AVX-512 and AVX2 extensions if available.
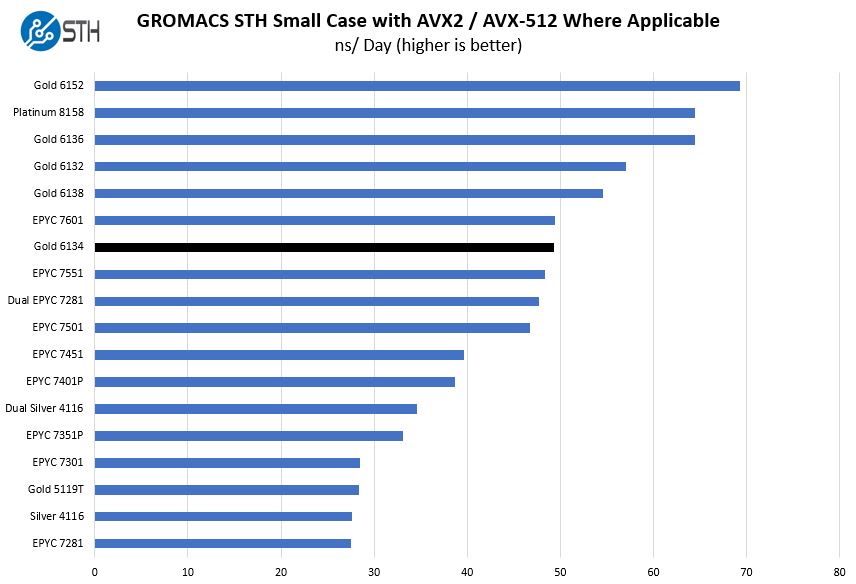
Here is where the Intel Xeon Gold 6134 really shines. With dual port FMA and using AVX-512, and 8-core Intel Xeon Gold 6134 is able to perform about on part with a 32-core AMD EPYC 7601 and well beyond even a dual Intel Xeon Silver 4116 setup with 24 cores. If you have software that takes advantage of AVX-512 and is licensed per core, for example, some ANSYS software, this can be a great option.
Chess Benchmarking
Chess is an interesting use case since it has almost unlimited complexity. Over the years, we have received a number of requests to bring back chess benchmarking. We have been profiling systems and are ready to start sharing results:
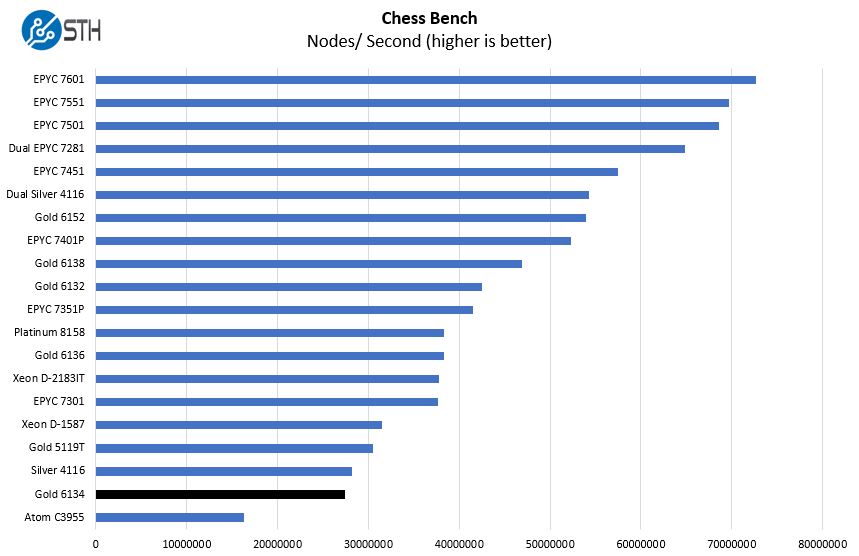
The chess benchmarking does not give us performance over the single 12 core part, but it is very competitive.
Next, we will have power consumption and talk about the market positioning given the benchmarks we see here.


Don’t get it. Seems that even the weakest Epyc cpu beats the 6134 on every single benchmark apart from AVX512. Does that make the 6134 “less competitive apart from a single use case”?
*Doesn’t that make…
Funny how AMD is winning all bench marks hands down…. by a wide margin. AMD is back in the Game…
The author of this article is a clown.
These are specifically designed for running software with per-core licensing. While the benchmarks are mostly being shown on a total sum basis, the metric you would want to look at here is performance per core. In many of the micro benchmarks (e.g. c-ray), EPYC does very well. Larger application benchmarks (Linux Kernel Compile for example) show per-core performance on EPYC is nowhere near Intel’s frequency optimized parts.
For folks used to consumer level or purely open source software, EPYC may seem like a clear winner here. For those who pay software license per-core, EPYC can cost tens of thousands more per socket for the same amount of performance.
Thanks for the reply Patrick.
Which benchmark in this review shows per core perfomance? What is the difference exactly? It is not obvious from the tests in the review.
Take a look at Linux Kernel Compile benchmark (behaves more like an application than the micro benchmarks) and divide the Gold 6134 numbers by 8 and the EPYC 7301/ 7351P numbers and divide by 16 as an example. Intel is 60-70% faster per core on a loaded system.
Thanks Patrick. Which compiler was it used for this?
Also 7301 is about $850, 7351 about $1100 and 6134 $2200. It would be interesting to see a price/single core perf ratio and also energy consumed/single core perf under load for all (I suspect the latter would also favor the xeon).
gcc – but the answer to your question is not the price of the CPU, instead, it is the price of the licenses. Just different tools for different jobs.
Depends on the scale. If initial purchase cost + cost of running allow it, one could licence 2 cores for near the price of 1. Was it gcc8? It would be nice to see LLVM Clang 5 and Open64.
Comments are closed.