
Over the past week, Intel briefed major media outlets, including STH, on their perspective of Intel Xeon Scalable v. AMD EPYC performance. Our conversation with Intel’s performance marketing team was likely a bit different than many of the other conversations as STH has an enormous data set of both Intel Xeon Scalable as well as AMD EPYC benchmarks published with more set to be published publicly. We also only publish under two dozen of almost 2,000 performance data points we generate for each CPU combination on STH so we have a fairly broad base to entertain a discussion. Although we normally do not post third-party benchmarks, we also realized that Intel’s slides will likely be shown elsewhere and we wanted to add our perspective.
Externally Published 2-Socket Server Benchmarks
We are going to follow Intel’s general flow but we are not going to address each slide in turn as you would see elsewhere. The first major performance breakdown compares Intel v. AMD in some published benchmarks. You will notice that AMD does not have numbers (yet) for many of these. Major vendors such as HPE and soon Dell EMC are just coming out with their AMD EPYC offerings. These are the vendors that generally publish numbers such as their SPEC scores. For example, during SC17 we saw HPE publish world record AMD EPYC 7601 numbers for SPECrate2017_fp_base.
These are third-party benchmarks generally peer reviewed that go through a thorough and costly publishing process. These are also the benchmarks where you will see exotic tuning parameters used since vendor teams are trying to get absolute maximum results rather than real-world as-deployed BIOS settings, for example.
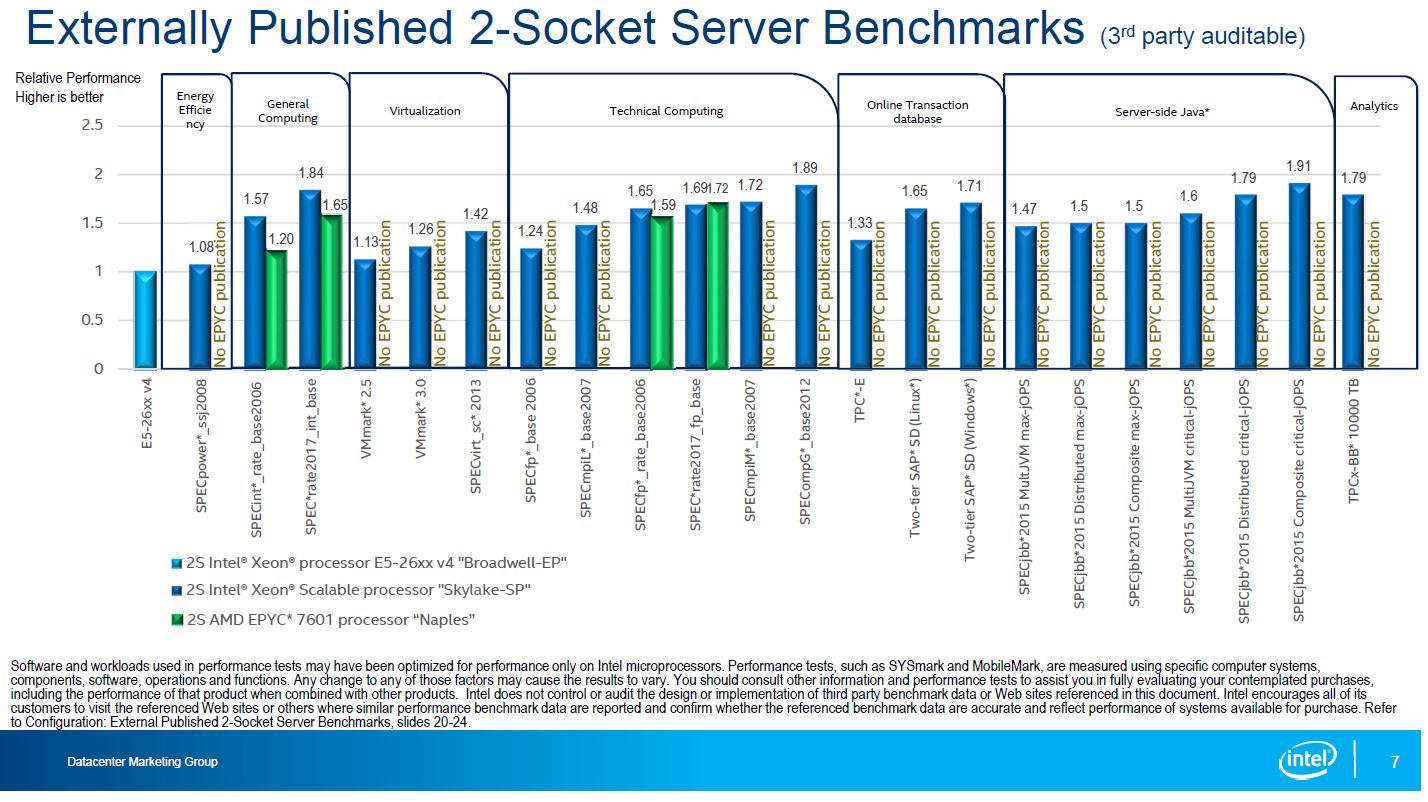
One area that we wanted to focus on was the floating point result. AMD recently highlighted a world record in this area. Here the dual socket AMD EPYC 7601 is slightly faster than dual Intel Xeon Platinum 8180 SKUs. Being clear, the Platinum 8180 is a $10,000 part. You may see the $13,000 figure tossed around and if you do that is incorrect. The Platinum 8180M is around that price.
For anyone that is about to shout, “$9,800 of AMD EPYC beats $20,000 of Intel Xeon in SPECrate2017_fp_base” not so fast. 4x $1,900 Intel Xeon Gold 6130 CPUs are $7,600 and handily beat 2x AMD EPYC 7601’s (see here.)
The bottom line here is that AMD EPYC is competitive where measured. This really just shows Intel has a bigger ecosystem than AMD at present. If you are looking to compare previous generation systems to current generation systems with a specific benchmark, then there is a better chance Intel has it. Our DemoEval service has folks that are running their exact workloads on AMD EPYC and Intel Xeon Scalable every day to generate their own numbers using our data center lab.
Intel Internal Benchmarks
Intel published a number of performance numbers using their own performance testing team. Just as a point of reference, AMD, Cavium, Qualcomm and others all have internal teams doing the same exercises for their CPUs.
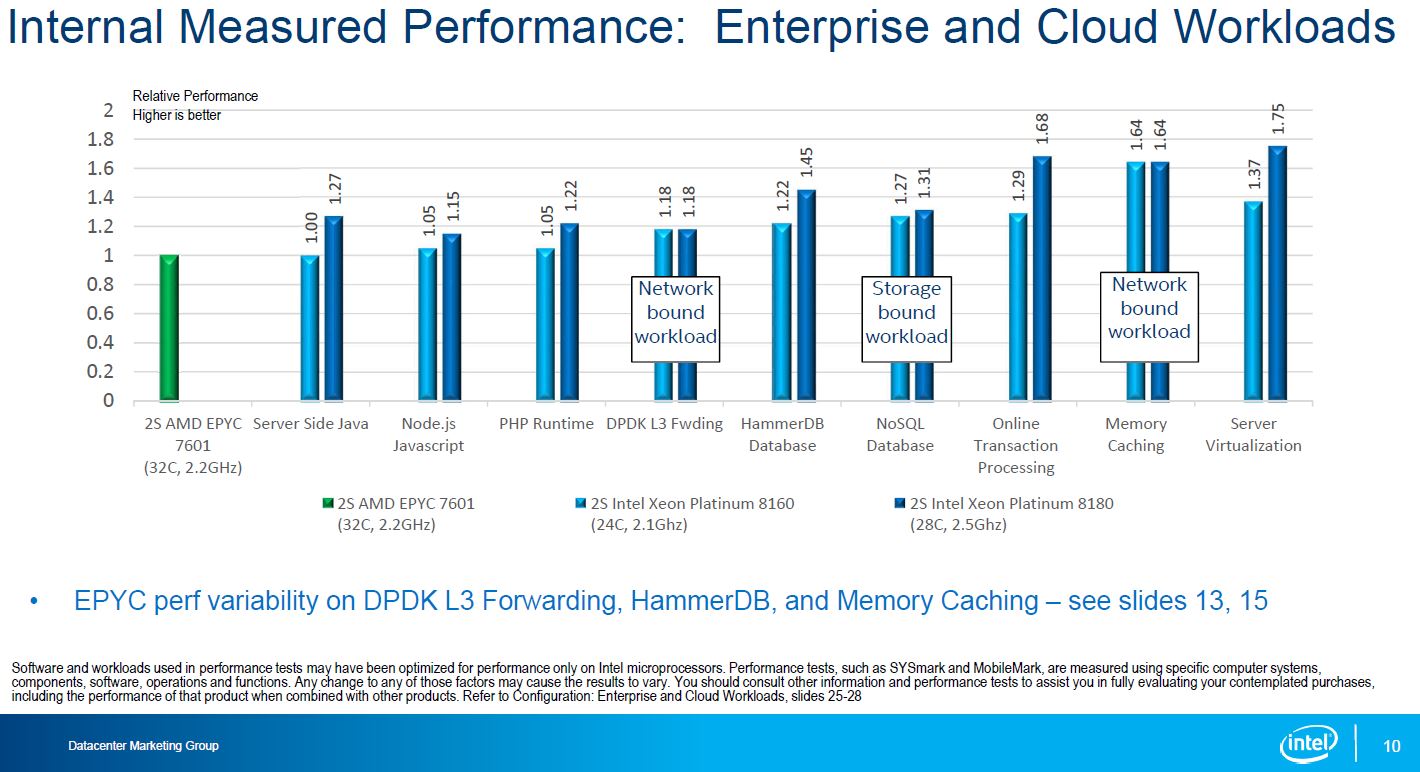
As we would expect from an Intel result, just about every result showed a victory for the similarly priced Intel Xeon Platinum 8160 v. the AMD EPYC 7601.
The HPC workloads were a bit more interesting. Intel actually showed several results where they were slower. When looking at this chart, compared to the previous one, note the dark blue bar is now the Intel Xeon Platinum 8160 (not 8180) and the light blue bar is an Intel Xeon Gold 6148 (not 8160.)
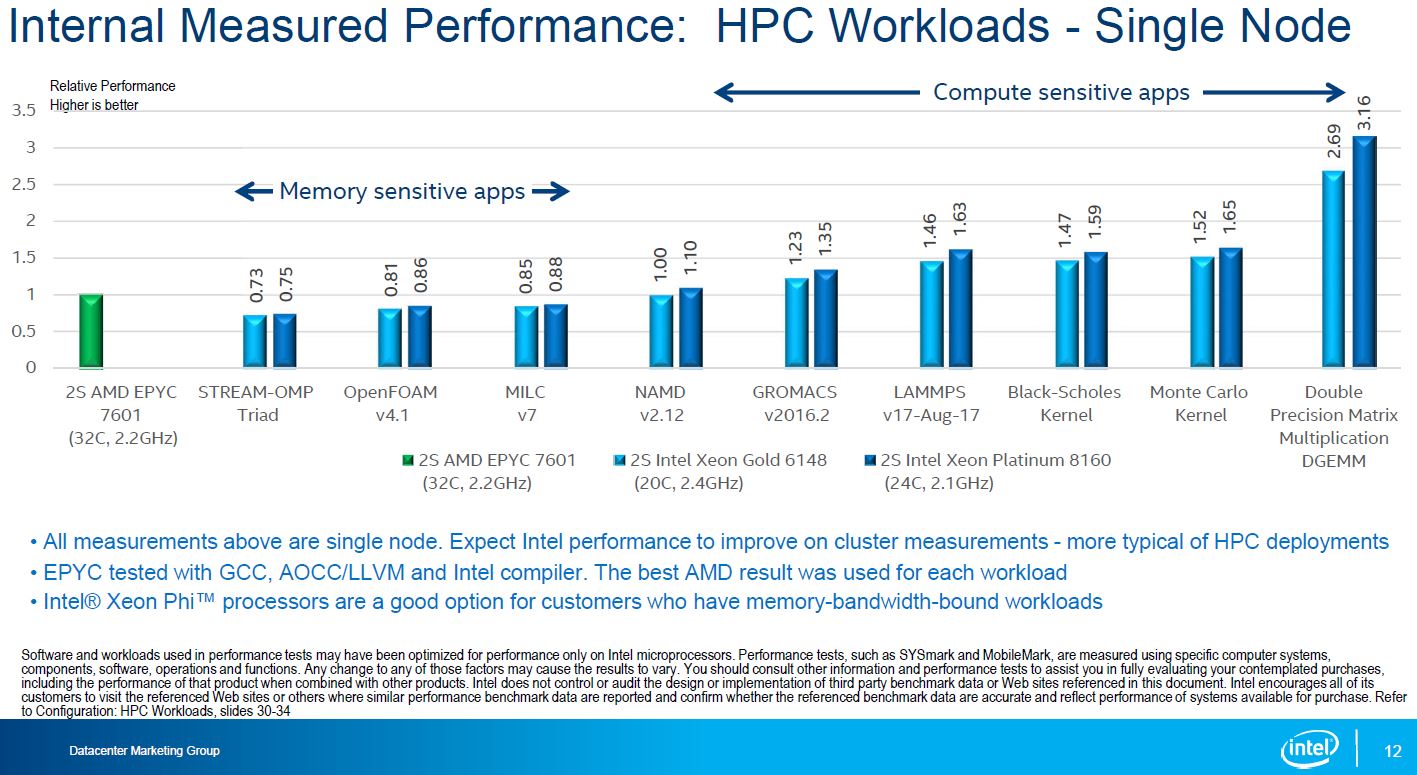
This one is particularly interesting. The GROMACS 2016.2 version Intel is using is both suboptimal for AMD and Intel. There were AVX2 patches for AMD EPYC and Intel Skylake that were released later (e.g. here.) At STH we went through the (painful) exercise of re-running tests using the newer patched code and here is what GROMACS looks like patched for the new architectures using our small case.
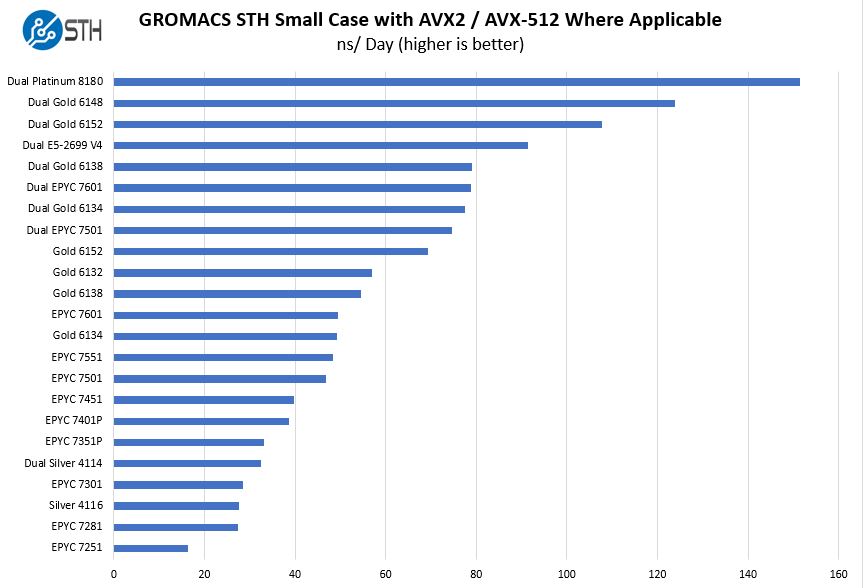
The Intel Xeon Gold 6138 is a $2,600, 125W TDP part and two, with AVX-512, are highly competitive with the AMD EPYC 7601.
GROMACS is interesting because it is both widely used and it is sensitive to downclocking by the Skylake-SP CPUs for AVX2 and AVX-512 workloads. That gives us some results that make you pause, but they are at least consistent. Each iteration also runs for over 30 minutes and we only sample performance from the last 15 minutes. That ensures that we are measuring using heat soaked turbo clocks instead of instantaneous burst performance. We wanted to point out this result as performance is not static over time. As software is optimized, these numbers change.
Another key takeaway is at the other end of the chart. The Intel Xeon Silver (and Bronze / Gold 5100 if we had them on here) get absolutely obliterated by AMD. The de-featuring of the lower-end parts means they have a neutered single port FMA AVX-512 rather than the higher dual port we see in the Gold 6100 and Platinum 8100 series CPUs. What probably seemed like a good idea to the Intel product team at the time also is a huge performance liability since Intel cannot claim across the board performance per core dominance with AVX-512.
Performance Per Core
On the subject of performance per core Intel furnished this comparison:
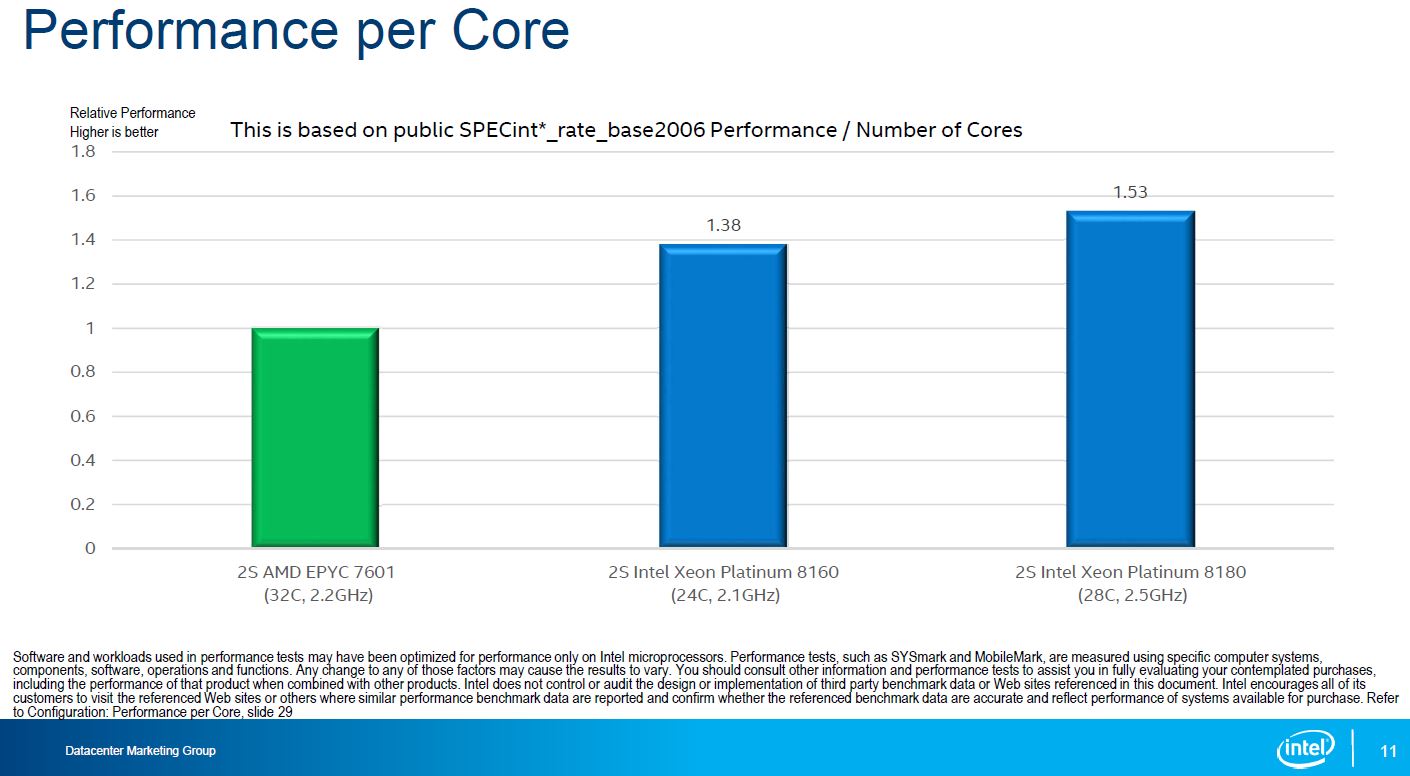
Although we generally like this methodology, it is masking one key component. This is not maximum single thread performance for AMD nor Intel. What Intel is doing here is taking the total run score and dividing by the number of cores. Conceptually, this is comparing per-core performance when they are all loaded. This is not comparing maximum single threaded performance.
Single core Platinum 8180 frequency is 3.8GHz while maximum all core turbo boost is 3.2GHz. If you were purely interested in single core performance, Intel can get about 18.75% more performance than they are showing here. Max all core boost for the AMD EPYC 7601 is 2.7GHz while the maximum single-threaded speed is 3.2GHz. That means AMD could be 18.5% higher, albeit on a smaller performance per core number.
Performance per core is a huge number in the enterprise space. Many software applications ranging from Microsoft Windows Server 2016 to ANSYS simulation software to Oracle databases are licensed on a per-core basis. When you can spend $1000 per core in licensing and annual support, saving $4000 per CPU is not wise when it means you spend 2x-3x that in extra per-core software licensing costs. On the other hand, if you are using open source software, or products like VMware where you have per-socket licensing, the more cores the merrier.
Another aspect of single threaded performance is that it can have a demonstrable impact on latency.
Die-to-Die Latency and Bandwidth
Intel produced results for memory latencies for dual socket Intel and dual socket AMD EPYC servers.

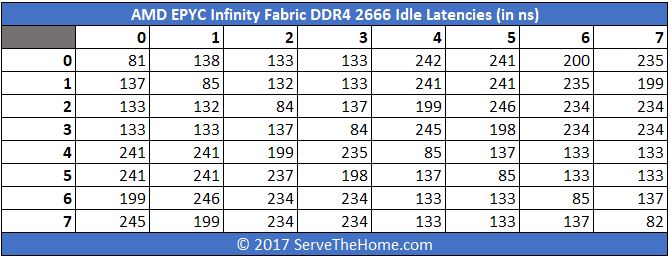
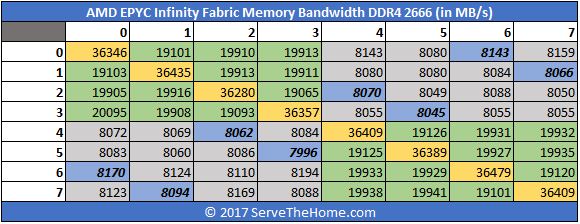
STH did AMD EPYC Infinity Fabric latency analysis earlier this year. There we specifically focused on why you always want to use DDR4-2666 over DDR4-2400 with EPYC systems. One of the key charts we made was comparing a four-way (4-die / socket) Intel Xeon Platinum 8180 system to a single socket, 4-die AMD EPYC 7601 system.
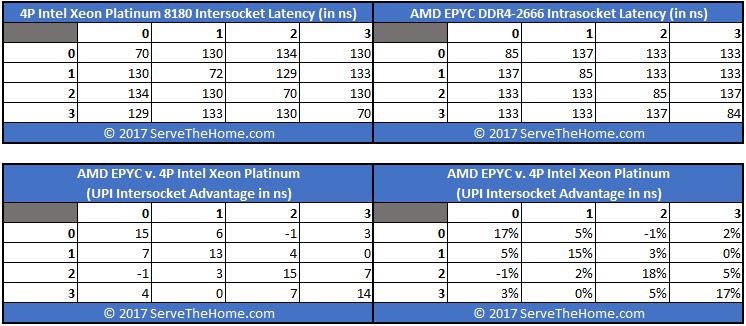
We saw similar numbers to what Intel measured, albeit slightly better for the AMD EPYC. Above, we were running AMD EPYC in single socket versus dual socket configurations but we have the numbers to confirm the general direction that Intel is using with their numbers. Here are our measured the AMD EPYC DDR4-2666 latencies on a dual socket AMD EPYC 7601 system:
We asked AMD about this back at Hot Chips 29 a few months ago. AMD knows that they have higher socket-to-socket latency than Intel and hinted at a next-generation product that could address this.
Intel is pushing into the telecom space heavily and DPDK is a hot technology that Intel and even ARM vendors are touting now. DPDK has become the open source, cross architecture solution that we are seeing everywhere these days. Here is what Intel measured on the Intel v. EPYC systems.
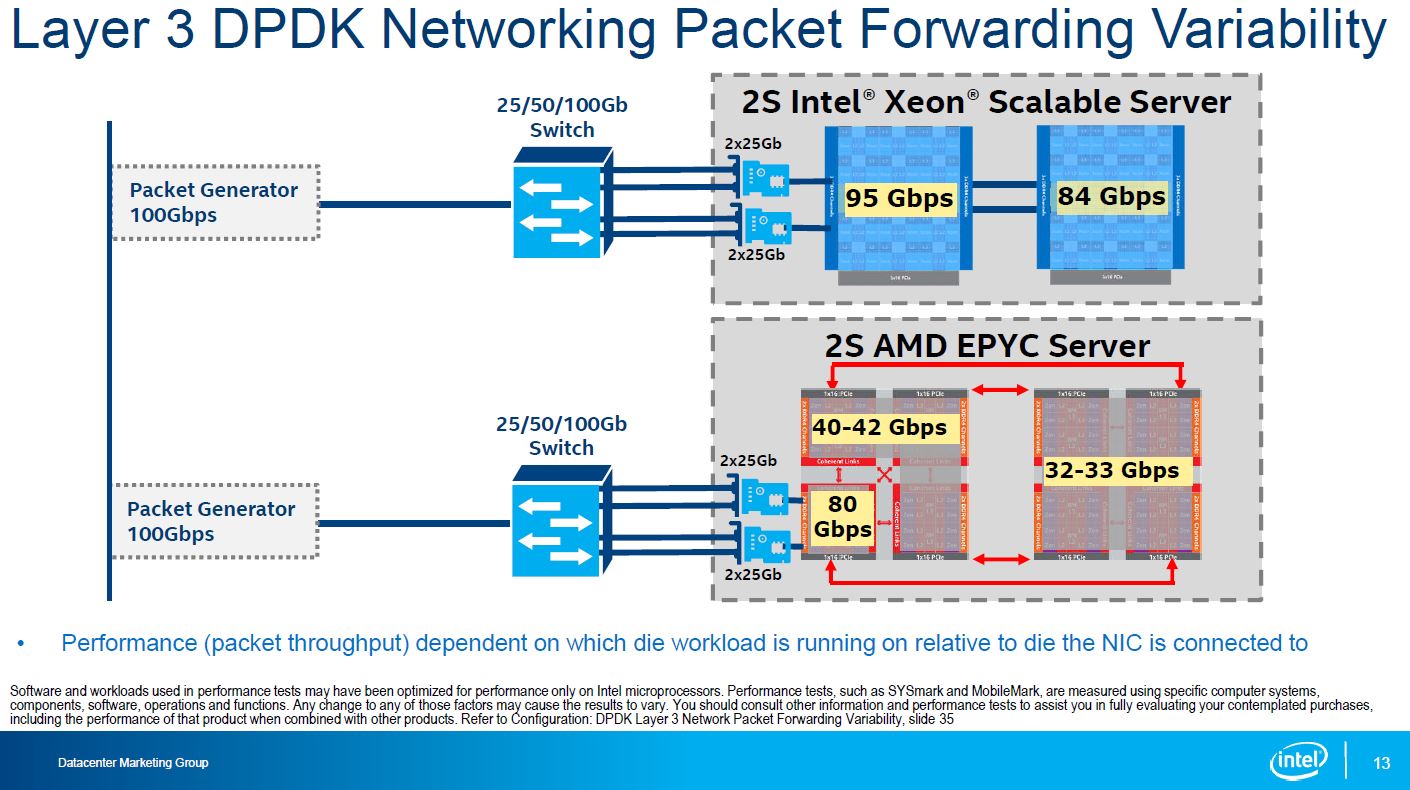
What Intel is essentially showing is that every time you have to do an Infinity Fabric hop, that impacts bandwidth and performance. They are also showing why they believe a fat UPI link is better than a mesh of smaller Infinity Fabric links.
Indeed, if Intel tested speeds over 100Gbps (in 4x 25GbE) and went to 200Gbps one would have seen significantly different results. Likewise, if you were building a similar configuration on a production server, you would certainly want the two 25GbE adapters placed on the PCIe roots of the different die or different sockets instead of simply on one die. 100Gbps is not that far off from what a socket-to-socket Infinity Fabric link can handle so it is little wonder why figures are constrained here. Although this is not an advisable PCIe card configuration for a server, it is a valid configuration option so the measurement is not without merit. It likely exaserbates the bandwidth limitations.
This follows the general pattern we have seen. From that same Infinity Fabric piece, we looked at bandwidth and saw a similar pattern.
The bottom line here is that socket-to-socket bandwidth is limited and more limited than die to die intrasocket bandwidth. If you are doing big NVIDIA CUDA AI/ deep learning training you will first run into the roadblock of P2P not working on AMD EPYC, you will then see the impacts of this. One of the best known autonomous automobile/ fleet companies and another major hyper-scaler told us this is why they are not using EPYC with NVIDIA GPUs for deep learning at present.
Performance Variation
Intel double-clicked on performance variations it saw running two benchmarks, Memory Caching and its HammerDB database.
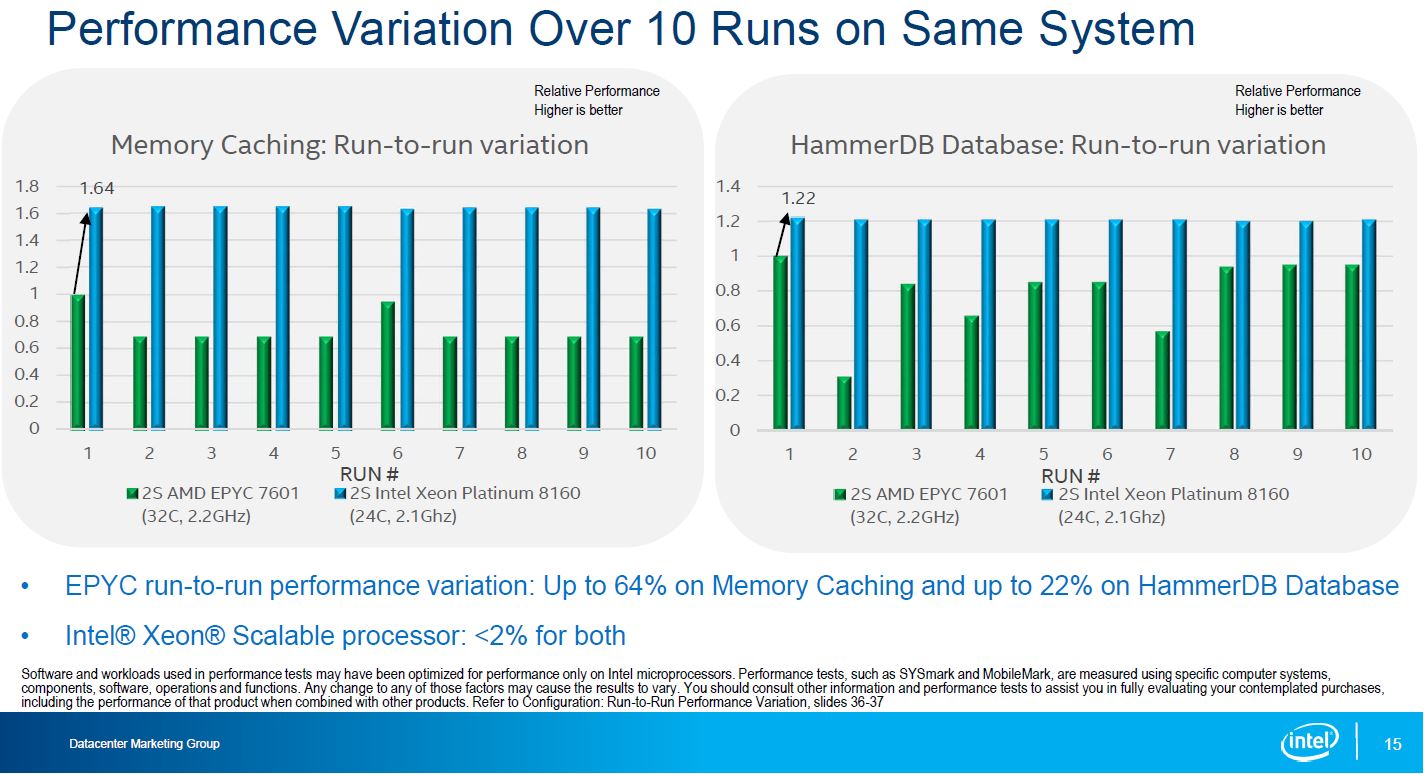
Based on what we have seen, this seems to be on the high-side. When we do multi-hour benchmarks (e.g. Elastisearch benchmarks over hundreds of thousands of full-text medical journal records) there is more of a variance between EPYC runs than Xeon. We typically see more of a 10% variance in benchmarks where data is hopping die-to-die.
What Intel is really highlighting here, is a part of the latency and bandwidth story in another view. When we see heavy use of Infinity Fabric, especially in workloads where you have high-speed networking (40/ 50GbE), the two socket EPYC configuration can saturate Infinity Fabric links. If you read our AMD EPYC 7000 Series Architecture Overview for Non-CE or EE Majors piece, it is readily apparent what is going on in the architecture. We also have a video for those that want an easier-to-digest format:
Final Words
After everything is said and done, if you see the performance data and think “Intel always wins” that is the wrong conclusion. Likewise, if you see AMD data and think “AMD is always better” that is also the wrong conclusion. The real answer is “it depends” which is pretty cool from an industry perspective as we now have competition.
Then again, there is a dirty realization nobody is talking about, there are a lot of servers that simply do not use that much CPU power:
If you look at virtualization servers, those that have a usage pattern like the one above are not uncommon, even with technologies like ballooning memory. Here pure memory capacity matters. For 1TB/ socket, Intel Xeon Scalable requires M series parts at a $3,000 premium that AMD does not have.
For those living in a per-core, or per server licensing model with expensive software, Intel Xeon Scalable has a great platform. If you want four sockets, Intel is currently the way to go. If you need the highest clock speeds or the highest per-core performance, Intel is the way to go. If you live in a per-socket licensing model or use mostly open source software, AMD has a compelling platform. AMD EPYC performance is very good. Getting maximum performance from AMD EPYC does require managing NUMA nodes. If you do not, there can be a performance penalty to pay. Dual port FMA AVX-512 is a killer for some applications on the Intel side.
We maintain that Intel does not have a huge performance problem as some commentators would lead you to believe. What Intel does need is to re-align its artificial limitations and pricing it has put in its product portfolio. Generally, Intel’s numbers align with what we have been seeing on equivalent workloads. AMD will show workloads that they are better in. Overall, this is an exciting time in the industry.


Very nice writeup.
Is there an Intel slide explaining which kernel, glibc and compiler versions they used for their testing? Because, as you stated in the conclusion, managing NUMA nodes is critical not only for performance, but for consistency of results as well. AMD being a more complex numa topology shows any inefficiencies in numa management much faster, which Intel is more than happy to point out with their “performance variations” slide.
Once kernels and compilers adopt all the necessary tweaks, this picture will change slightly. I wonder how these numbers will look one, two and three years from now.
Since I’m living in a a memory bound world of engineering HPC codes, at least the answer to “which is better for me” is clear :)
It’s a good think that most who need GROMACS don’t use these benchmarks for buying hardware, they buy NVidia.
Hi Jure, they have many slides on this. In fact, more slides on configuration details than slides in the main presentation. The 3rd party / SPEC numbers all have the details down to BIOS tweaks published.
Most were using Linux Kernel 4.10 and you are right that the picture changes a bit for both platforms using a newer Kernel. At the same time, generating this much data takes so long that you do have to put a stake in the ground. If folks are interested, happy to do a follow-up post with those slides or put them in the forums.
Thank you for your critical, performance analysis of the Gold 6148 and Gold 6138 for dual and single configurations relative to various EPYC versions for dual and single configurations, since there is so little that is published, out in the open, which can be interpreted as being close face value.
“first run into the roadblock of P2P not working on AMD EPYC”: Is this to be interpreted as ‘not working now but can be fixed in firmware’ or broken period? IIRC, AMD had demo’d their own GPUs in P2P and had claimed some P2P bandwidth numbers in their Hotchips talk, hence the question.
If you plug NVIDIA GPUs (e.g. the ones the vast majority of deep learning / AI folks use) into two PCIe slots of AMD EPYC systems you have different PCIe roots. As a result, P2P does not work. Vendors could get around this by using a PCIe switch, negating the advantage of having more PCIe lanes with EPYC.
Comments are closed.