
Today we are looking at the Predator GM7000 4TB SSD. The Predator line of SSDs is manufactured by Biwin, and some of our readers might know that Biwin is the OEM behind the HP-branded SSDs like the HP FX900 Pro that we previously reviewed. Acer manufactures computer equipment under the Predator branding as well, but for the SSDs under the Predator name there is no involvement from Acer and the drives are entirely Biwin’s creation. Despite this, the Amazon listing (Affiliate link) for this drive currently shows the Acer name. The GM7000 4TB model is new, and reviewing 4TB SSDs is not something I do very often so I am looking forward to it. In addition, this is the first review done using my new Ryzen 7900X test bench, which is at least exciting for me.
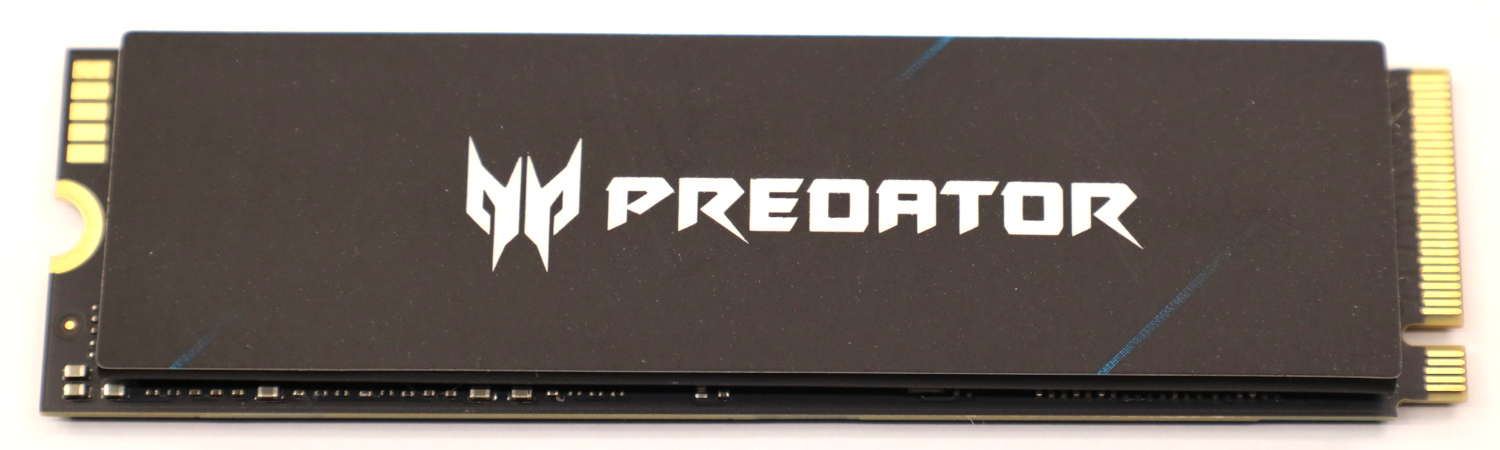
Predator GM7000 4TB NVMe SSD
The Predator GM7000 4TB comes in a double-sided M.2 2280 (80mm) form factor.
The Predator GM7000 is a very similar drive to the HP FX900 Pro; the two drives share a controller in the InnoGrit IG5236, and they both use 176-layer TLC NAND with a DDR4 DRAM cache.
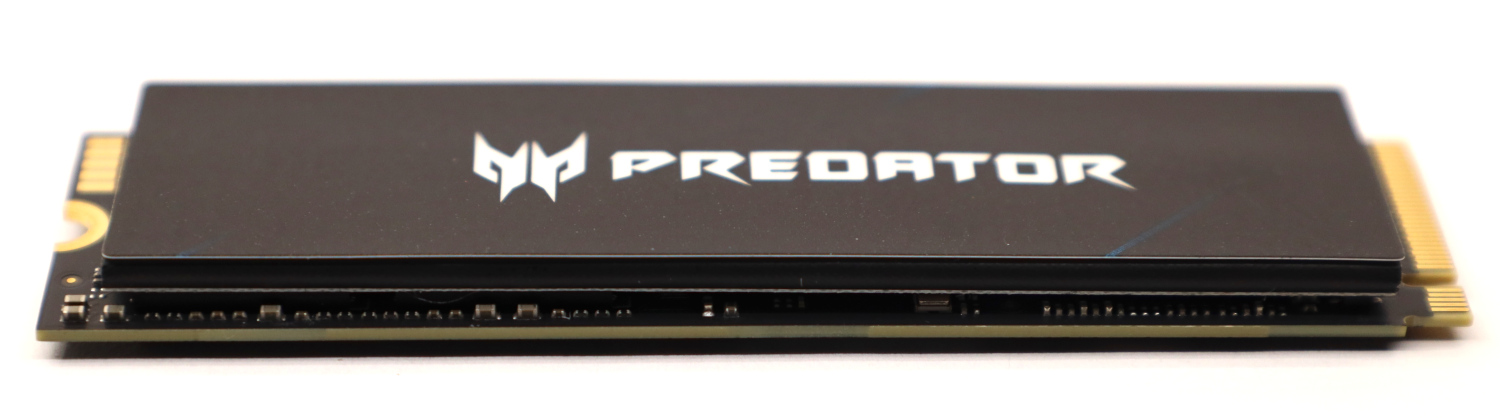
Readers that saw my FX900 Pro review will also recognize the “graphene thermal pad” that is also included on this drive or at least one that is very similar.
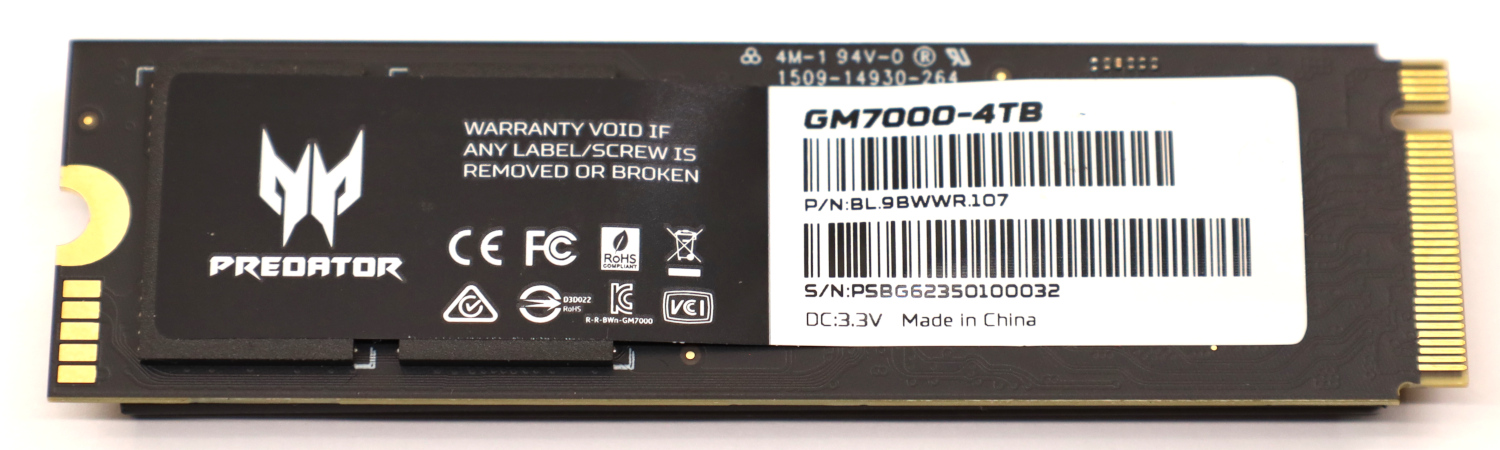
The back of the GM7000 is home to half the NAND and DRAM, plus a product label. The reason this double-sided SSD is so important is because some systems do not have sufficient space or cooling for double-sided drives. Most systems and motherboards do, but we have seen a few over the years only targeting lower-end SSDs.
Predator GM7000 SSD Specs
The GM7000 line of SSDs is available in sizes between 512 GB and 4 TB.
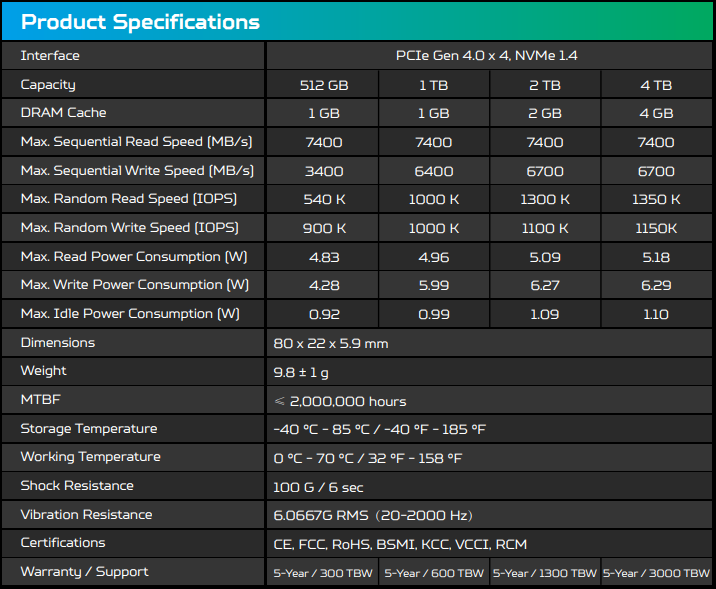
The Predator GM7000 we have today is the 4TB model, which sits at the top of the GM7000 product lineup. Sequential read speed is quoted at 7400 MB/s, with write speed at 6700 MB/s; these speed ratings are top-notch for a PCIe Gen4 drive.
Endurance is rated at 3000 TBW. I do not get a lot of 4TB SSDs to review, but that works out to 750 TBW per terabyte of capacity, which is very healthy. In addition to the good endurance rating, the GM7000 lineup carries a 5-year warranty which is the gold standard for premium SSDs.
One additional note about this drive; generally speaking larger capacity drives have a performance advantage over lower capacity drives. As mentioned, I do not have a large stable of 4TB SSDs in my benchmark database, so most of the other drives on the performance graphs will be 2TB models. For the most part, 2TB and 4TB drives will perform similarly but it is possible that 4TB drives will have an advantage, so that is something to keep in mind when reviewing the performance results. We are generally transitioning to 2TB NVMe SSD reviews from a 1TB standard, but this is the drive we have.
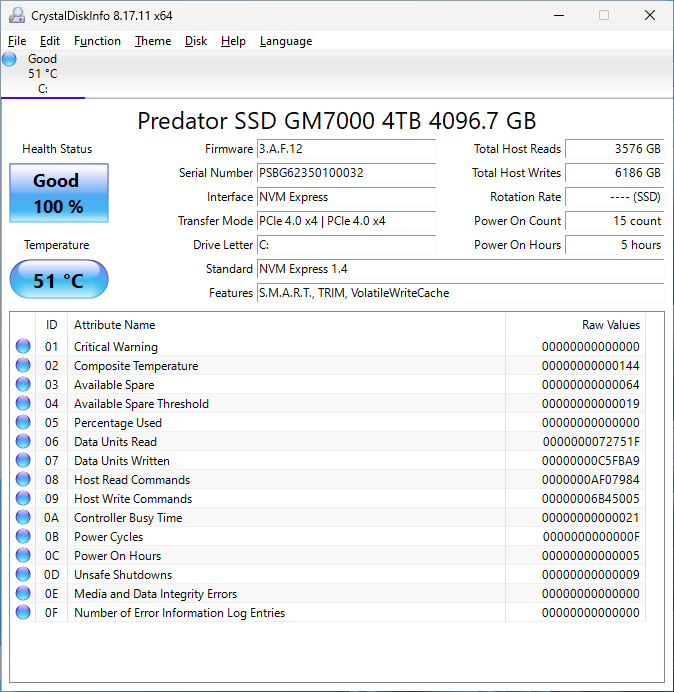
CrystalDiskInfo can give us some basic information about the SSD and confirms we are operating at PCIe 4.0 x4 speeds using NVMe 1.4. Additionally, this is a 4096 GB drive and not a 4000 GB unit, which represents a bit of extra capacity for the user.
Test System Configuration
We are using the following configuration for this test:
- Motherboard: ASRock X670E Steel Legend
- CPU: AMD Ryzen 9 7900X (12C/24T)
- RAM: 2x 16GB DDR5-6000 UDIMMs
Our testing uses the Predator GM7000 4TB as the boot drive for the system, installed in the M.2_1 slot on the motherboard. This slot supports up to PCIe Gen 5 x4. The drive is filled to 85% capacity with data, and then some is deleted, leaving around 60% used space on the volume.
Next, we are going to get into our performance testing.


re: post cache write speeds.
what is the write pattern?
is it random 4K, Q=1.
Without any cache in the middle, I don’t understand post cache write speeds of 1.3TB/sec, and faster?
Doesn’t the time to write natively, too large to support that kind of speed, unless the writes are to one raw, previously erased, erase block?
Also, if the NVME was full, raw hardware erase cycles, would be needed to allow for creating the needed raw space.
iq100,
The post-cache write speed is caught during the initial drive fill. Each drive starts with about 50GB of data on it (Windows and my benchmark utilities). I have a utility that I run ten separate instances of, and that utility generates random data and writes it to disk. Each instance of the utility writes a bunch of 10GB files until the volume is around 85% full. With ten separate utilities writing concurrently, the random data also ends up randomly interwoven; if the disks I was testing were mechanical they would be horribly fragmented by this process, which is on purpose.
This is done when the drives are essentially brand new; the blocks being written to are blank and not in a ‘dirty’ state. I do not claim this is the worst performance that you can generate on a given SSD, since it is possible to torture a drive and achieve even worse performance. I could cyclically run this test, filling up a drive and then deleting data while I do it without ever allowing time for garbage collection or TRIM, but most folks do not set out to torture their SSDs. What folks *do* occasionally do is large one-time data dumps, so knowing how fast a drive will write when you run out of cache is useful information to me.
And it’s 1.3 GB/s, not 1.3 TB/s. Just assuming that was a typo!
yes .. a typo
Will Taillac wrote “… I do not claim this is the worst performance that you can generate on a given SSD …”.
I would find it useful to know the actual hardware raw worst case timings. Specifically erase page size, and time to erase. My understanding is the raw erase times are large. That is why software/firmware/driver layers exist to hide the worst case physics of erasure (return to zero state). Would like to know when underlying NAND flash-like technology has physically changed. Has it?
Physically the NAND cells are smaller, and are now stacked. Changes. But you may want to create your own benchmark, or torture test. Not sure i see the value in that. But i’m the guy who also sees no value in posting hexadecimal numbers in a CDM screenshot. (Advanced, raw values, 10 dec)
Comments are closed.