SPECworkstation 3.0.2 Storage Benchmark
SPECworkstation benchmark is an excellent benchmark to test systems using workstation-type workloads. In this test, we only ran the Storage component, which is fifteen separate tests.
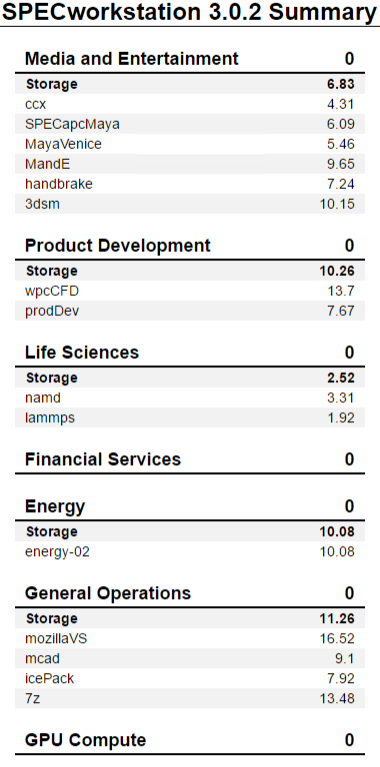
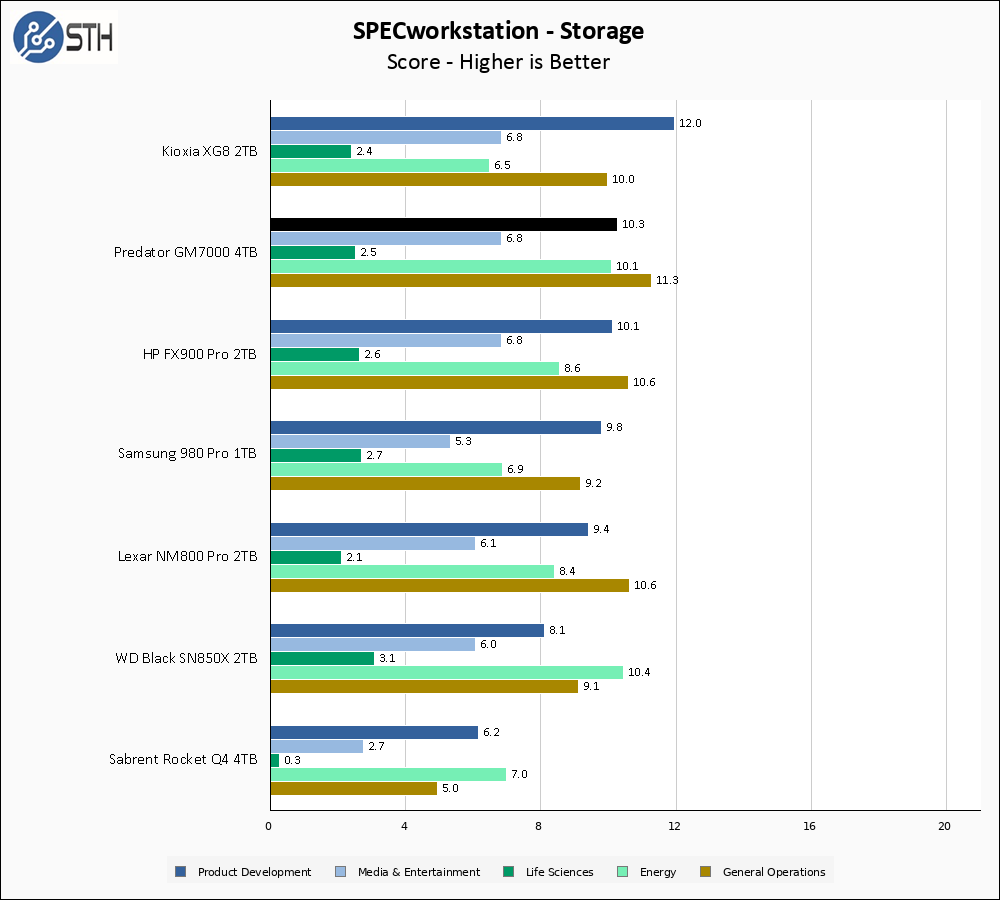
The Predator GM7000 4TB turns in great results in SPECworkstation. Several of the results are at or near the top for the individual sub-tests, with General Operations leading the pack by a small margin.
Sustained Write Performance
This is not necessarily a benchmark so much as trying to catch the post-cache write speed of the drive. While I am filling the drive with data to the 85% mark with ten simultaneous write threads, I monitor the drive for the write performance to dip to the lowest steady point and grab a screenshot.
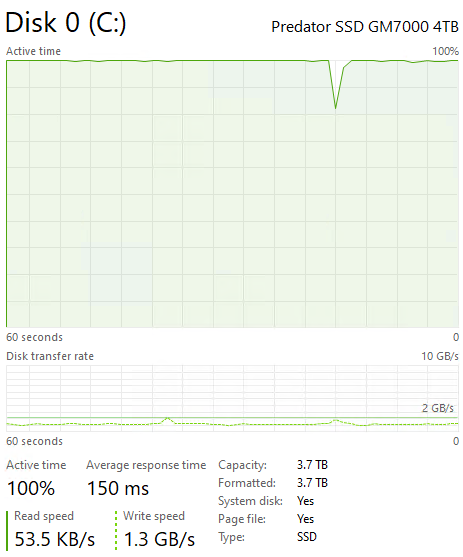
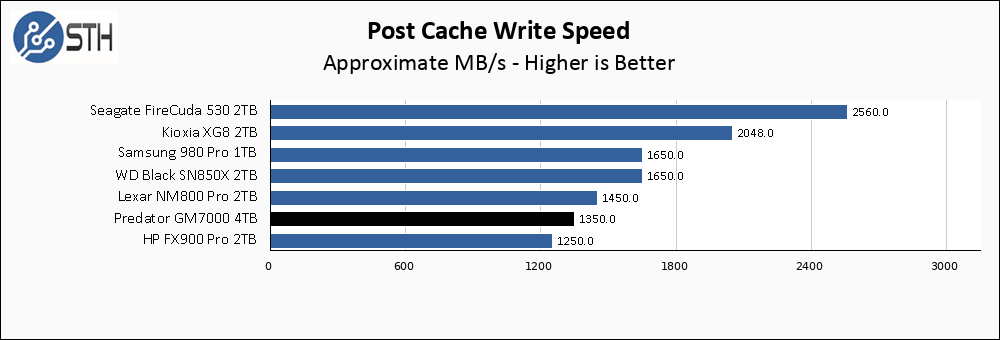
Sustained write speed, after the cache is exhausted, has not been class-leading on any of the InnoGrit drives I have tested. 1350 MB/s is still a great result, but when put on a chart with the FireCuda 530 it can look underwhelming.
Temperatures
We monitored the idle and maximum temperature during testing with HWMonitor to get some idea of the thermal performance and requirements of the drive.
A note on testing with the new Ryzen 7900X test platform. Due to the physical proximity of the M2_1 slot, when the CPU fan kicks up there is now some incidental airflow over SSDs installed into the M2_1 slot.
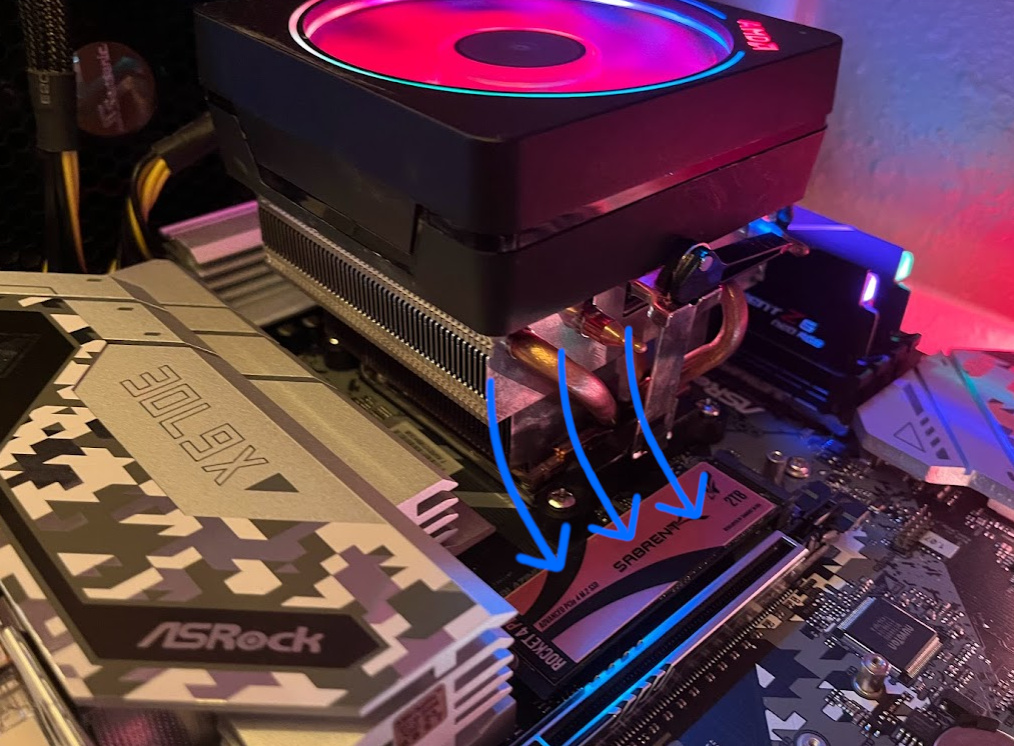
As a result, temperature testing is not necessarily comparable with testing done on the previous-generation test platform.
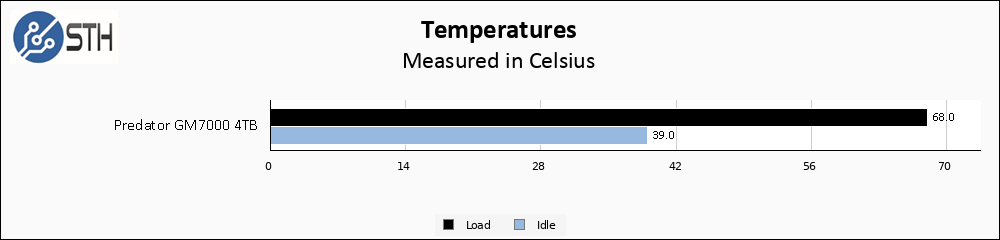
Between the cooling pad providing whatever benefit it confers and the indirect airflow coming from the CPU cooler, the Predator GM7000 stays downright cool.
Final Words
The Predator GM7000 4TB drive is currently $450 on Amazon. There are not a lot of high-performance Gen4 4TB SSDs on the market, but $450 is a similar price to the WD Black SN850X 4TB, and is a lower price than the Seagate FireCuda 530 or Sabrent’s Rocket 4 Plus at the same capacity point.
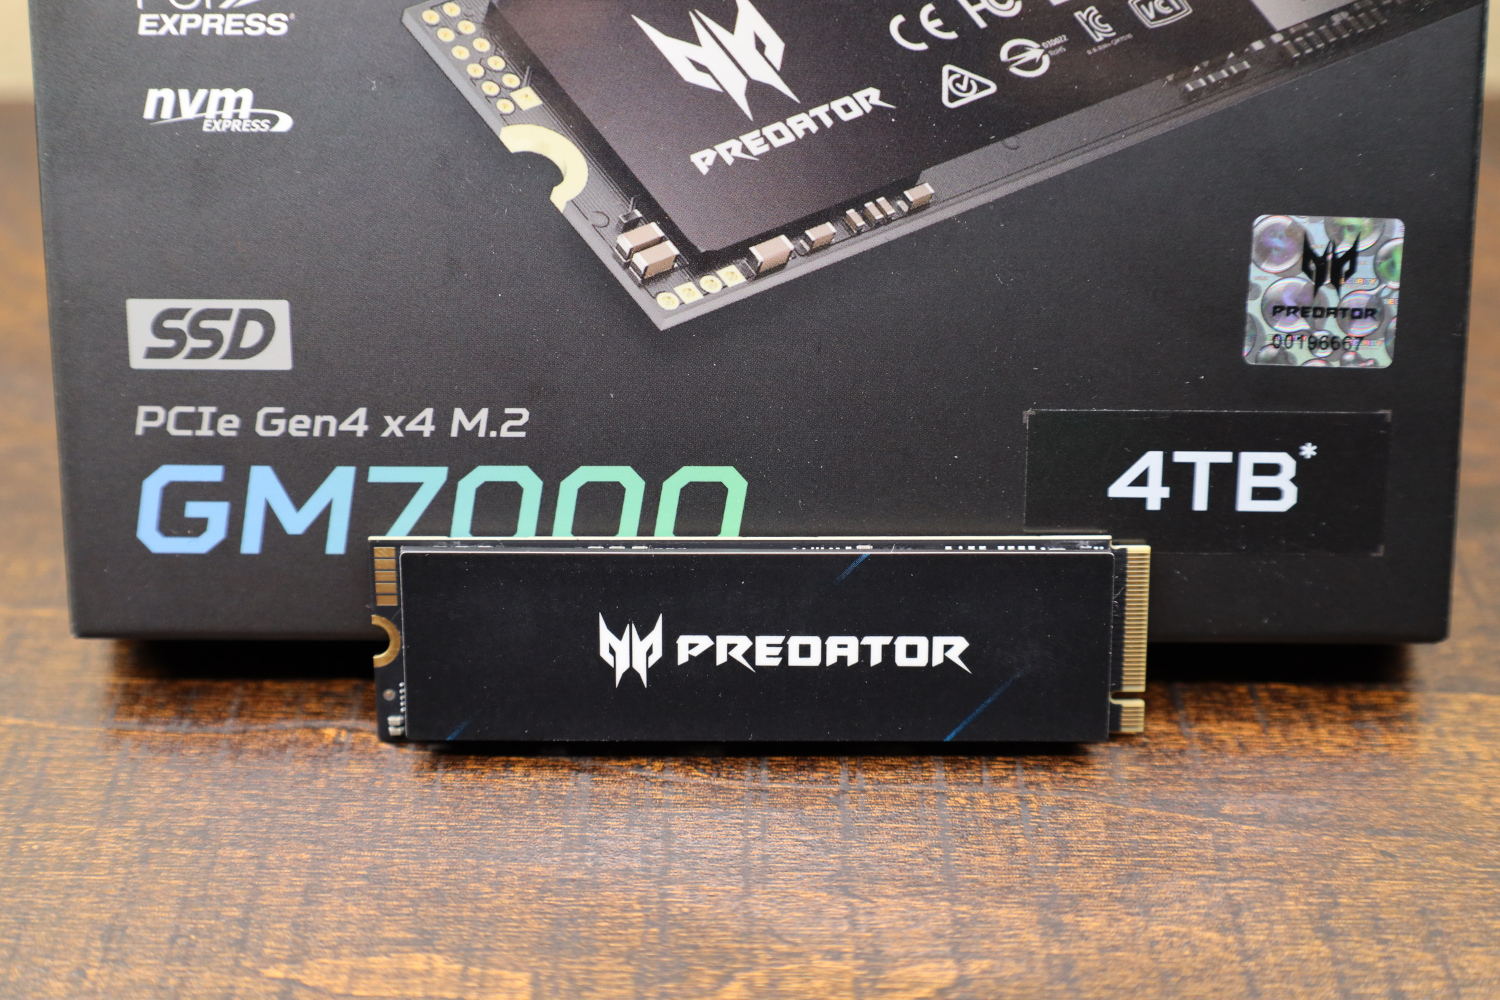
At $450, the Predator GM7000 4TB is not only performant but it is a relatively inexpensive drive for the capacity. I have been a fan of InnoGrit-based drives since the first one that I reviewed, and the GM7000 continues in that tradition. If you are in the market for a large-capacity PCIe Gen4 NVMe SSD, the Predator GM7000 should be on your shortlist.


re: post cache write speeds.
what is the write pattern?
is it random 4K, Q=1.
Without any cache in the middle, I don’t understand post cache write speeds of 1.3TB/sec, and faster?
Doesn’t the time to write natively, too large to support that kind of speed, unless the writes are to one raw, previously erased, erase block?
Also, if the NVME was full, raw hardware erase cycles, would be needed to allow for creating the needed raw space.
iq100,
The post-cache write speed is caught during the initial drive fill. Each drive starts with about 50GB of data on it (Windows and my benchmark utilities). I have a utility that I run ten separate instances of, and that utility generates random data and writes it to disk. Each instance of the utility writes a bunch of 10GB files until the volume is around 85% full. With ten separate utilities writing concurrently, the random data also ends up randomly interwoven; if the disks I was testing were mechanical they would be horribly fragmented by this process, which is on purpose.
This is done when the drives are essentially brand new; the blocks being written to are blank and not in a ‘dirty’ state. I do not claim this is the worst performance that you can generate on a given SSD, since it is possible to torture a drive and achieve even worse performance. I could cyclically run this test, filling up a drive and then deleting data while I do it without ever allowing time for garbage collection or TRIM, but most folks do not set out to torture their SSDs. What folks *do* occasionally do is large one-time data dumps, so knowing how fast a drive will write when you run out of cache is useful information to me.
And it’s 1.3 GB/s, not 1.3 TB/s. Just assuming that was a typo!
yes .. a typo
Will Taillac wrote “… I do not claim this is the worst performance that you can generate on a given SSD …”.
I would find it useful to know the actual hardware raw worst case timings. Specifically erase page size, and time to erase. My understanding is the raw erase times are large. That is why software/firmware/driver layers exist to hide the worst case physics of erasure (return to zero state). Would like to know when underlying NAND flash-like technology has physically changed. Has it?
Physically the NAND cells are smaller, and are now stacked. Changes. But you may want to create your own benchmark, or torture test. Not sure i see the value in that. But i’m the guy who also sees no value in posting hexadecimal numbers in a CDM screenshot. (Advanced, raw values, 10 dec)
Comments are closed.