Predator GM7000 4TB Performance Testing
We test using both the default smaller test size as well as larger test sets on our benchmarks. This allows us to see the difference between lighter and heavier workloads.
CrystalDiskMark x64
CrystalDiskMark is used as a basic starting point for benchmarks as it is something commonly run by end-users as a sanity check.
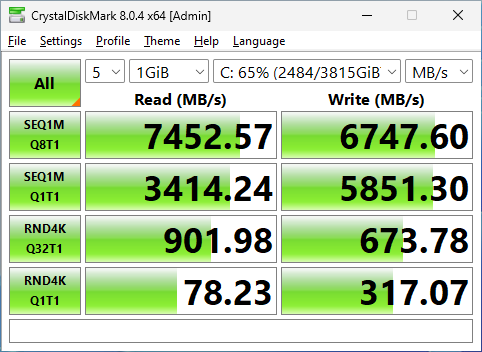
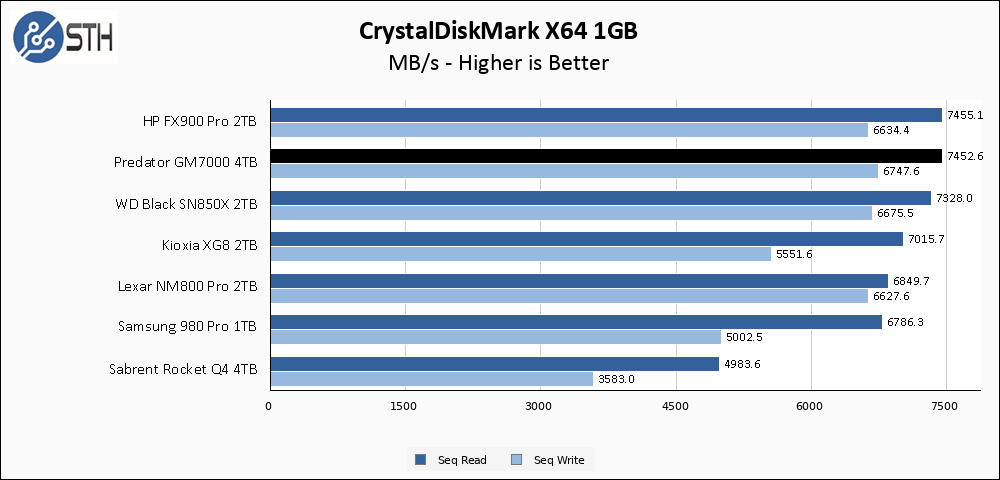
The Predator GM7000 4TB does well in CrystalDiskMark. The rated specs are 7400 MB/s read and 6700 MB/s write, and the GM7000 exceeds both of those specifications. In relative terms to the other drives on my chart, the GM7000 does very well and is essentially tied for the top spot on the chart.
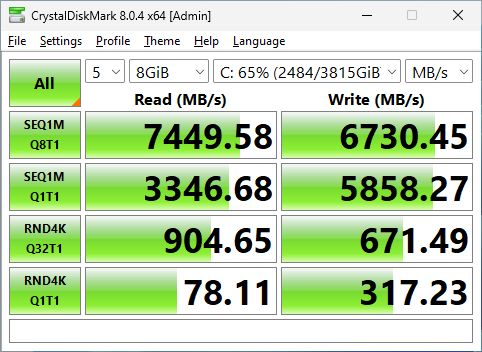
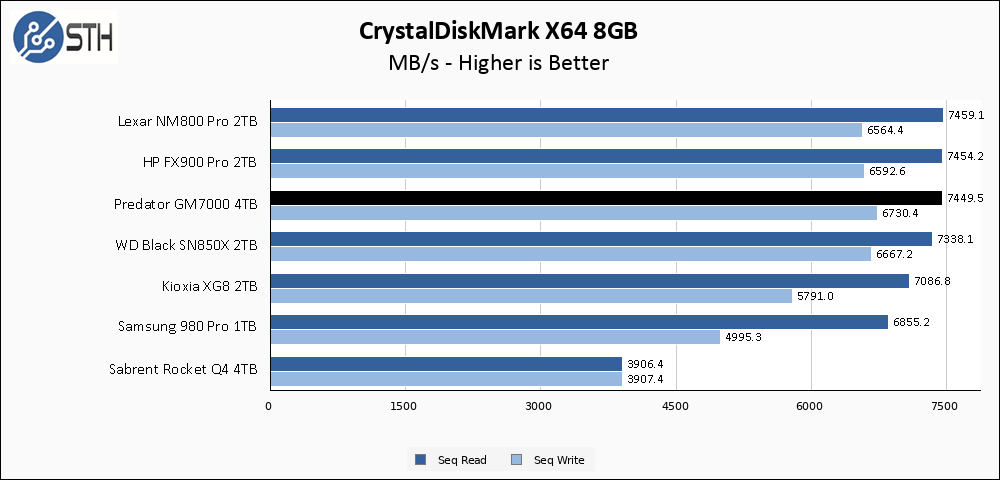
The larger CrystalDiskMark test has no negative effect on the GM7000. Once again performance is essentially top of the chart, with write results that slightly edge out the Lexar and HP drives.
ATTO Disk Benchmark
The ATTO Disk Benchmark has been a staple of drive sequential performance testing for years. ATTO was tested at both 256MB and 8GB file sizes.
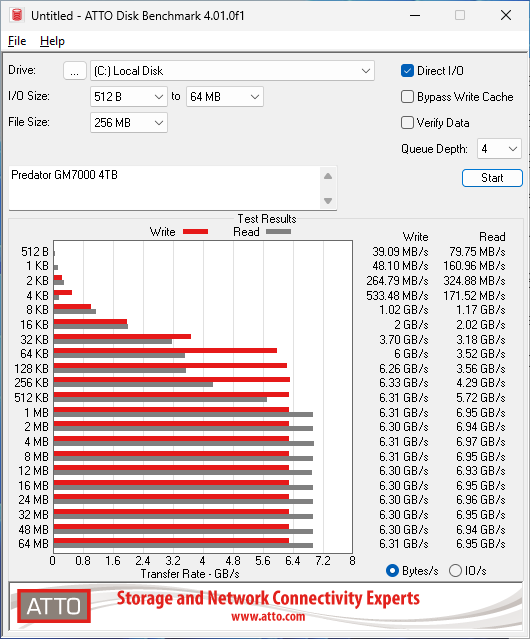
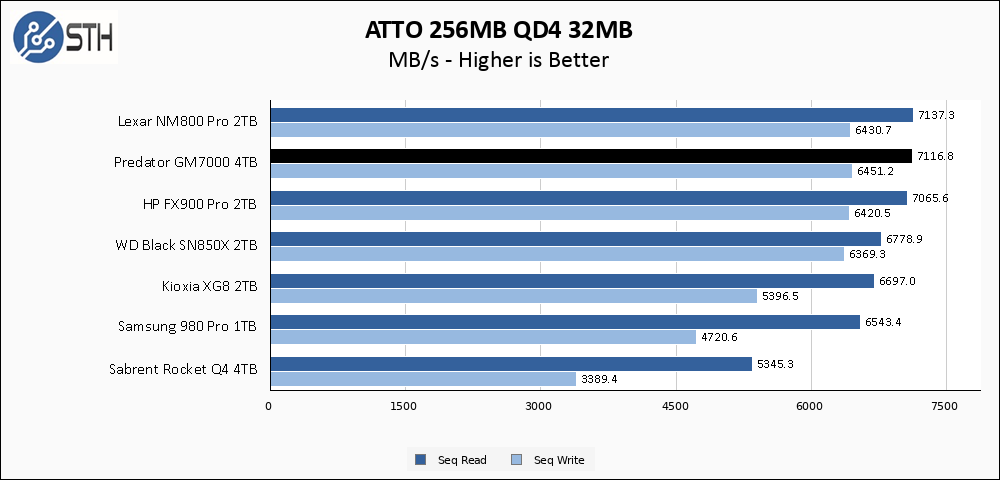
The GM7000 continues its strong sequential performance results in ATTO, where it is again tied for the top spot. The Lexar, HP, and Predator drives all share a lot of common components, so it is not surprising to see them clustered together.
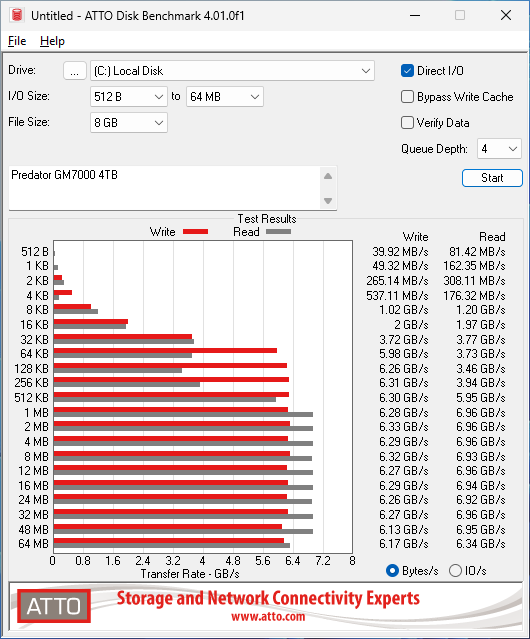
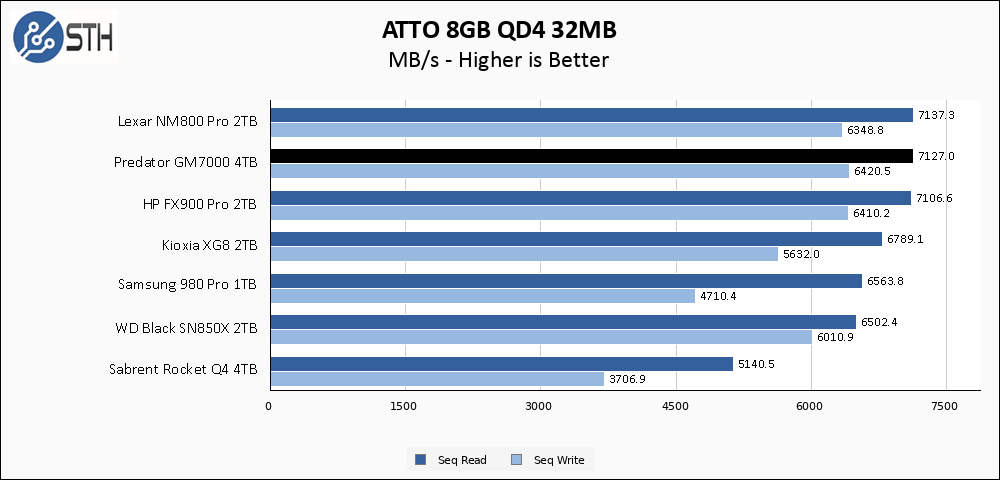
The larger ATTO test has the GM7000 turning in nearly identical results to the smaller test, which is good.
Anvil’s Storage Utilities
Anvil’s Storage Utilities is a comprehensive benchmark that gives us a very in-depth look at the performance of the drives tested. This benchmark was run with both a 1GB and 8GB test size.
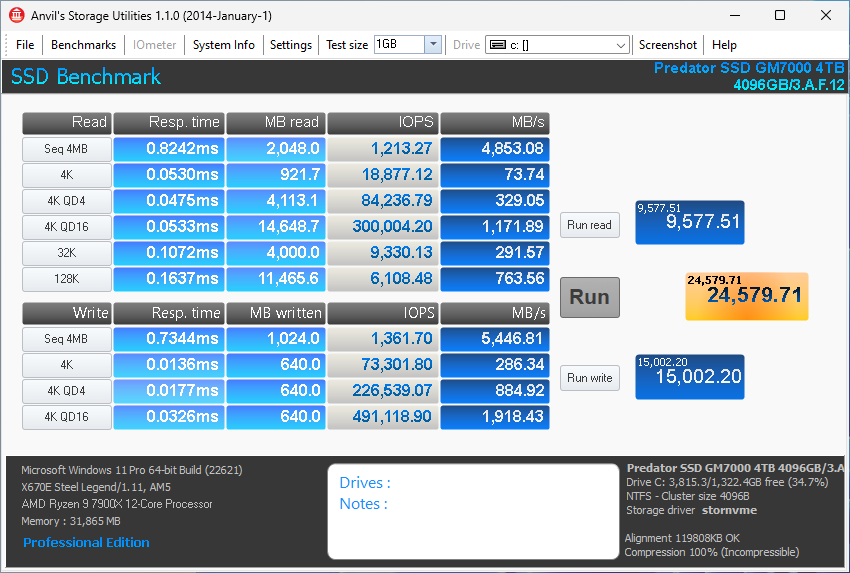
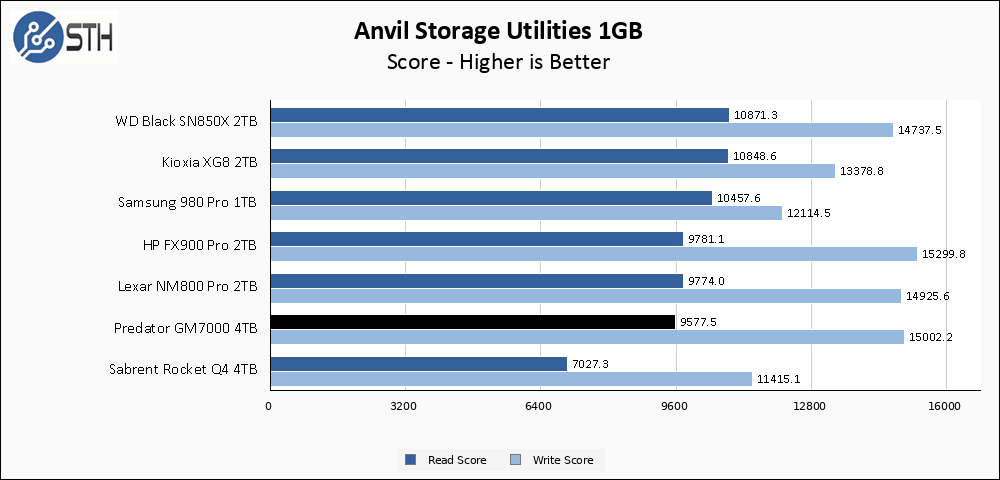
In Anvil, the InnoGrit trio (Predator, Lexar, HP) are again clustered together. This time, their write scores come in slightly behind some of the competition, but the write score is extremely strong.
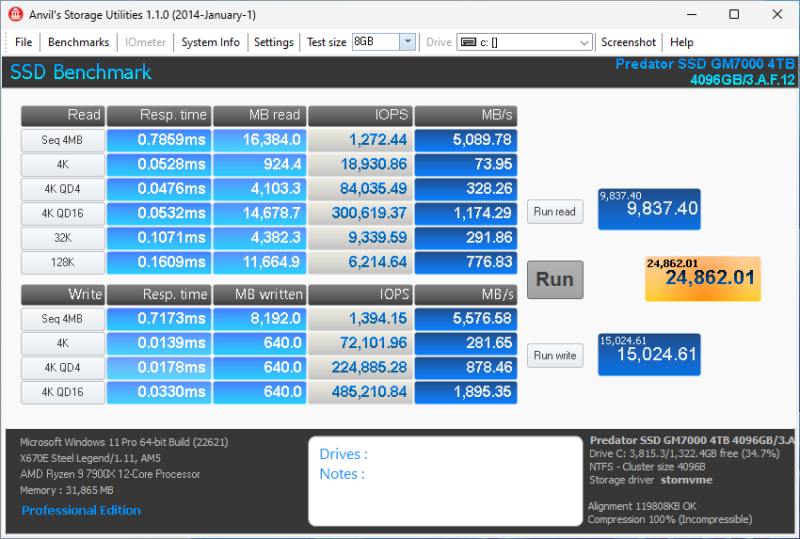
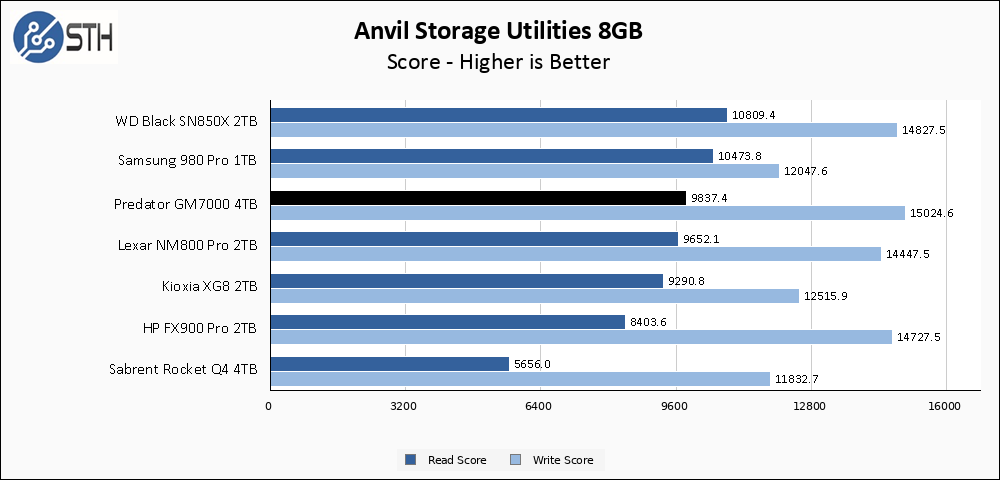
The larger Anvil test reveals a bit more resiliency in the Predator GM7000 4TB than the HP drive. The HP FX900 Pro drops a bit in read score, whereas the Predator drive actually improves in both read and write scores.
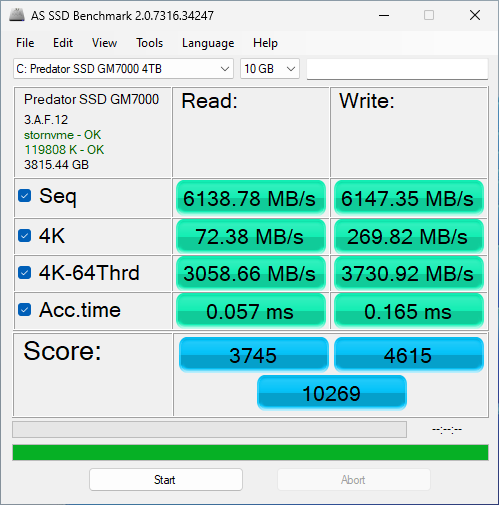
AS SSD Benchmark
AS SSD Benchmark is another good benchmark for testing SSDs. We run all three tests for our series. Like other utilities, it was run with both the default 1GB as well as a larger 10GB test set.

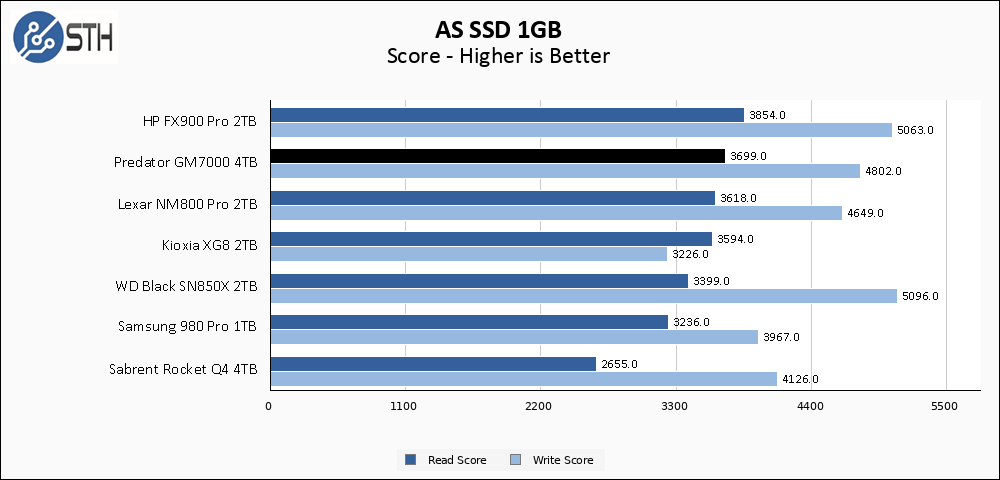
The Predator GM7000, along with the other InnoGrit drives, returns to the top of the chart for read score in AS SSD. Write score is just a small step behind the best drives on the chart as well.
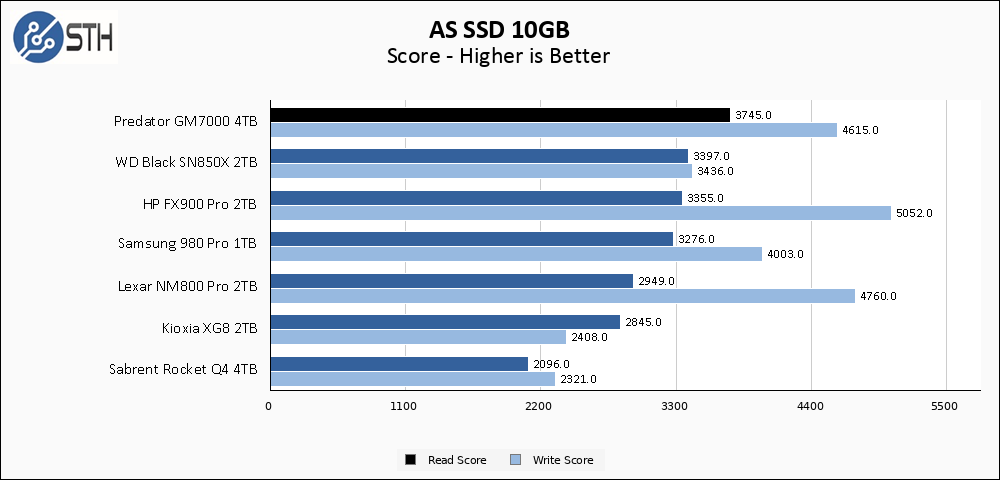
The larger AS SSD allows the Predator drive to garner a moderate read score lead versus the other drives on my chart. This test actually shows the largest differentiation between the three InnoGrit drives, with larger variations in both read and write scores than in most of my previous tests. For the Predator, read score in AS SSD takes the top spot, and write score is not far behind.
SPECworkstation, thermals, and our conclusion are up next.


re: post cache write speeds.
what is the write pattern?
is it random 4K, Q=1.
Without any cache in the middle, I don’t understand post cache write speeds of 1.3TB/sec, and faster?
Doesn’t the time to write natively, too large to support that kind of speed, unless the writes are to one raw, previously erased, erase block?
Also, if the NVME was full, raw hardware erase cycles, would be needed to allow for creating the needed raw space.
iq100,
The post-cache write speed is caught during the initial drive fill. Each drive starts with about 50GB of data on it (Windows and my benchmark utilities). I have a utility that I run ten separate instances of, and that utility generates random data and writes it to disk. Each instance of the utility writes a bunch of 10GB files until the volume is around 85% full. With ten separate utilities writing concurrently, the random data also ends up randomly interwoven; if the disks I was testing were mechanical they would be horribly fragmented by this process, which is on purpose.
This is done when the drives are essentially brand new; the blocks being written to are blank and not in a ‘dirty’ state. I do not claim this is the worst performance that you can generate on a given SSD, since it is possible to torture a drive and achieve even worse performance. I could cyclically run this test, filling up a drive and then deleting data while I do it without ever allowing time for garbage collection or TRIM, but most folks do not set out to torture their SSDs. What folks *do* occasionally do is large one-time data dumps, so knowing how fast a drive will write when you run out of cache is useful information to me.
And it’s 1.3 GB/s, not 1.3 TB/s. Just assuming that was a typo!
yes .. a typo
Will Taillac wrote “… I do not claim this is the worst performance that you can generate on a given SSD …”.
I would find it useful to know the actual hardware raw worst case timings. Specifically erase page size, and time to erase. My understanding is the raw erase times are large. That is why software/firmware/driver layers exist to hide the worst case physics of erasure (return to zero state). Would like to know when underlying NAND flash-like technology has physically changed. Has it?
Physically the NAND cells are smaller, and are now stacked. Changes. But you may want to create your own benchmark, or torture test. Not sure i see the value in that. But i’m the guy who also sees no value in posting hexadecimal numbers in a CDM screenshot. (Advanced, raw values, 10 dec)
Comments are closed.