AMD EPYC 7F32 Performance
For this exercise, we are using our legacy Linux-Bench scripts which help us see cross-platform “least common denominator” results we have been using for years as well as several results from our updated Linux-Bench2 scripts. Starting with our 2nd Generation Intel Xeon Scalable refresh benchmarks, we are adding a number of our workload testing features to the mix as the next evolution of our platform.
At this point, our benchmarking sessions take days to run and we are generating well over a thousand data points. We are also running workloads for software companies that want to see how their software works on the latest hardware. As a result, this is a small sample of the data we are collecting and can share publicly. Our position is always that we are happy to provide some free data but we also have services to let companies run their own workloads in our lab, such as with our DemoEval service. What we do provide is an extremely controlled environment where we know every step is exactly the same and each run is done in a real-world data center, not a test bench.
We are going to show off a few results, and highlight a number of interesting data points in this article.
Python Linux 4.4.2 Kernel Compile Benchmark
This is one of the most requested benchmarks for STH over the past few years. The task was simple, we have a standard configuration file, the Linux 4.4.2 kernel from kernel.org, and make the standard auto-generated configuration utilizing every thread in the system. We are expressing results in terms of compiles per hour to make the results easier to read:
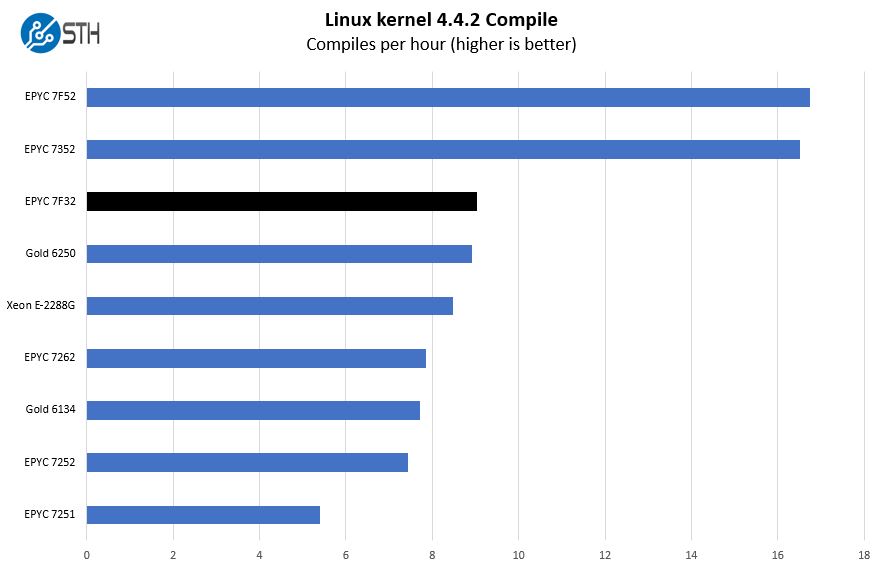
High frequencies, big caches, and a solid number of cores is a good recipe for compile benchmarks. As a result, the AMD EPYC 7F32 performs extremely well here. We pulled in single-socket results here so we could utilize the Xeon E-2288G. That is Intel’s 5GHz desktop-derived 8-core Xeon part. As you can see, the EPYC 7F32 and Xeon Gold 6250 are both performing better. While they cannot match the smaller die’s top-end clocks, they have more cache and memory bandwidth that helps here. That is a big reason that when we talk about per-core performance, we do not go to the smaller CPUs.
c-ray 1.1 Performance
We have been using c-ray for our performance testing for years now. It is a ray tracing benchmark that is extremely popular to show differences in processors under multi-threaded workloads. We are going to use our 8K results which work well at this end of the performance spectrum.
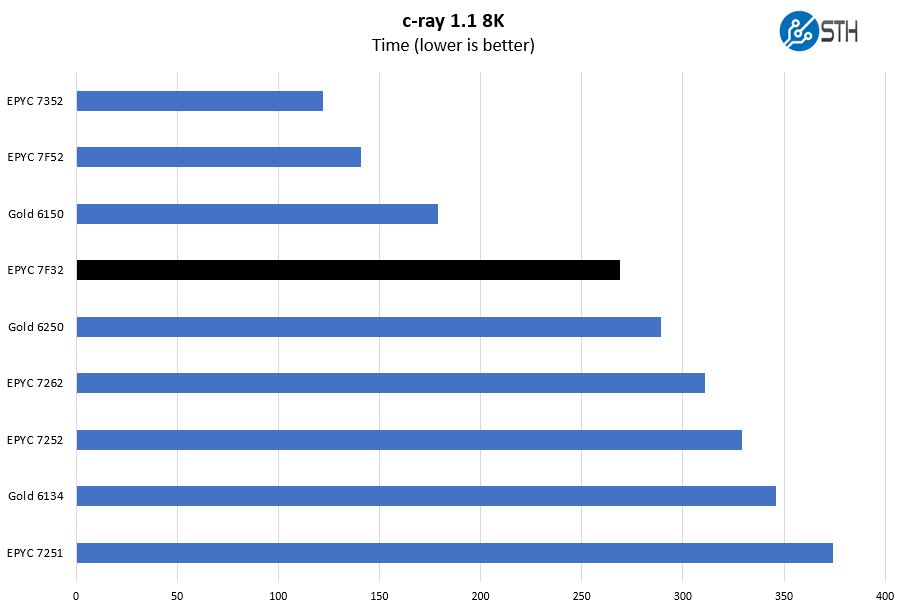
This is a benchmark that we started to use several years ago. There are architectural reasons the AMD Zen and Zen 2 chips perform extremely well here. Instead of looking at AMD versus Intel, it is best to look at AMD v. AMD here.
We can see a fairly large delta between this chip and the AMD EPYC 7262 which is the next lower-end model in the stack. That gap is exactly what buyers in this market want to see.
7-zip Compression Performance
7-zip is a widely used compression/ decompression program that works cross-platform. We started using the program during our early days with Windows testing. It is now part of Linux-Bench.
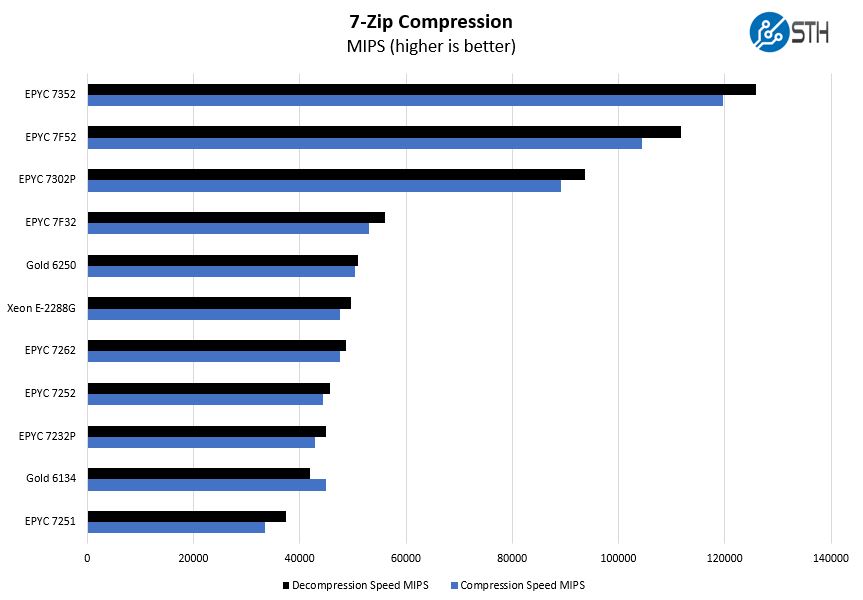
We are bringing in the Xeon E-2288G and EPYC 7232P results here to bring additional context. We will note here that the AMD EPYC 7252 and EPYC 7232P are other 8-core solutions from AMD. These two are part of the set of Rome CPUs with half memory bandwidth. You can read more about them in that piece or check the video out later to see why.
As a result, these are not really competitors in this market for maximum per-core performance.
NAMD Performance
NAMD is a molecular modeling benchmark developed by the Theoretical and Computational Biophysics Group in the Beckman Institute for Advanced Science and Technology at the University of Illinois at Urbana-Champaign. More information on the benchmark can be found here. With GROMACS we have been working hard to support AVX-512 and AVX2 architectures. Here are the comparison results for the legacy data set:
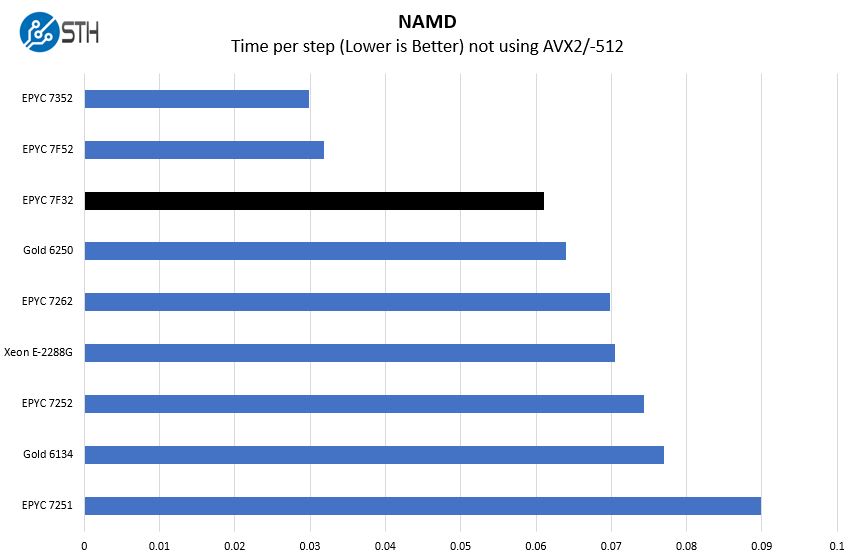
This is going to be the last time we pull the Xeon E-2288G numbers into a chart for this review, but we wanted to show the power of the AMD EPYC 7F32. When we are not using newer instructions, the CPU has a lot of raw power. While the Gold 6250 and Xeon E-2288G can hit higher turbo clocks, IPC still matters.
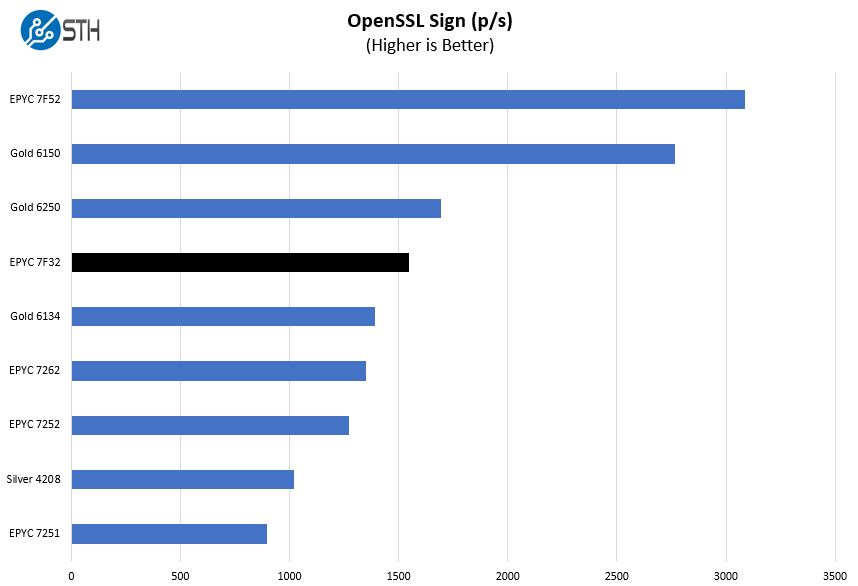
OpenSSL Performance
OpenSSL is widely used to secure communications between servers. This is an important protocol in many server stacks. We first look at our sign tests:
Here are the verify results:
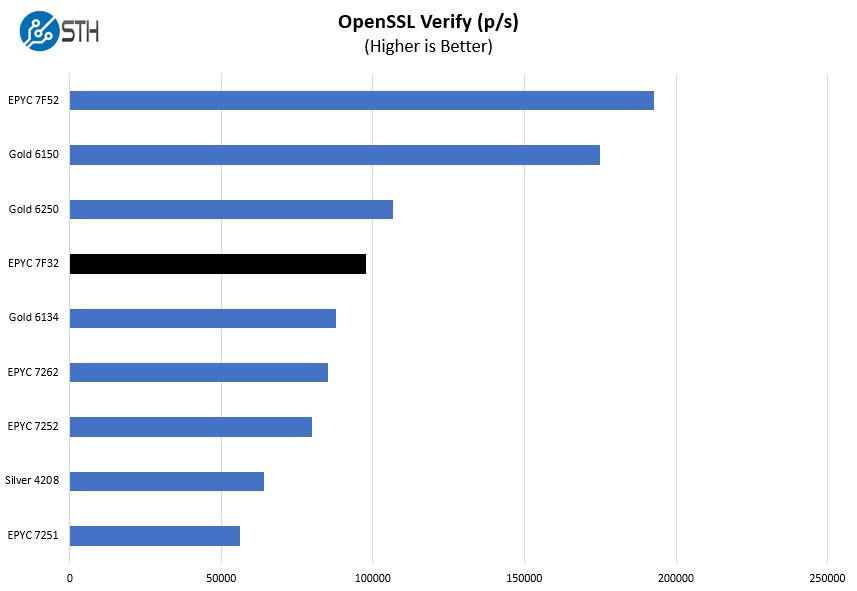
This is a workload that Intel may argue can be offloaded to QAT accelerators. Still, most architectures today do not have QAT accelerators since Intel uses this as an add-on sale either through accelerator cards or upgraded PCHs. Here, the Intel Xeon Gold 6250 performs very well and OpenSSL is a foundational technology for today’s infrastructure. The EPYC 7F32 generally performs well, but there are cases like this where the Xeon Gold 6250 pulls ahead.
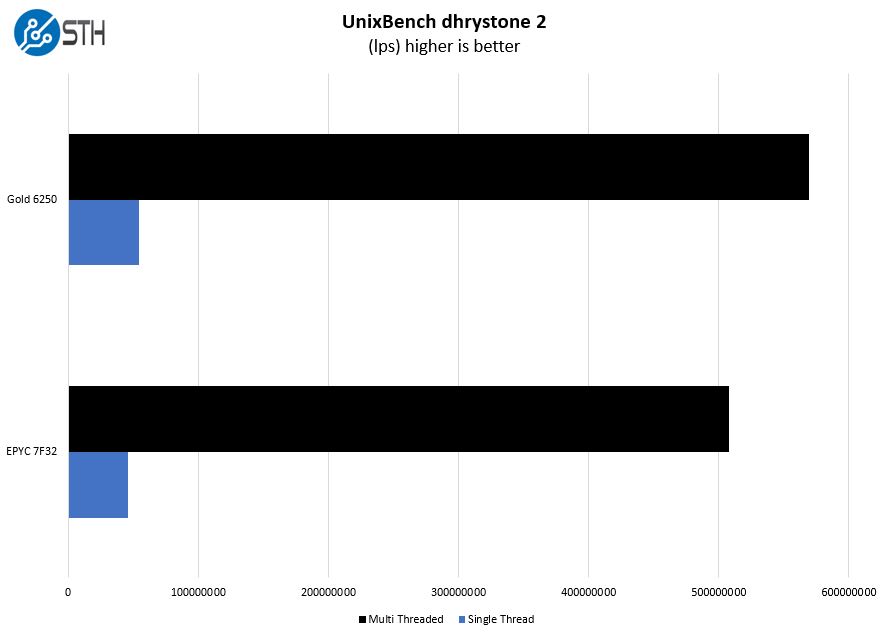
UnixBench Dhrystone 2 and Whetstone Benchmarks
Some of the longest-running tests at STH are the venerable UnixBench 5.1.3 Dhrystone 2 and Whetstone results. They are certainly aging, however, we constantly get requests for them, and many angry notes when we leave them out. UnixBench is widely used so we are including it in this data set. Here are the Dhrystone 2 results:
Here are the whetstone results:
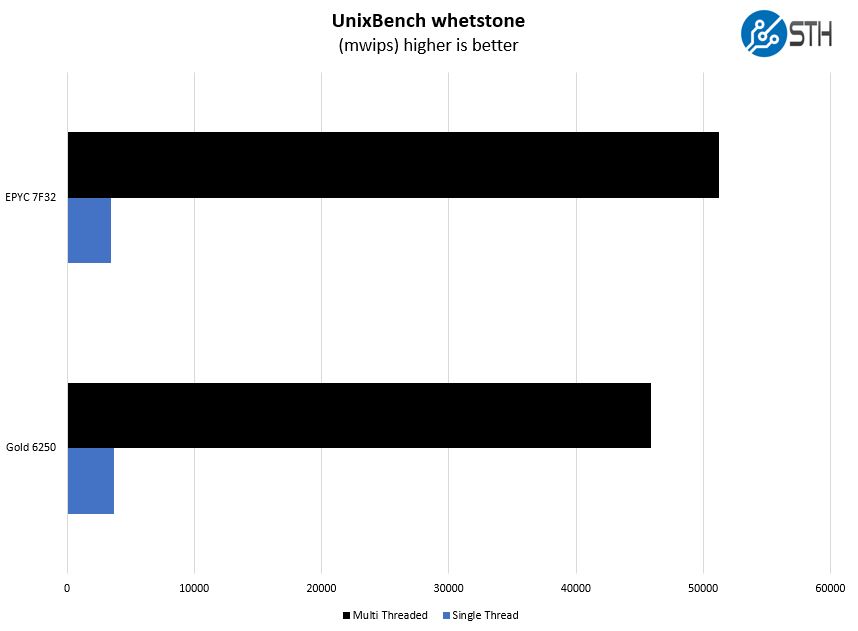
This was an interesting result. The first draft of this had a ton of different CPUs. If we are really showing Intel and AMD in this segment, these are the two most relevant results. Here, we see each trade top spot honors.
Chess Benchmarking
Chess is an interesting use case since it has almost unlimited complexity. Over the years, we have received a number of requests to bring back chess benchmarking. We have been profiling systems and now use the results in our mainstream reviews:
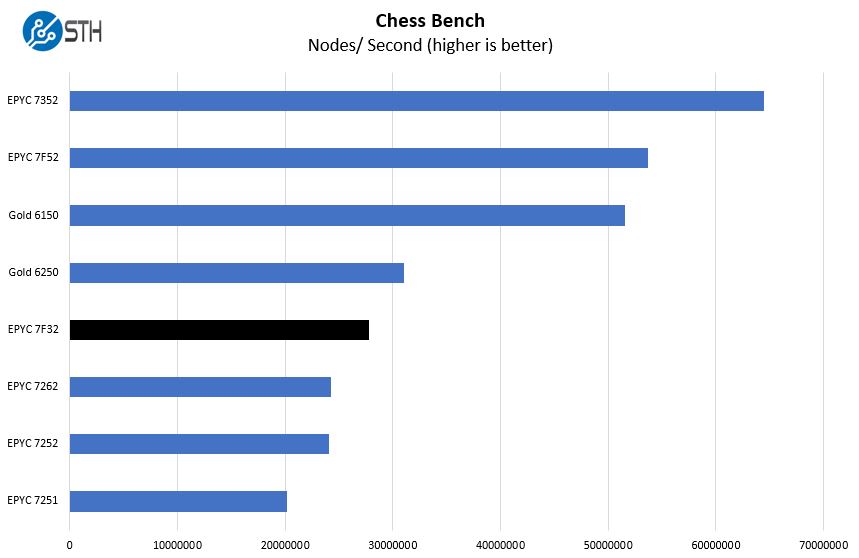
When we looked at the AMD EPYC 7F72 and Intel Xeon Gold 6248R the EPYC part had a lead. In the 8-core segment, Intel is pulling ahead here with the Xeon Gold 6250.
STH STFB KVM Virtualization Testing
One of the other workloads we wanted to share is from one of our DemoEval customers. We have permission to publish the results, but the application itself being tested is closed source. This is a KVM virtualization-based workload where our client is testing how many VMs it can have online at a given time while completing work under the target SLA. Each VM is a self-contained worker.
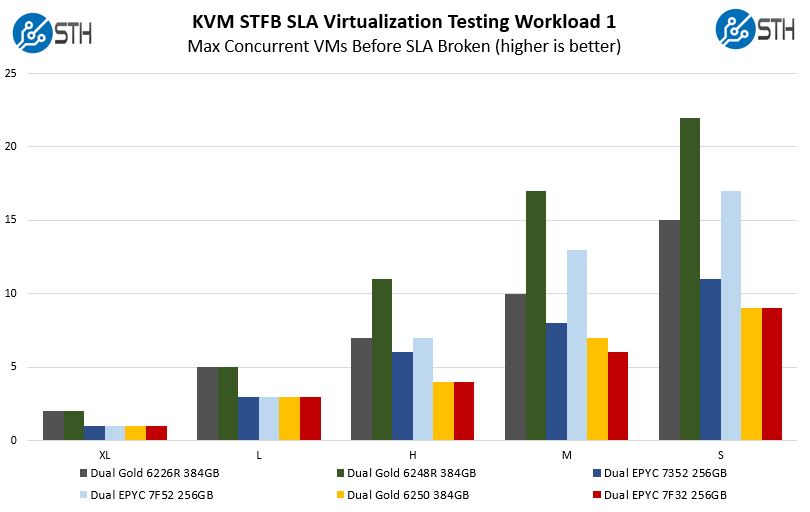
As a quick note here, since we only have 8 cores, this is not memory limited on either Intel or AMD platforms. The Xeon Gold 6250 and EPYC 7F32 are able to hit SLA’s at the same rate for all but the Medium test case.
Something that is not obvious from the chart is that the Medium delta looks bigger than it is. When we do our test runs, throw out the top and bottom quartile of results, then average the remaining, we rounded up for Intel and down for AMD. Intel did perform better, but it was much closer than it looks on these charts. Part of the reason is that these tests were designed for higher core counts assuming that the EPYC 7F32 and Gold 6250 would be about the minimum required to run one of the XL VMs. Since we are at the lower end of the test spectrum, we lose resolution here.
SPECrate2017_int_base
The last benchmark we wanted to look at is SPECrate2017_int_base performance. Specifically, we wanted to show the difference between what we get with Intel Xeon icc and AMD EPYC AOCC results.
Server vendors get better results than we do, but this gives you an idea of where we are at in terms of what we have seen:
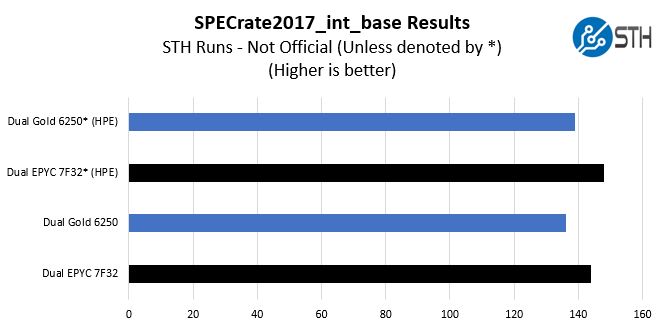
We received some comments noting we were a bit behind vendor results for some of our other tests, a fact that we noted in those reviews. Here we wanted to show both what we measured, and what server OEMs are measuring comparing the two chips.
HPE is a large server vendor so we are using their results from their dual-socket platforms (Gold 6250 on the HPE ProLiant DL380 Gen10 here and EPYC 7F32 on the ProLiant DL385 Gen10 Plus here.) If the actual values are important, then we suggest looking at the published results for the server(s) you are evaluating.
In either case with HPE’s results, or ours, we get a similar delta between the two chips. The AMD EPYC 7F32 pulls ahead by a notable margin. For some buyers, this will be enough to jump to the EPYC platform. For others, they will want to see a larger delta. That is the market reality.
Next, we are going to get into the “so what” and discuss market positioning for the processor before giving our final words.


‘F’ is for ‘F-ing confusing’ names.
I like including the HPE numbers. You’re using a Gen10+ for AMD but I get why. You’re basically making the point for why you would in the editor’s note.
We are considering the 7F* models despite the price premium. When your license costs (vastly) dominate your hardware costs, peak per-core performance can rule the day. We’re looking at 7F32 for our critical workloads that gate delivery to manufacturing, and 7F72 for volume workloads as a nod to datacenter space constraints.
Your pg.4 analysis is spot on.
I agree with @HansF1973.
The candor of the product/market analysis on page 4 is refreshing to see in a review article.
I’ve read too many review articles elsewhere that are little more than blah cheerleader material.
3.9 GHz on 8 cores for …how much???! $2100? Those will likely gather some dust on assorted shelves…(too pricey, IMO)
Sadly the processor cost is nothing compared to the licensing fees on a couple of dozen programs, see: https://glennsqlperformance.com/2020/05/20/recommended-amd-processors-for-sql-server/ .
If you are entangled it’s probably worth paying to dig your way out and move to PostgreSQL, MySQL or another open source solution: https://db-engines.com/en/system/Microsoft+SQL+Server%3BMySQL%3BOracle%3BPostgreSQL – though in some cases running under a VM with fewer cores is an option the pain comes when the fine print says that the Enterprise edition must be licensed for a minimum of 16 cores, so it’s twice as bad as first thought.
In some cases (Maya, Ansys, others) there is ‘no’ alternative, trying to get something to look like Maya is an Art in itself, and some things are simply the accepted Standard (a selling point, in a service being offered).
In a narrow set of cases it’s not just the higher clocks and larger cache but also the larger memory, even the reliability; leaving dreams of ThreadRipper short lived and the longevity of Intel solutions better understood (look at the difference in price of the whole, not just a single part).
Still, these processors would need to be more than half as expensive to appeal to me; and I can afford to wait to see what next year brings us.
Comments are closed.