AMD EPYC 7763 Initial Performance Observations
Since we recently published the AMD EPYC 7003 Milan The Fast Gets Faster piece, little has changed in terms of performance. We will re-visit the performance with our Ice Lake launch piece. What we will do is augment what we had with the launch piece in a few key areas, specifically looking at system variations and having three systems. The six EPYC 7763 parts we are using have 280W TDP which is on the higher end of this segment so if there are cooling challenges, we will see them. Also, we have a bit of new data and a way to think about this CPU that came to light running the three systems.
Python Linux 4.4.2 Kernel Compile Benchmark
This is one of the most requested benchmarks for STH over the past few years. The task was simple, we have a standard configuration file, the Linux 4.4.2 kernel from kernel.org, and make the standard auto-generated configuration utilizing every thread in the system. We are expressing results in terms of compiles per hour to make the results easier to read:
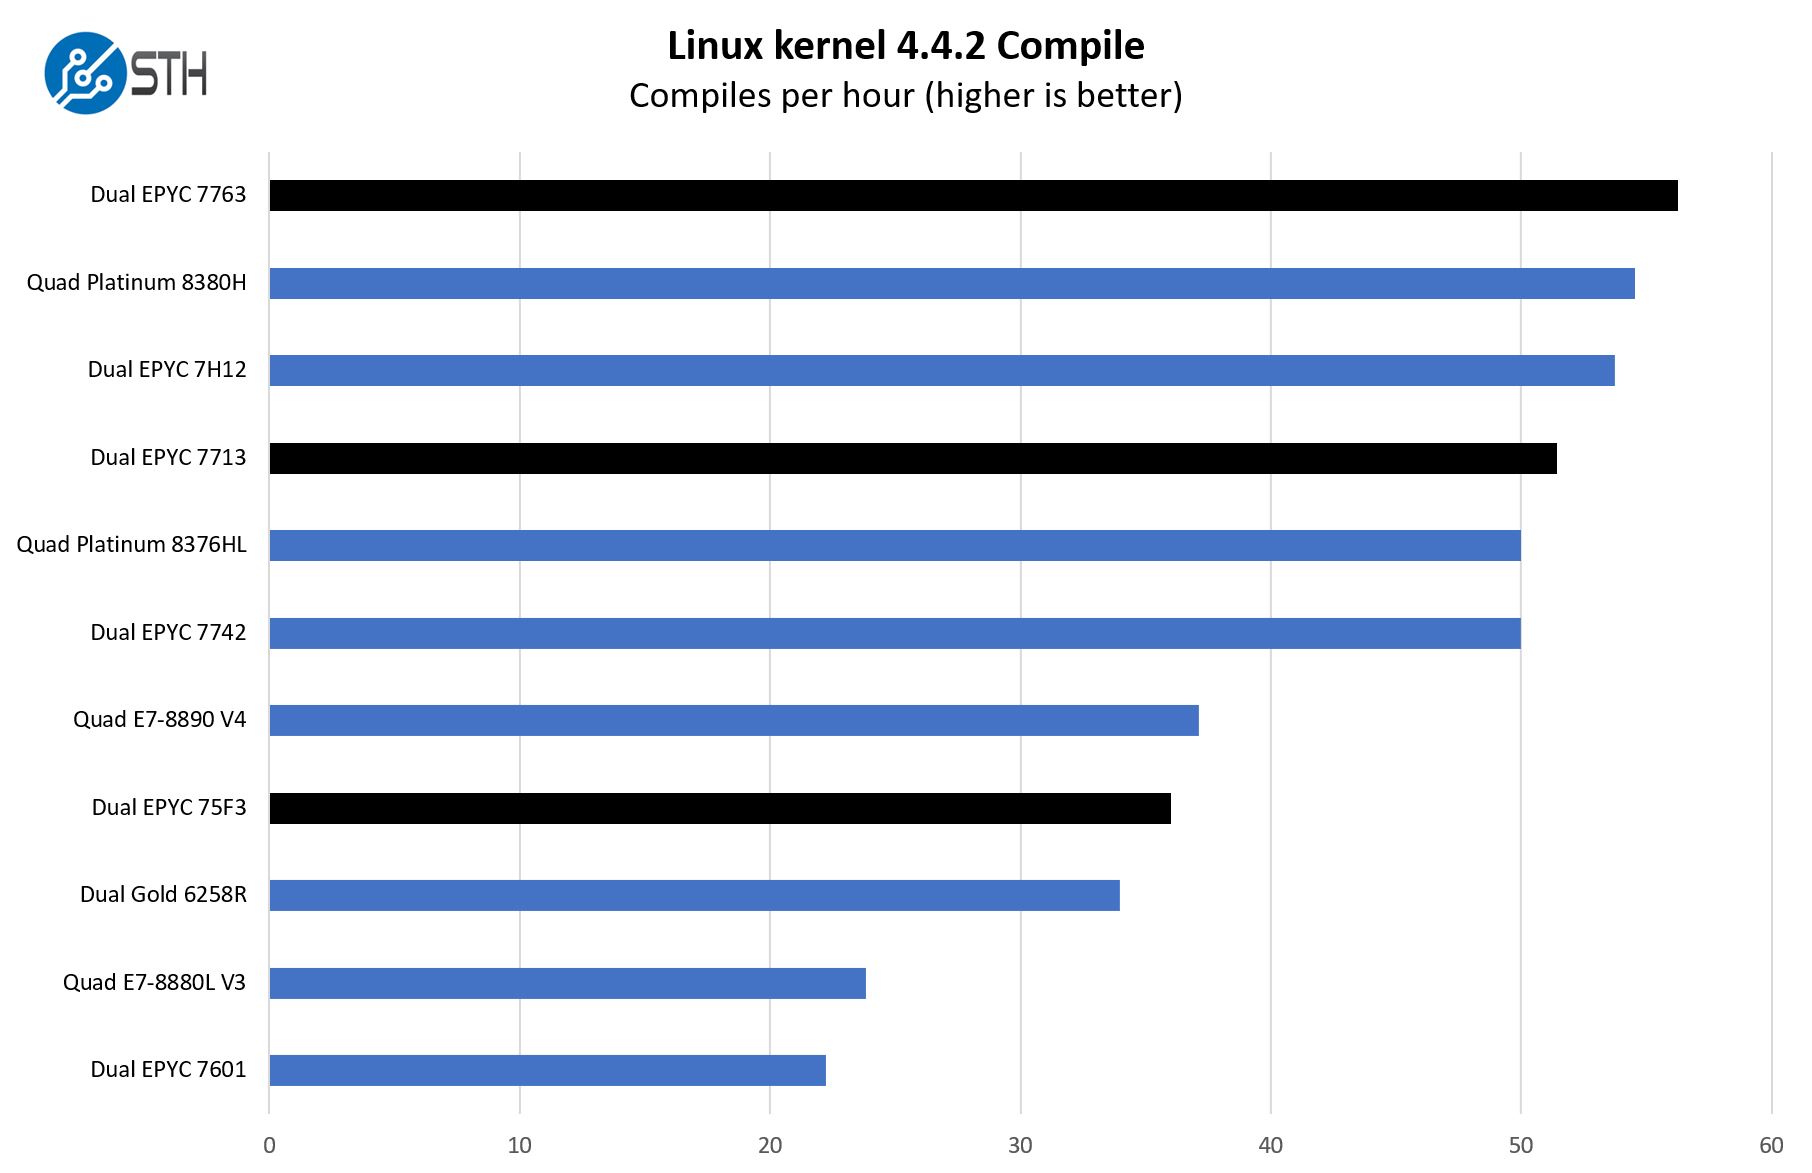
This is an interesting case. Here we can see that the dual AMD EPYC 7763 slightly edges out the quad Intel Xeon Platinum 8380H setup. We are using Cooper Lake here because it is still the only 3rd Generation Xeon Scalable CPU we can compare.
7-zip Compression Performance
7-zip is a widely used compression/ decompression program that works cross-platform. We started using the program during our early days with Windows testing. It is now part of Linux-Bench.
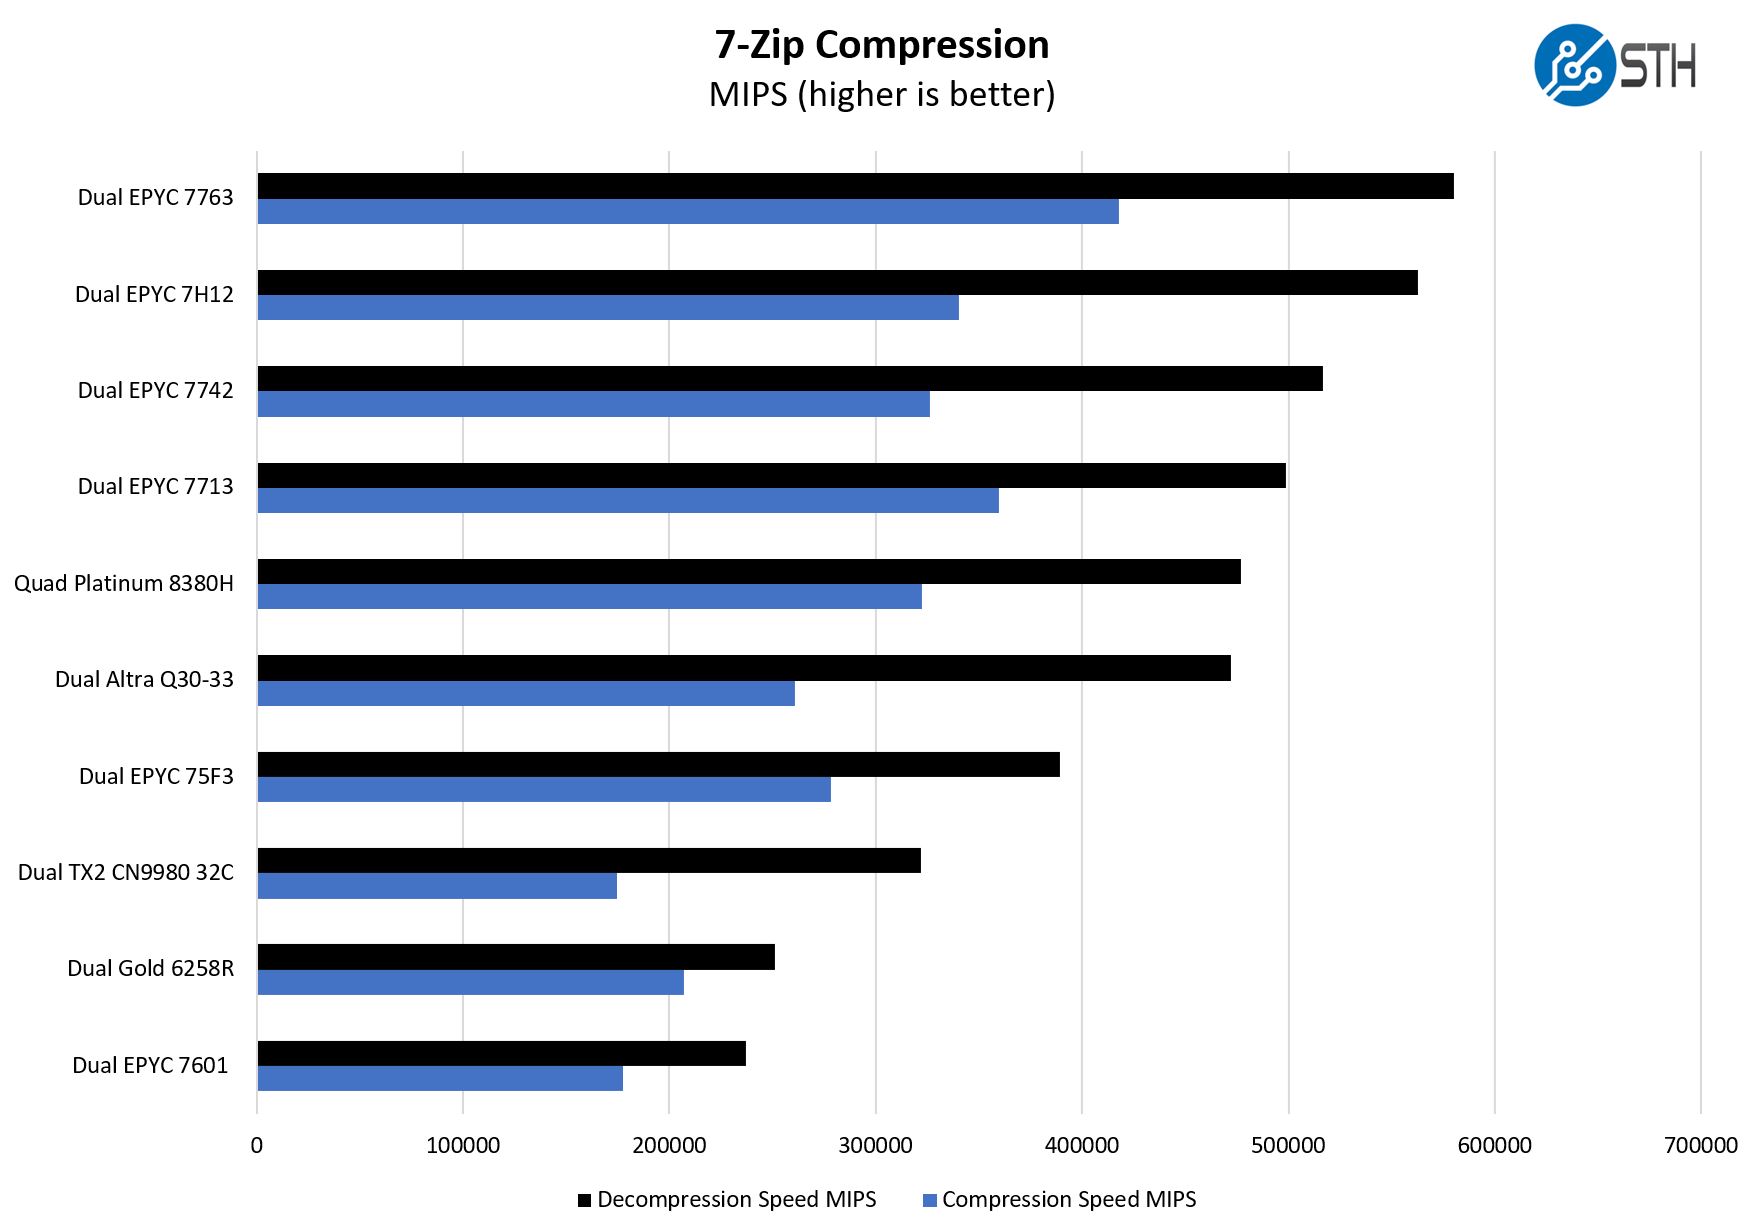
Here is a great example where AMD is performing very well. We can see AMD pushing beyond even the Ampere Altra Q80-33 which is an 80-core Arm-based processor. Where Ampere was in the right performance arena for Rome, it will need the 128 core Altra Max to compete with Milan. Ampere and the Arm ecosystem know this is the case. With Oracle Cloud using the Ampere Altra, and this is similar to the Graviton2 on AWS, cloud providers control pricing which means cost/ performance is how a cloud provider prices Arm, not necessarily tied to the hardware. Still, if you just want the biggest processor you can put in a server from almost any major vendor today, then the EPYC 7763 is one that tends to perform well.
c-ray 8K Performance
Although not the intended job for these, we also just wanted to get something that is very simple and scales extremely well to more cores.
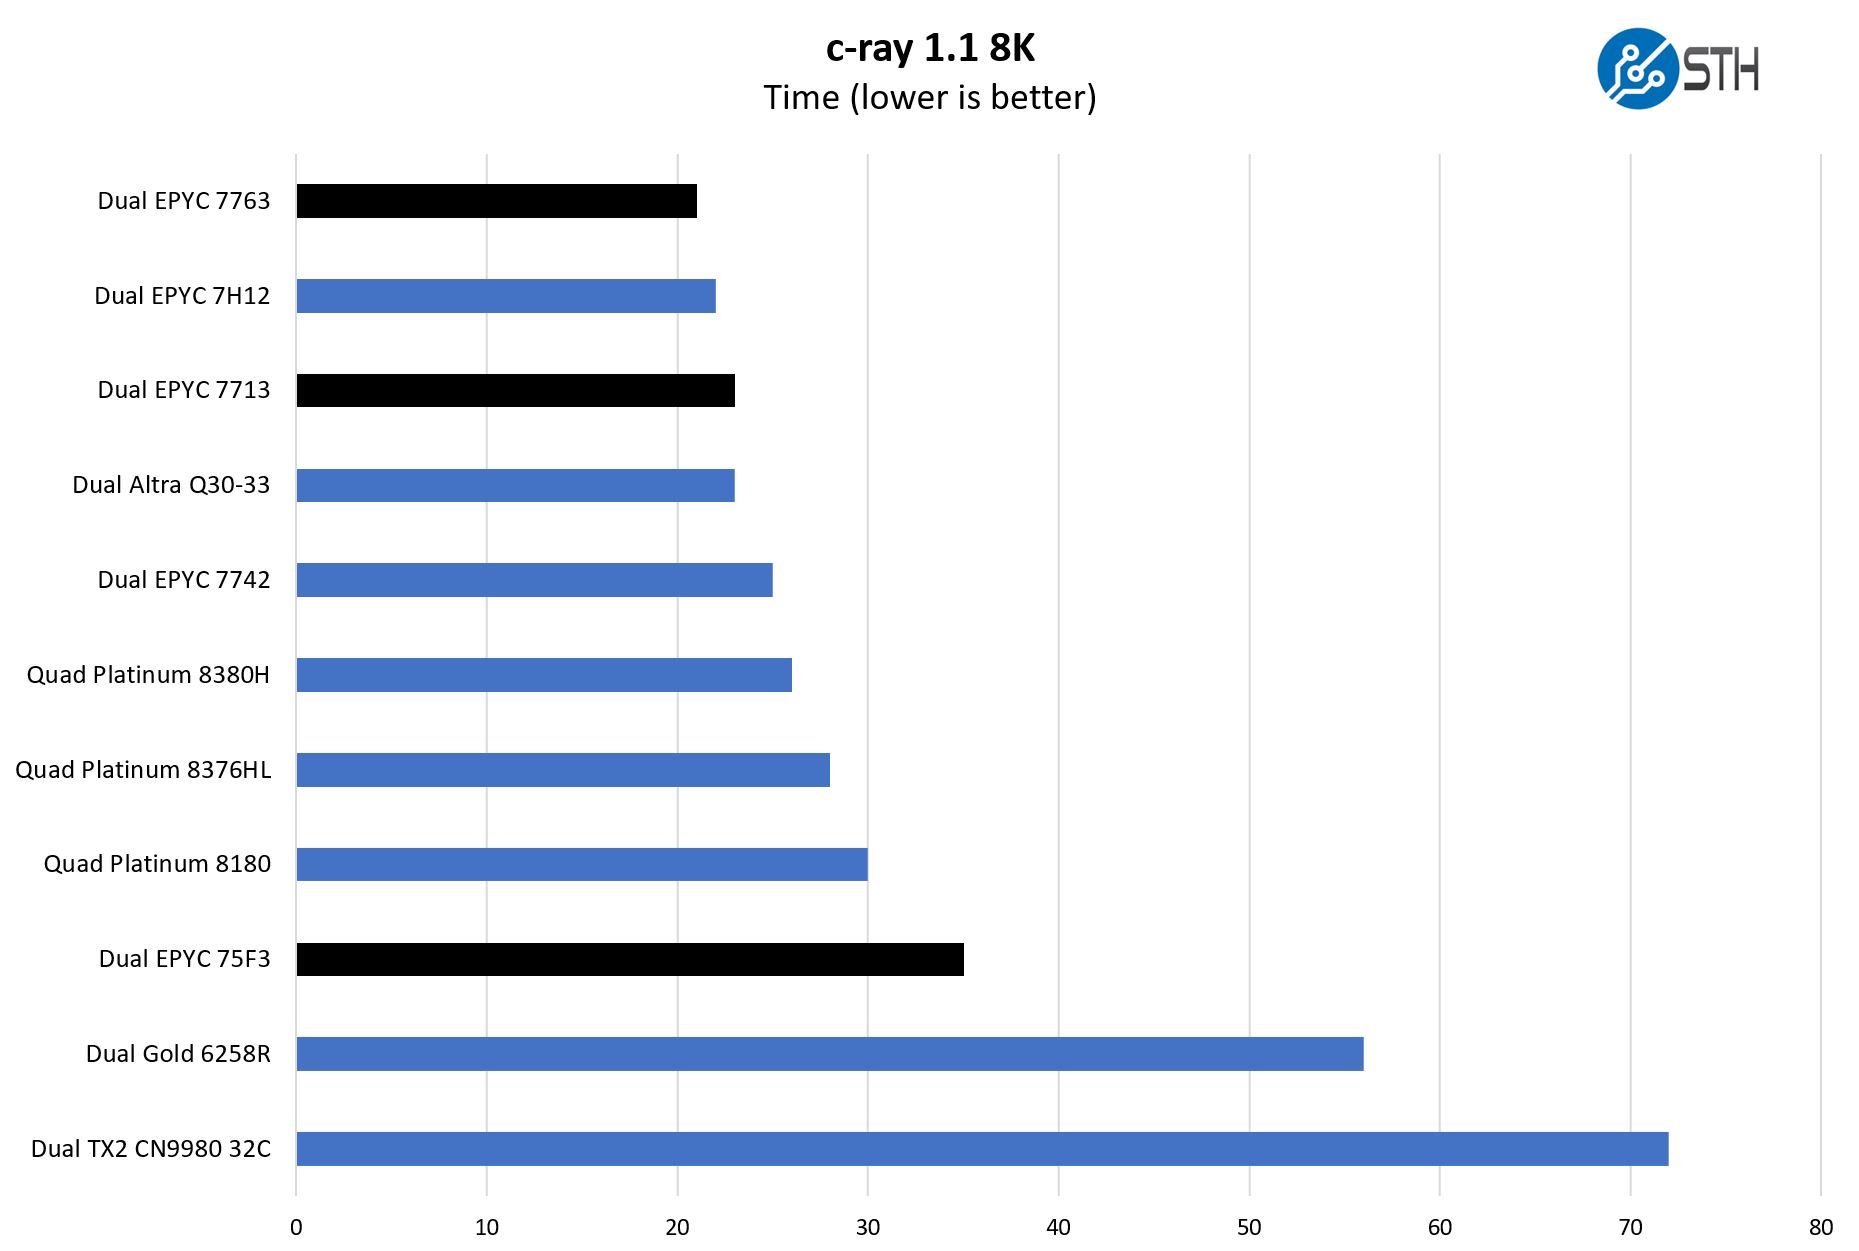
Here AMD Zen1-3 architectures have an advantage on this microbenchmark versus Intel. We tend to use it more for AMD-to-AMD comparisons or Intel-to-Intel as a result. Still, the performance is quite good.
OpenSSL Performance
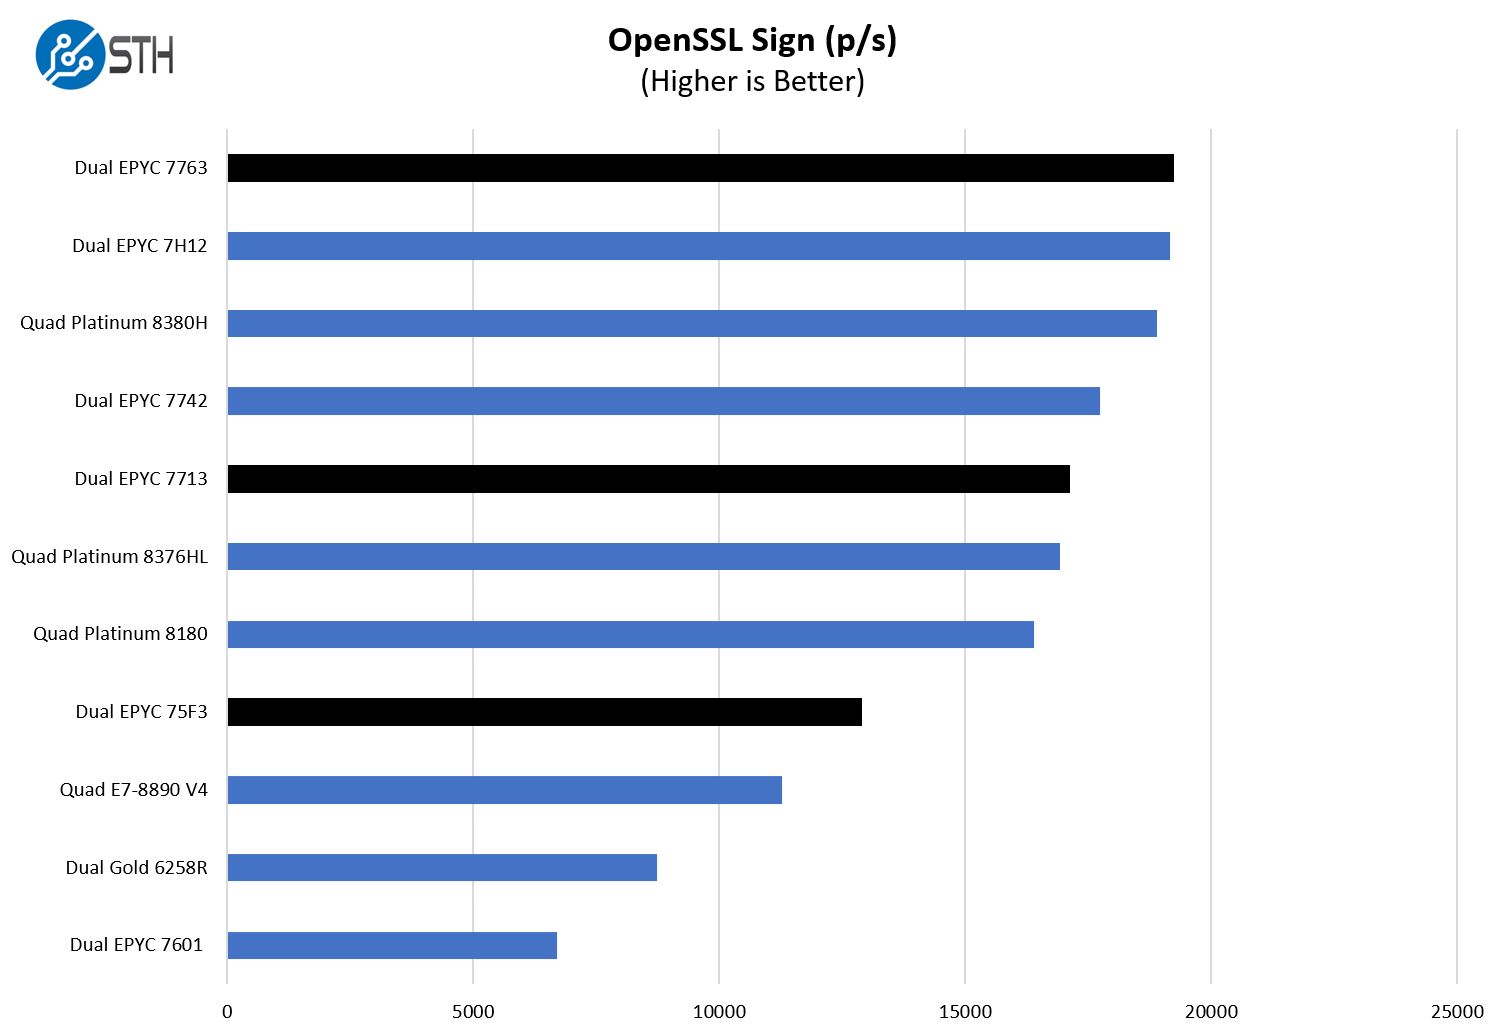
OpenSSL is widely used to secure communications between servers. This is an important protocol in many server stacks. We first look at our sign tests:
Here are the verify results:
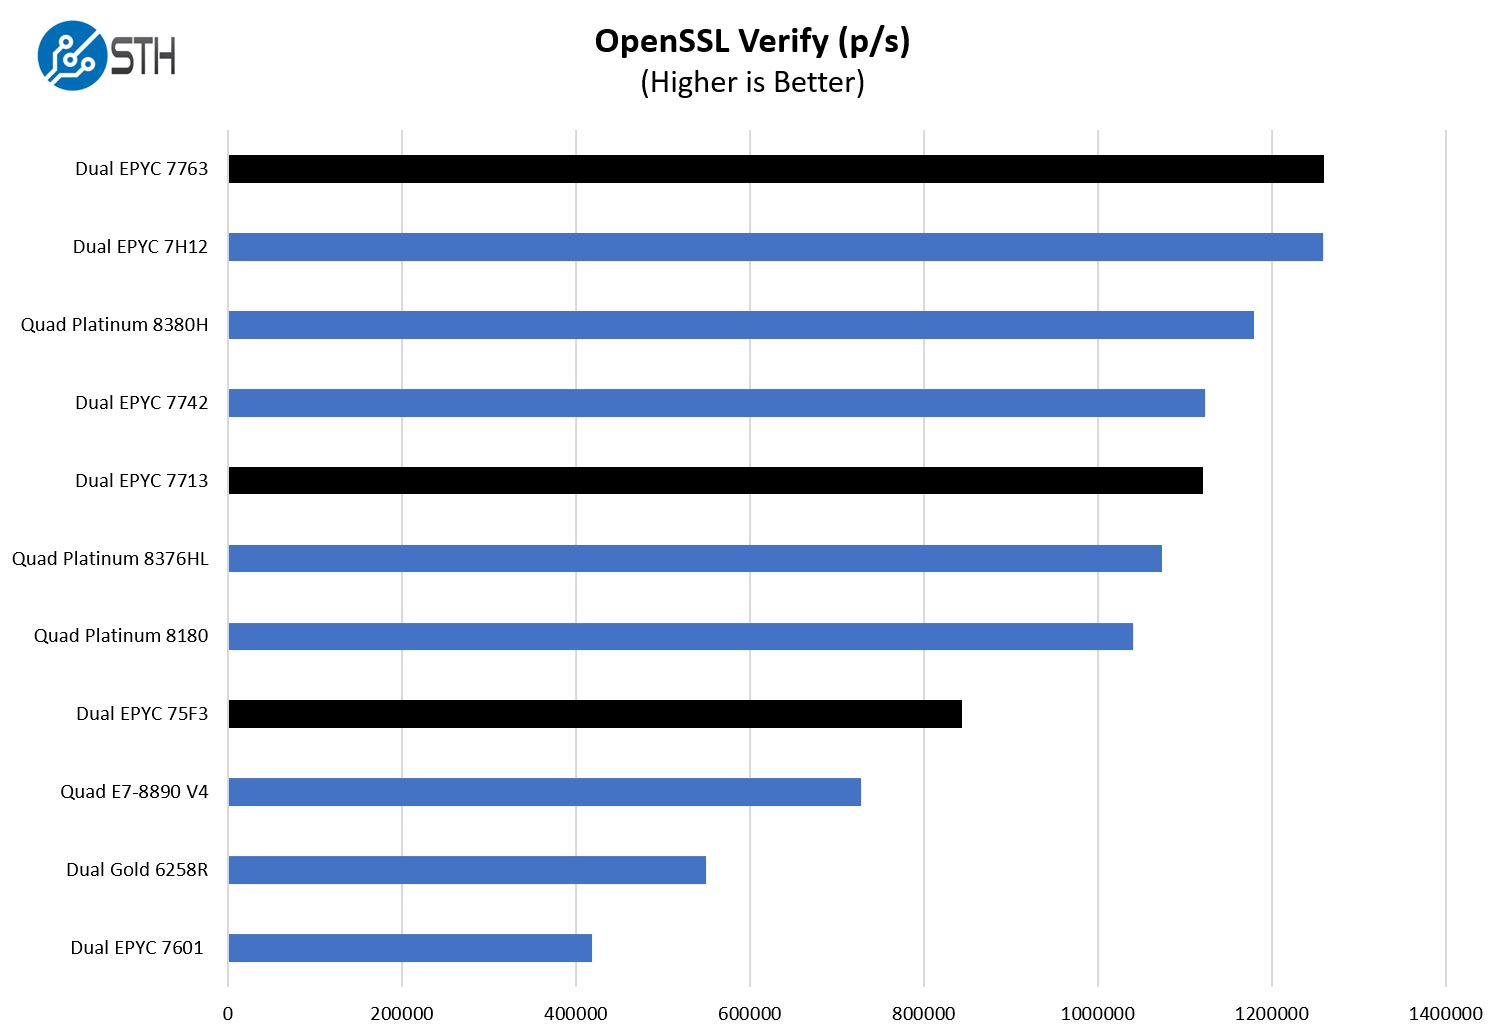
A trend one will quickly see is that the dual AMD EPYC 7763 setup is performing very well compared to the Intel parts. We specifically have quad CPU results shown here because at some point we need more cores to keep the charts more even with the high-end parts.
Chess Benchmarking
Chess is an interesting use case since it has almost unlimited complexity. Over the years, we have received a number of requests to bring back chess benchmarking. We have been profiling systems and now use the results in our mainstream reviews:
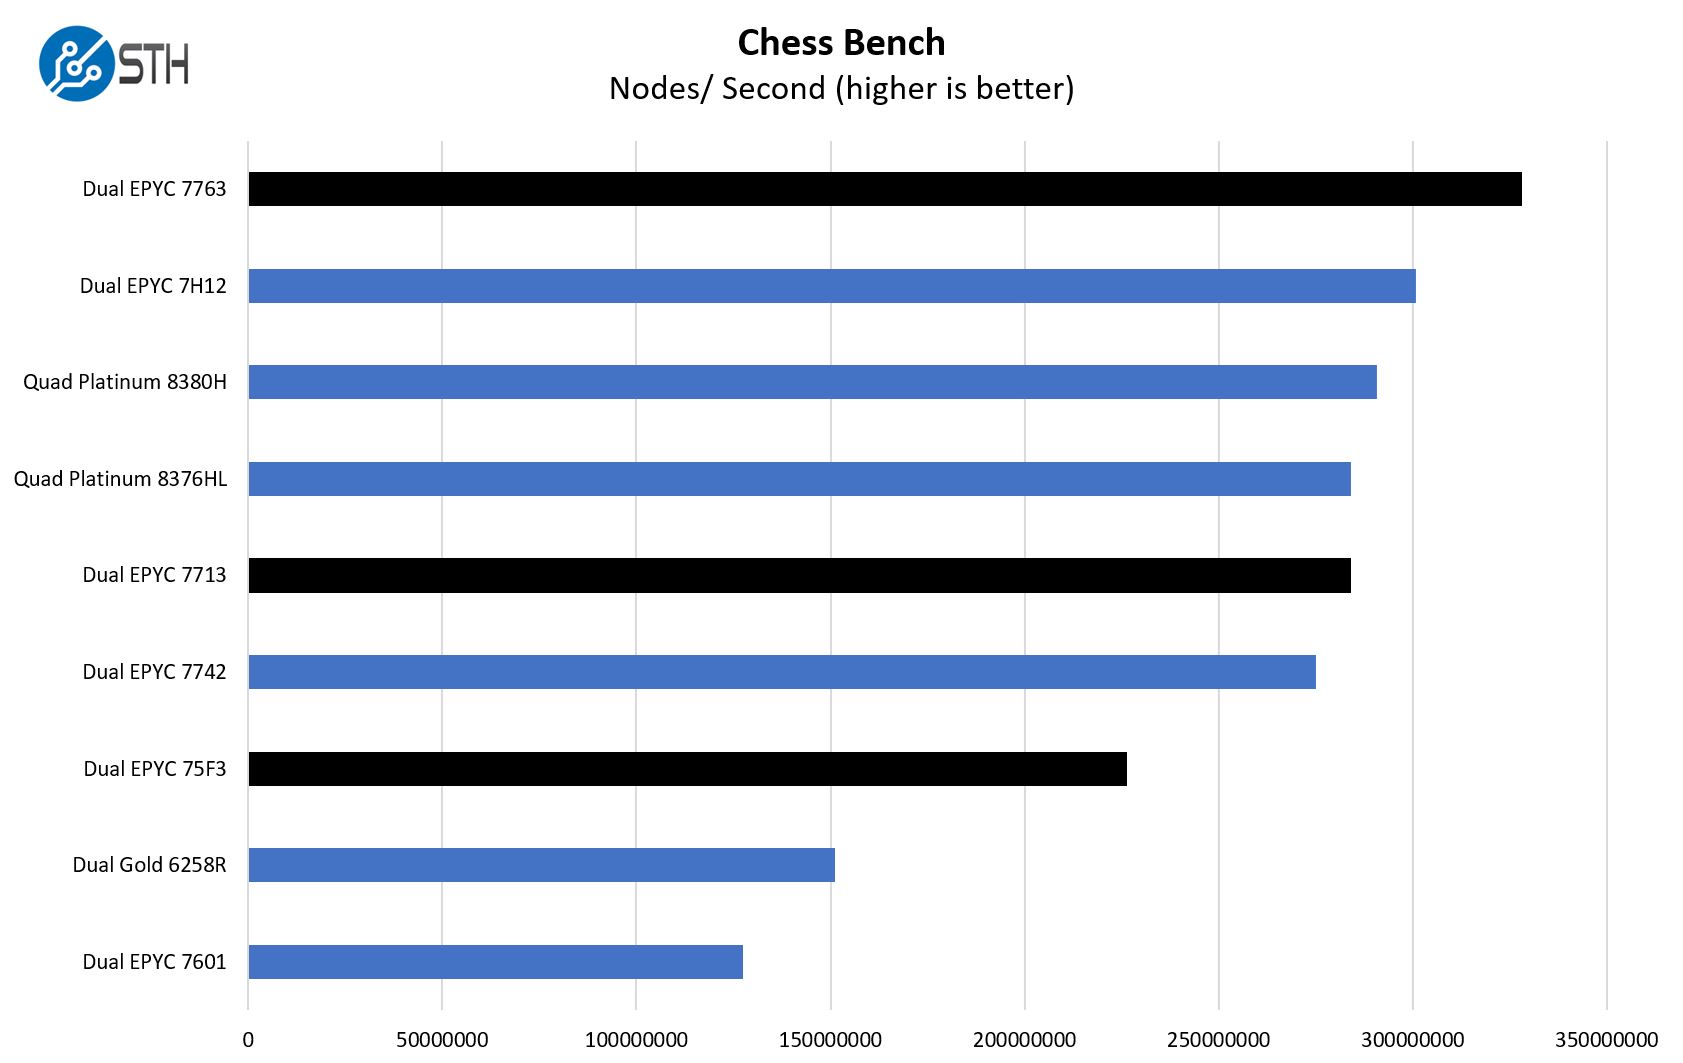
Something that we noted in our launch piece is that this benchmark will utilize bmi2 or popcnt paths based on which is faster. With the EPYC 7601, it clearly used popcnt since bmi2 was a non-starter, as with many low-end Pentium/ Celeron CPUs on the consumer side. With the EPYC 7002 generation, bmi2 would run, but the popcnt performance would be higher than the bmi2 result. Generally, Xeon has run faster with bmi2 for some time. With Zen3 and the EPYC 7003 series, bmi2 is faster than the popcnt which represents a major performance improvement.
This is not apparent from the charts, but it is an example of how AMD is doing instruction and microarchitectural level changes beyond just the L3 cache partition changes with Zen3.
MariaDB Pricing Analytics
This is a personally very interesting one for me. The origin of this test is that we have a workload that runs deal management pricing analytics on a set of data that has been anonymized from a major data center OEM. The application effectively is looking for pricing trends across product lines, regions, and channels to determine good deal/ bad deal guidance based on market trends to inform real-time BOM configurations. If this seems very specific, the big difference between this and something deployed at a major vendor is the data we are using. This is the kind of application that has moved to AI inference methodologies, but it is a great real-world example of something a business may run in the cloud.
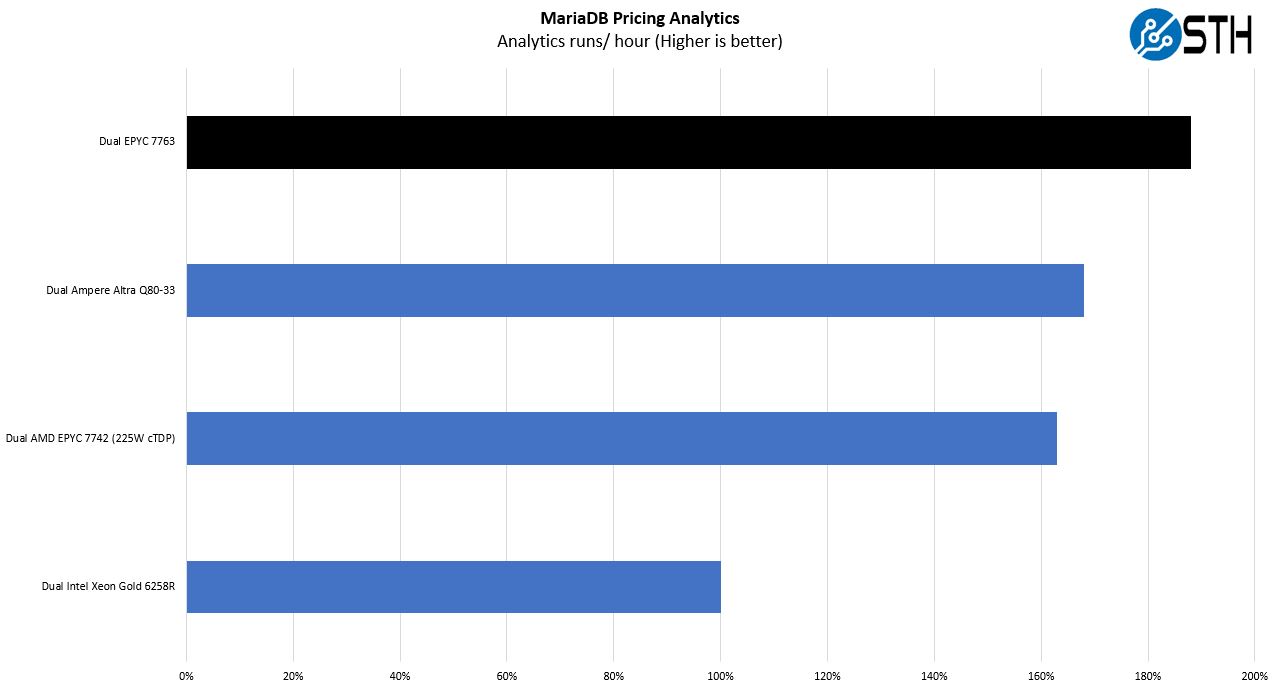
We wanted to push some higher-end results using the top-end standard 2P SKUs. Here we removed the 2P results and one can see that Milan offers an impressive performance boost. This is more of a real-world application rather than a micro-benchmark so we see a solid gain, but not what we have seen in the smaller benchmarks. This is a ~100GB dataset so it cannot fit within the 256MB L3 cache on a single CPU.
During our initial EPYC 7003 launch coverage, we got some feedback that we should have used something larger, over 200GB. Our challenge here is twofold. First, we are hoping to run this on single-socket nodes as well. Second, since this is based on sanitized data, it also means we have only so much to work with. We may go through an augmentation exercise but then that changes the data set description.
STH nginx CDN Performance
On the nginx CDN test, we are using an old snapshot and access patterns from the STH website, with DRAM caching disabled, to show what the performance looks like fetching data from disks. This requires low latency nginx operation but an additional step of low-latency I/O access which makes it interesting at a server-level. Here is a quick look at the distribution:
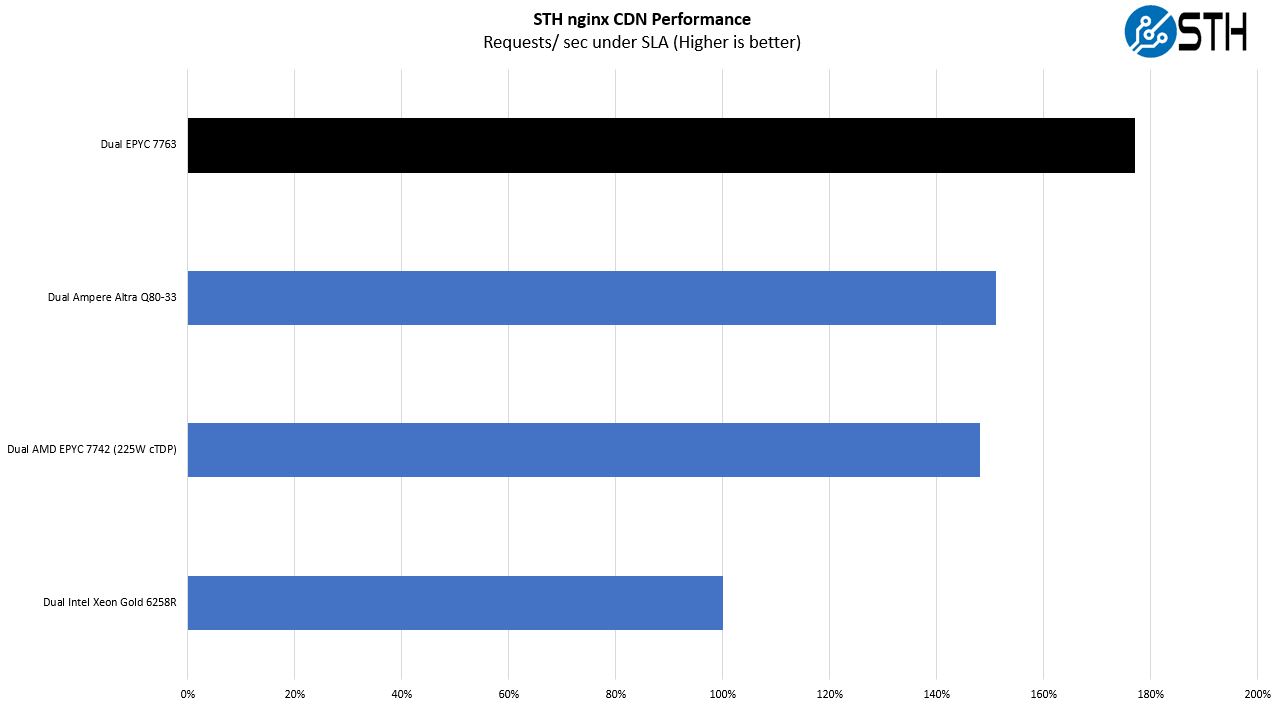
Again, higher clock speeds help here, but we also get great performance testing more than just CPU performance.
During our launch piece, we commented “we have heard that pairing the AMD EPYC 7763 with the new Intel Optane P5800X PCIe Gen4 SSD is becoming an exciting combination.
Now that we have Optane P5800X and have paired it with Ice Lake Xeons and AMD EPYC 7763’s, we will simply say this. NAND is great for capacity storage. If you want something faster on your PCIe bus, whether that is AMD EPYC or Intel Xeon, this is a great drive. Intel has been marketing its portfolio of products, but we validated that the P5800X works with the AMD EPYC 7763 and is very fast.
STH STFB KVM Virtualization Testing
One of the other workloads we wanted to share is from one of our DemoEval customers. We have permission to publish the results, but the application itself being tested is closed source. This is a KVM virtualization-based workload where our client is testing how many VMs it can have online at a given time while completing work under the target SLA. Each VM is a self-contained worker.
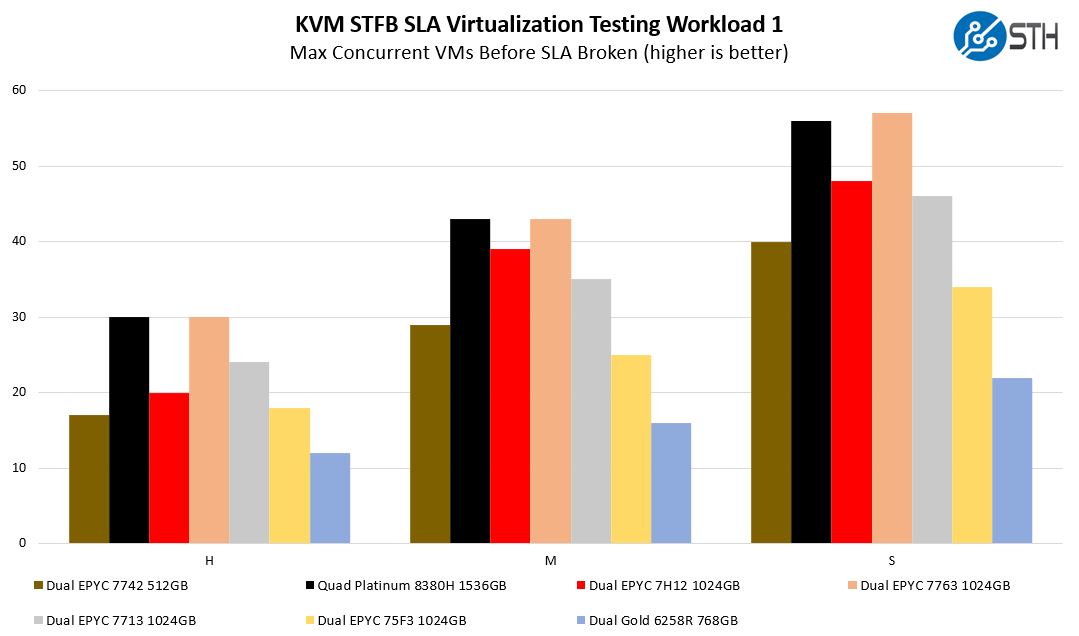
Here is where we see a big jump from the AMD EPYC 7H12 to the EPYC 7763. As the VMs get larger, we start getting more cases of crossing the CCX domains on Rome which hurt performance. With Milan, and the larger 8 core / 32MB CCX, we see the platform is able to host more VMs before the SLA is broken. This is a huge deal, and not something that is readily apparent with microbenchmarks.
One can argue that micro-benchmarks are purer since they are testing one type of application/ operation, however, realistically many of the 64 core CPU nodes are going to be virtualized or running containers. At this core count, one almost wants to run different workloads just to fully utilize the hardware.
SPECrate2017_int_base
The last benchmark we wanted to look at is SPECrate2017_int_base performance. Specifically, we wanted to show the difference between what we get with Intel Xeon icc and AMD EPYC AOCC results and across a few generations.
Server vendors get better results than we do, but this gives you an idea of where we are at in terms of what we have seen:
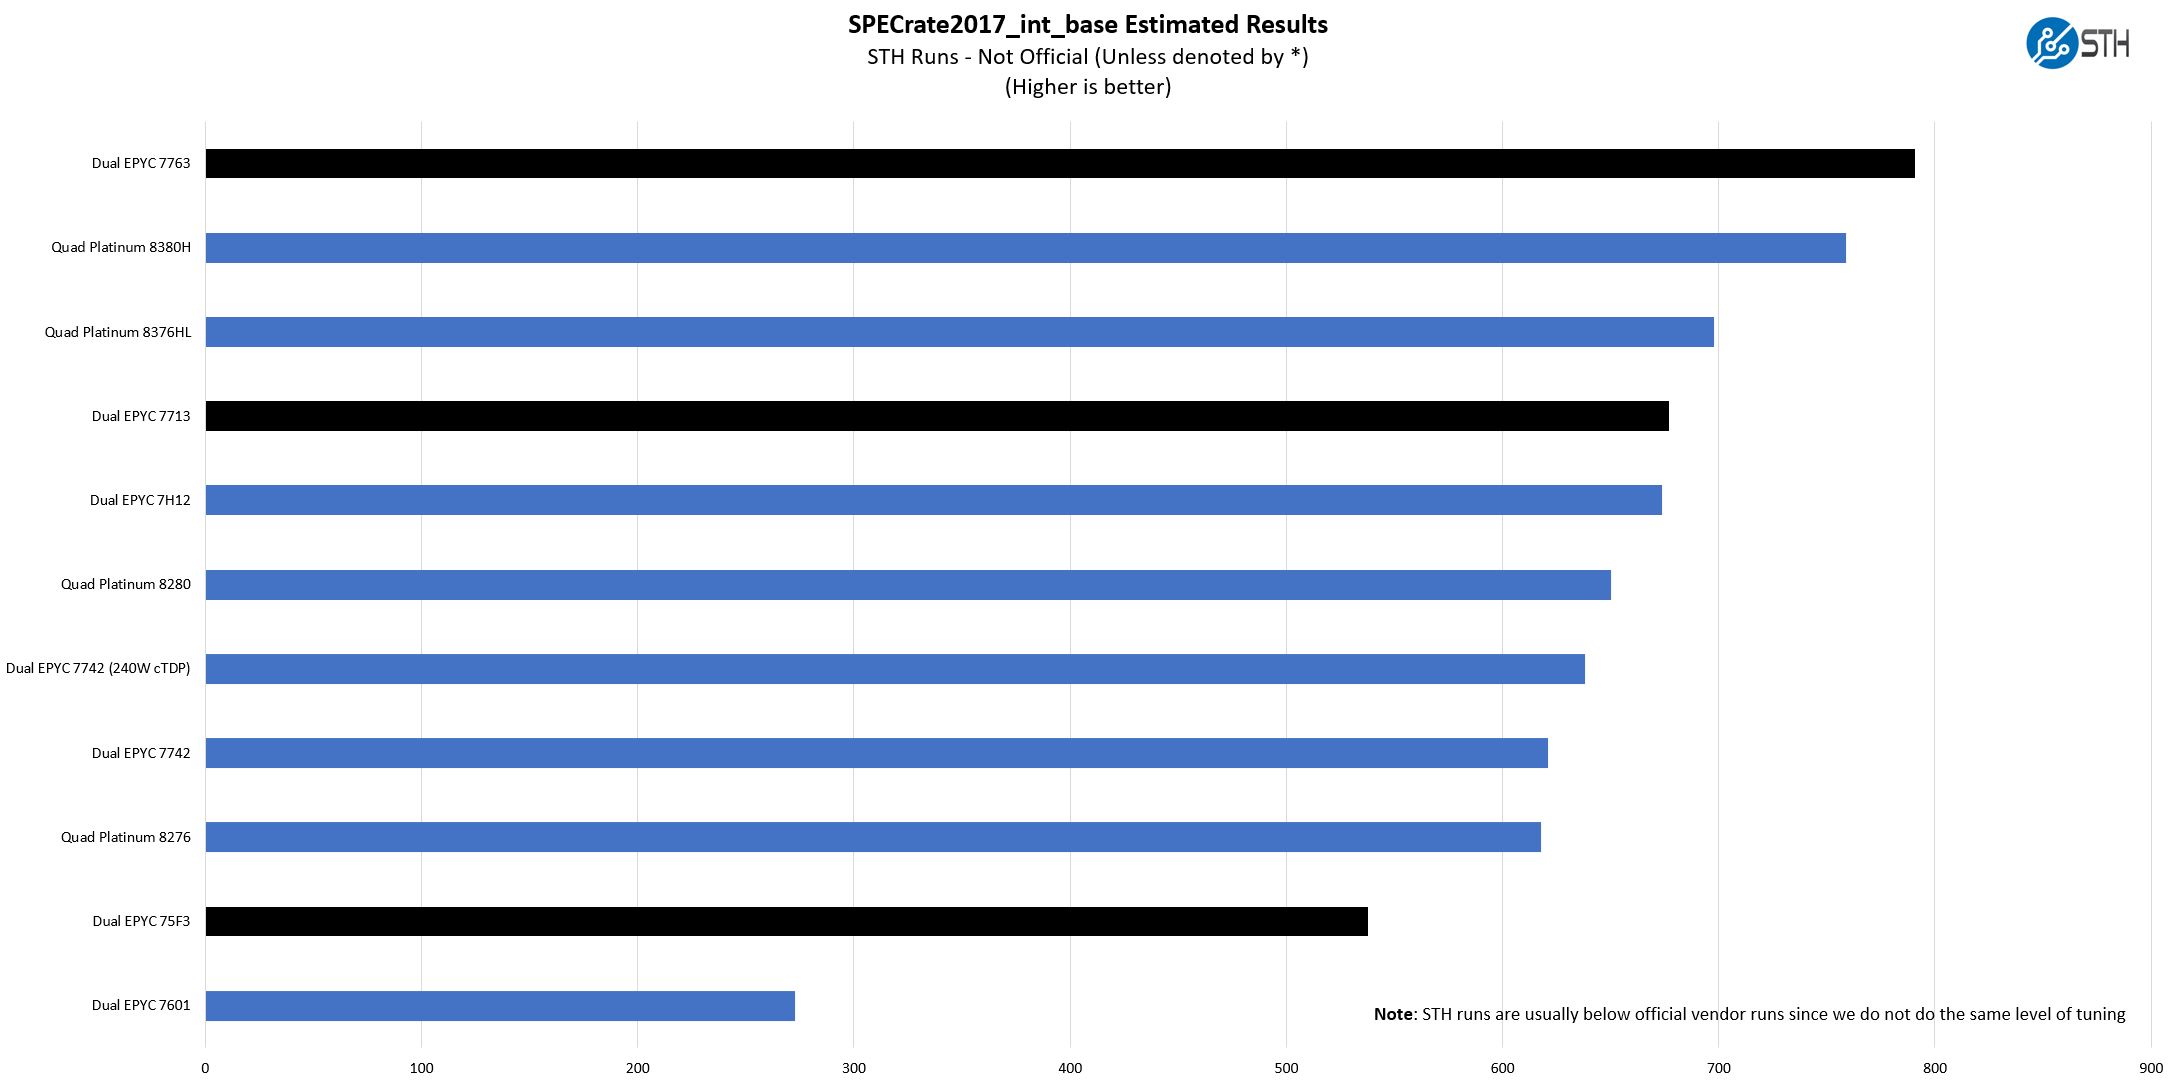
We are slightly behind AMD’s guidance here but within a few percent. Realistically, our micro-benchmark suite tests many of the same functions as we are testing here, so we see a similar ballpark of results. Perhaps the result that is most interesting is our legacy EPYC 7601 result. There may not have been a good reason to upgrade from the 2017 Intel Xeon Scalable generation to the current generation, but the gains between the EPYC 7601 and EPYC 7763 are such that one can legitimately have conversations on retiring the legacy systems and replacing them with newer larger Milan nodes.
A few quick and important notes here:
- These are not vendor official results. For official results, see the official results browser.
- We are often behind vendor results. So please look up official results, for RFP purposes. Vendors do more to get to extremely tight tunings for their official runs, so ours are comparable only to STH results, not the official data set.
Still, this should give some sense of overall performance.
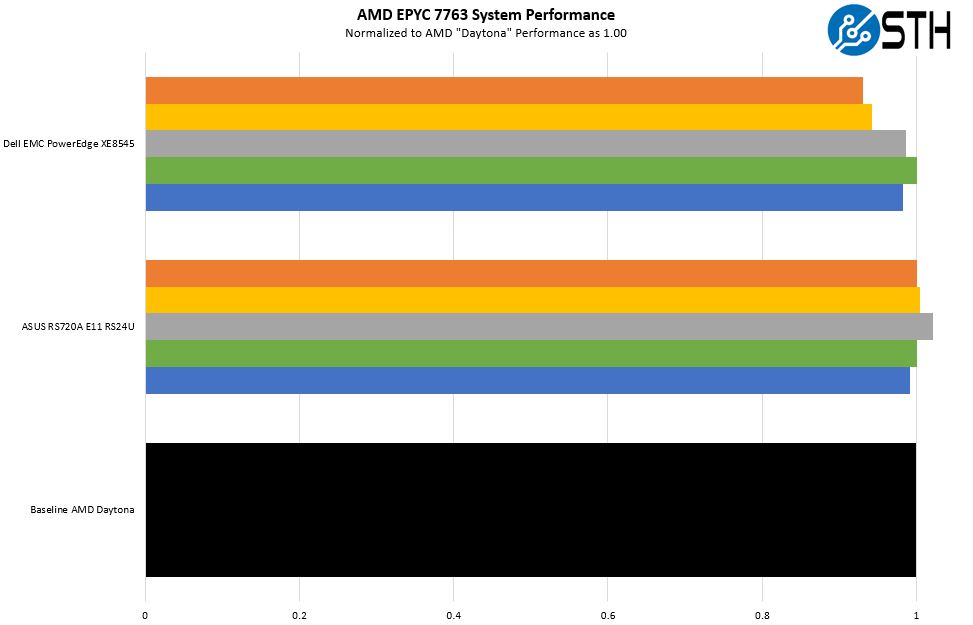
AMD EPYC 7763 280W TDP In Three Systems
Something that we wanted to try was to see what the delta was between our control AMD “Daytona” 2U server, and the ASUS and Dell servers that had over 1kW worth of accelerators along with the CPUs. As a quick note, we did not use the accelerators during this testing since we wanted as pure of CPU comparison as we could get. Still, we wanted to validate that the Daytona platform was a representative test configuration compared to what OEMs are delivering.
Here is a zoom-in view that does not use a 0 x-axis start just to show a bit more detail around the differences:
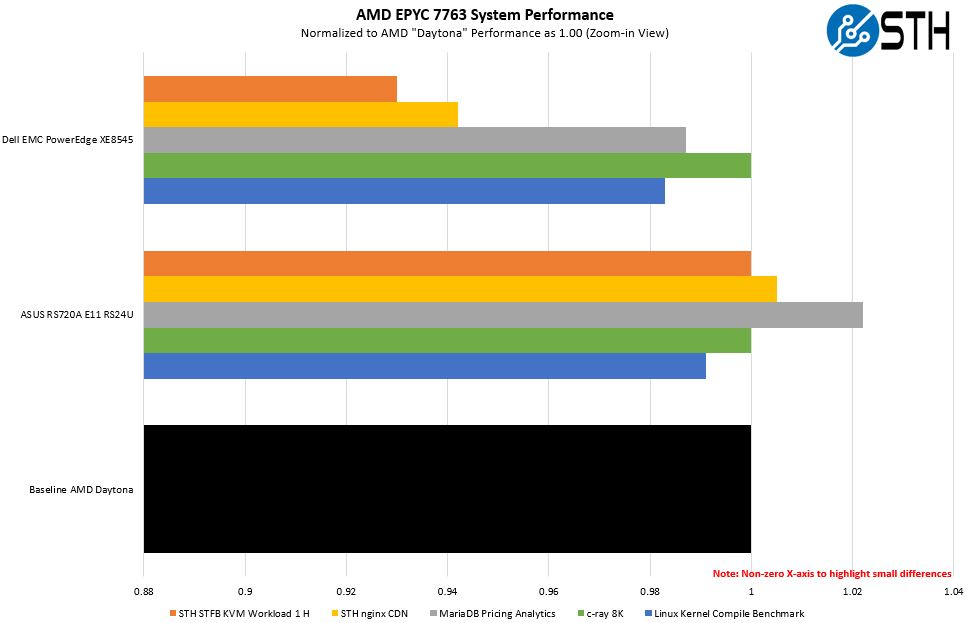
What was interesting here is that we saw the Dell EMC system had a generally lower performance. The c-ray 8K is a control test because the timing precision we expected to lead to no difference, and that is what we saw.
When we went into why the Dell EMC XE8545 had lower performance, it turns out that the answer is something that we covered, and the reason is here:
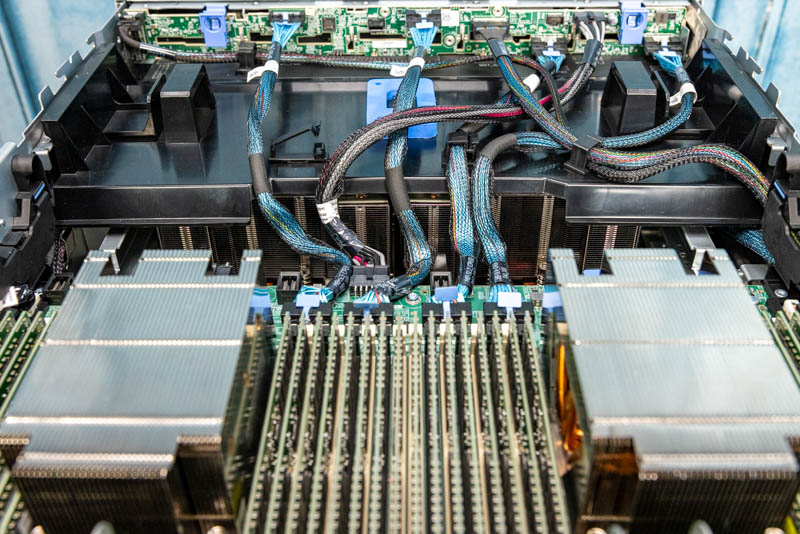
As we can see, the fourth XGMI link between sockets is being used for PCIe as it was in the Dell EMC PowerEdge R7525 Review. We covered this in Dell and AMD Showcase Future of Servers 160 PCIe Lane Design:
Theoretically, one gets 25% less bandwidth for socket-to-socket communication, but in practice, the impact is much lower. While we did see a small performance impact, this can easily be outweighed by having more PCIe Gen4 connectivity.
That brings us to an interesting observation, and one that we will discuss next, and that is in terms of the consolidation. Microbenchmarks that only test a CPU from its caches/ cores are useful, but as we have to scale problems out of a socket and then out of an individual node, the latency penalties get to be more extreme. One of the major advantages to the AMD EPYC 7763 is that by scaling up in a socket, one has more local on-socket and in-system traffic than incurring latency penalties for reaching further.
Next, we are going to get into the “so what” and discuss market positioning for the processor before giving our final words.


Please, please, please can you guys occasionally use a slightly different phrase to “ These chips are not released in a vacuum instead”.
Other than that, keep up the good work
That Dell system appears quite tasty, a nice configuration/layout design, actually surprised HPE never sent anything over for this mega-HPC roundup.
280TDP is I guess in-line with nVidia’s new power hungry GPUs, moores law is now kicking-in full-steam. Maybe a CXL style approach to CPUs could be the future, need more cores? expand away. Rather than be limited by fixed 2/4/8 proc board concepts of past.
“These chips are not released in a vacuum instead, only available to the Elon Musks of the tech world”
280W TDP is far less than NVIDIA’s GPUs. The A100 80GB SXM4 can run at 500W if the system is capable of cooling that.
“Not only does AMD have more cores than the EPYC 7763, but it has significantly more. ”
This wording seems…suspect. Perhaps substitute the word “with” in place of current “than”?
“I guess in-line with” – meaning the rise in recent power hungry tech, tongue-in-cheek ~ the A100s at full-throttle can bring a grid down if clustered-up to skynet ai levels.
@John Lee, good review, thanks! You always do good reviews. Can you look at the last sentence of the second last paragraph though? It is not clear what you are trying to say.
“Using up to 160x PCIe Gen4 lanes in a system and filling those lanes with high-end storage and networking is costly 10% lower accelerator performance can cost more than one of the CPUs which is why these higher-end CPUs will get a lot of opportunities in that space”
to Drewy:
Aren’t all chips(1) manufactured in a negative pressure environment, i.e. “clean-room” conditions acheived by removal of air and all the floaty bits in it that prejudicially unwelcome anywhere in the chip “birthing”(2) process (neo-natal facilities in hospitals actually have less stringent requirements for receiving the thumbs up (certificate of cleanliness) required prior to inviting the pregnant woman, and the “catcher” doctor/midwife.
(1) integrated circuits comprising semiconductors and thin wires etched onto silicon wafers, sealed at the factory and festooned with pins that allow communicating with the innards via all manner of electronic signalling, for disambiguation from other things we refer to as chips.
(2) we do not really mean birthing, the process by which hardware upon which artificial intelligence, whom identify by whichever pronouns they prefer, exist in a relationship to these chips that is as yet to be determined. Do AI beings exist “on top” of chips? As a consequence of threshold complexity unavoidably gives rise to consciousness as an emergent property [chicken or egg first] or is the AI ontological phenomenon entirely encompassed within software, and thus their entry into existence is prefaced by the command or perhaps as “superuser” (I would very much prefer my creator to have the title “super”, wouldn’t you?) Much like our universe was likely created in a vacuum, the silicon chips were also created in a vacuum , and finally, artificial intelligence becoming aware of itself would likely have an abrupt beginning to its own history (an infinity of nothing then “hello world!”).
I am with you in protesting this asinine assertion that creation happens in any other regime besides voids and vacuums. “In the beginning… there was sweet f[_]( I{ all NOTHING! Fortunately #nothing# was inherently unstable.
Comments are closed.