
About a month ago we published the first third-party review of the Cavium ThunderX2 piece. For those that missed our coverage, the Cavium ThunderX2 is a generally available, 64-bit Arm server CPU that is competitive with Intel Xeon Skylake-SP and AMD EPYC in terms of features and performance. You can read our review Cavium ThunderX2 Review and Benchmarks a Real Arm Server Option where we go in-depth into the performance of the chips as well as the bigger ecosystem and usability aspects of going Arm. Many of our readers noted that we punted a bit on our power consumption figures. We are now ready to share more about what was going on, and Cavium ThunderX2 power consumption data.
Gigabyte R281-T90 “Sabre” Test Platform Mysteries
In our initial review, we noted that the Gigabyte Sabre test platform was giving us power numbers that seemed out of place:
Our Gigabyte/ Cavium ThunderX2 Sabre development platform hit a peak of 823W at 100% load. We think that there are likely optimizations that can occur at the system’s firmware level, and by using GA power binned chips. At first, we thought that these numbers were way out of line so we discussed them with Cavium and that is when we were told that the ~800W range was correct for our system and pre-production chips. The company also told us that the production systems will have firmware that is better power optimized. As a result, we are not going to publish a direct comparison until we can get a mature Cavium ThunderX2 platform with production chips and system firmware. This may take some time, but publishing a comparison using the Sabre platform and the unbinned silicon is disingenuous.
We knew something was “still in development” because we could hear and feel the server in our racks. The rack the test platform was installed in had a blade chassis with 12kW of PSUs installed and DeepLearning11 a 10x GPU and dual Intel Xeon deep learning server capable of sustaining over 4kW of power consumption. The ThunderX2 platform is just above the Gigabyte R281-G30 Versatile Compute Platform we reviewed based on a similar layout and chassis design. All three of those systems were pushing significantly less air per U of rack space than the development box.
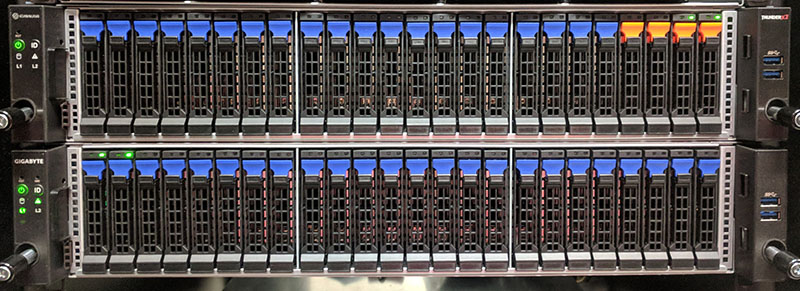
It turns out that our airflow perception was correct. The fans were spinning, consistently, at well over 15,000 rpm. We knew from the Intel Xeon Skylake-SP based Gigabyte server racked just above that the fan speeds were significantly higher than our expectations. Something was not right.
We brought our findings to Cavium and were told that the Sabre platform we are using did not have a production firmware. The focus of the Sabre platform was to get a functional platform using the new architecture. That makes sense, but it meant that normal power optimization steps had not taken place. We finally received an updated firmware and a higher firmware revision and got set to testing.
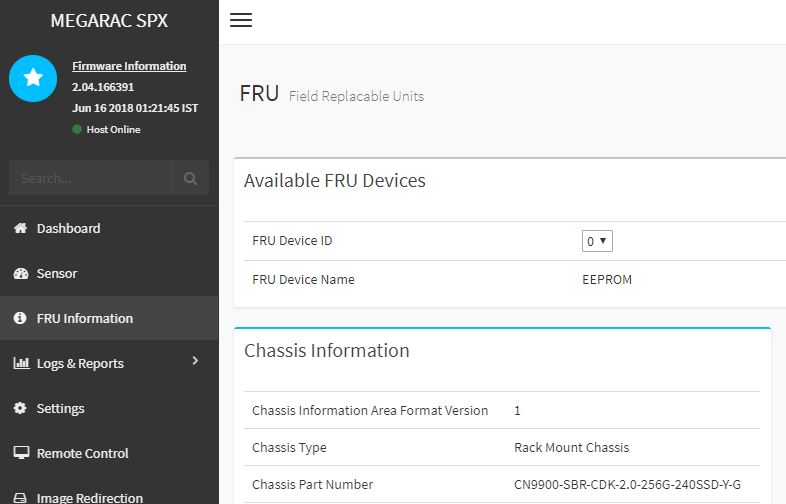
After a full power off, we fired up the system to get some power figures.


Not bad at all! BTW, you a bit over-estimate with “Assuming the production chips are binned for power and Cavium sees 30-40W lower power consumption in a dual socket server from that exercise, we arrive at a fairly simple conclusion. ” — especially when you mention at the beginning of article that Cavium itself expects just modest decrease of over 10W per chip. Honestly if it would be 30-40, then they would mention directly over 30W, don’t you think?
But anyway, 550W is still better than nearly 900W.
Very nice to see that they have fixed the power draw by that much without any performance difference.
Seems like it can be a really good deal given the price.
AMD seems to be the most likely to suffer from it as people susceptible to jump from Intel to AMD are more like to jump to Cavium entirely. Let’s see how AMD adjusts its prices.
@karelG Greater than 10W per CPU (I have been told that it may be on the order of 15W each). Then add in additional savings from cooling and that is how I got to the 30-50 range. It may well be closer to 30W and hope to get some production silicon to do more analysis with.
When you say that the systems are running at “100% load” what workload or combination of workloads do you run to get them to the “100%” mark?
@Ziple: with jump to Cavium you need to be sure, your stack is ARMv8/64 ready while on the other hand with jump to AMD, you just need to adjust a bit for example AVX2 if you are using them. Nothing more, same arch.
So IMHO Cavium is in more risky position than AMD.
@Patrick: well, let’s see when production silicon is available. IMHO Intel and general market needs it as a salt to have after years again competing architecture. POWER9 is nice, but it’s too little…
This kind of means that China doesn’t need intel (USA) anymore to enhance their supercomputer power.
Just buy an ARM license some machinery from ASML and your done, they have the money and the engineering power.
What you present here is not a useful story. Administrators need to know the productivity/watt, e.g. jobs/sec/watt, or jobs-completed/watt-sec. Energy is the story. How much energy is consumed for the system to complete a given workload?
Reporting power at “100% load” is useless. Rather report power and report the benchmark results. e.g. X ops/sec and 100W becomes X/100 ops/watt-sec, or convert to X/100 ops/kilowatt-hour.
Now you have energy.
Please, do you job here!
And to clarify, there is no reason to “equalize the configurations”. What you strive to do is obtain a configuration yielding best performance and lowest power. Clearly there is room for trial and error. e.g. adding more DIMMs might push the power up more than the benchmark results, so take them out again.
->DON’T equalize the configuration.
->DO obtain the best performance and measure and report benchmark and power for that run.
Now anyone can decide if they are getting the most jobs completed per kilowatt-hour of energy use.
I feel compelled to further add that *no particular benchmark performance level is required*. To obtain the most efficient jobs/kilowatt-hour, that actual performance can be anything. For example, if you yank the CPU out of your electric toothbrush, it may consume micro-watts, and take a week to run the benchmark, but calculate the jobs/kilowatt-hour, and hey it is the highest!!
There is no a-priori requirement to have a good benchmark time, *rather* a given usage model decides if the delivered performance is within an acceptable range or not.
If the application is being sent to Mars, then taking a week to run the benchmark job may be just fine! And it has the most optimal jobs/kilowatt-hour – the winner!
The tuning of the configuration is clearly a search through a large dimensional space. Vary every parameter, measure the benchmark, measure the power, and keep seeking that best ratio!
The minimal config may win. The maximal config may win. Any config change that reduces power is worth a try! Any config change that boosts the benchmark speed is worth a try. And you may still not find the best one.
I won’t normally comment on articles other than to say we run well over 10,000 nodes in our facilities. We have HPC, virtualization, analytics, VDI you name it. Bullshit on all that matters is watts/ work Rich. If we don’t have enough RAM in nodes, then we’re doing expensive calls to slower memory. That means we can’t use them with less RAM. It isn’t every workload but if you’re not starting from the same base configuration then it’s not a useful comparison. I don’t mean to sound crass here but the reality of modern data centers is that machines are not running one application and running one workload. They’re running many applications and it changes all the time. Hell, you’re talking 4 DIMMs in a system? Everything else like the network and storage needs to be the same since they’re external devices. It isn’t hard to reduce the numbers by 20 watts or whatever for all four DIMMs if you want to come at a conclusion.
Oh, and let’s not forget, the obvious here: everyone who does data center planning needs to know how much nominal power nodes use. You have rack, aisle, room, facility level power and cooling budgets so knowing how much a node uses is really useful.
Great job STH team on these articles. We are looking at getting a TX2 quad node system for evaluation based on your reviews but you’ve provided a lot of great info.
I agree with John W. You did a good job of equalizing the platforms but there are differences. Like the Intel PCH is not the same as you’ll find on AMD or Cavium. That PCH is there and a fact of the system, but it’s using power. I can see both arguments on both RAM quantities for the Skylake but I’d do what you did and equalize the RAM. Otherwise, you’re showing the RAM power differences.
Thumbs up to John W!
Another interesting fact, both AMD EPYC and Marvell ThunderX2 are still on GF 14nm. This makes them one node behind Intel. I wasn’t convinced about the Qualcomm Server solution, but ThunderX2 surely looks like a win.
Cant wait to see some more test once we have post production firmware and final binned CPU. Along with better Compiler.
Comments are closed.