Supermicro SYS-112D-36C-FN3P Performance
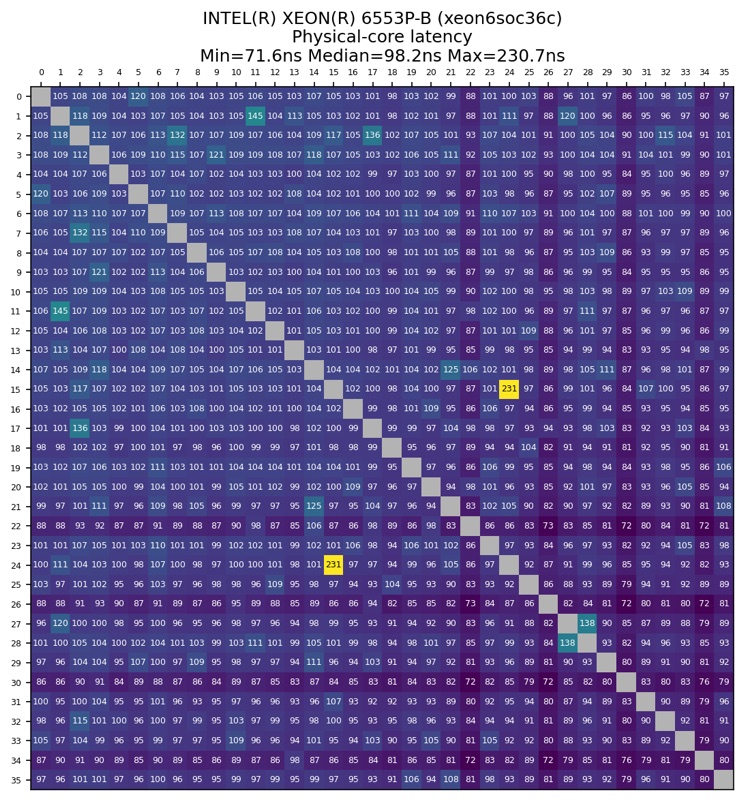
For CPU topology, the 36-core Xeon 6 SoC gives us a different core count than the 40-core model we saw in Supermicro’s other server, but it is otherwise the same basic core generation. Core-to-core latency is one of the first checks because it helps show how threads communicate across the SoC.
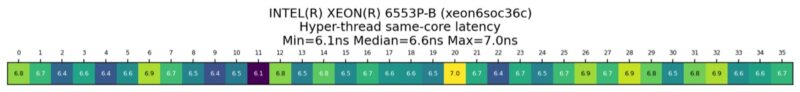
Same-core SMT latency gives another view of the platform. Together with the physical-core chart, it is useful when thinking about workload placement and thread pinning.
Next, let us get to the Geekbench results.
Geekbench Results
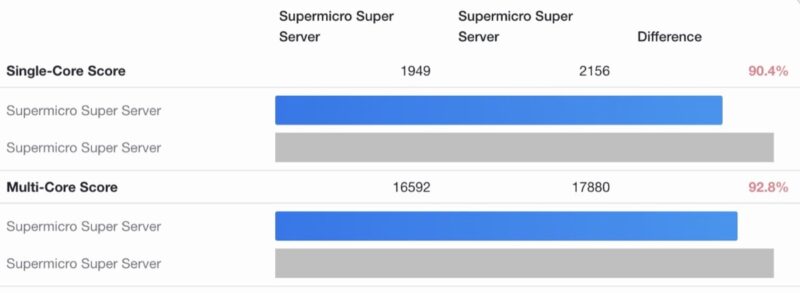
Geekbench 6 gives us a quick comparison between the 36-core Xeon 6 6553P-B SoC and the 40-core 6716P-B baseline from the earlier SYS-112D-40C-FN8P review. The 36-core part tracks the 40-core part closely in places where per-core behavior matters, while multi-threaded results reflect the smaller core count.
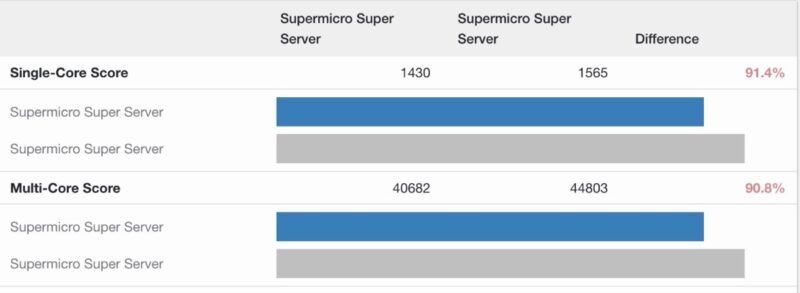
Geekbench 5 shows a similar comparison.
This is not the main benchmark story for a platform like this, but it is useful as a familiar reference point before moving into the AgentSTH data.
AgentSTH V5 Results Preview
In the 40C review, we previewed AgentSTH V5 using charts that compare this 36-core Xeon 6553P-B platform against the 40-core Xeon 6716P-B platform. That data belongs here as well because it is one of the main performance comparisons between the two systems.
AgentSTH is focused on CPU-based agentic workloads, not LLM inference on GPUs. Many agentic systems spend a lot of time on tasks such as parsing, compression, coordination, queues, hashing, and state handling, so the CPU side still matters.
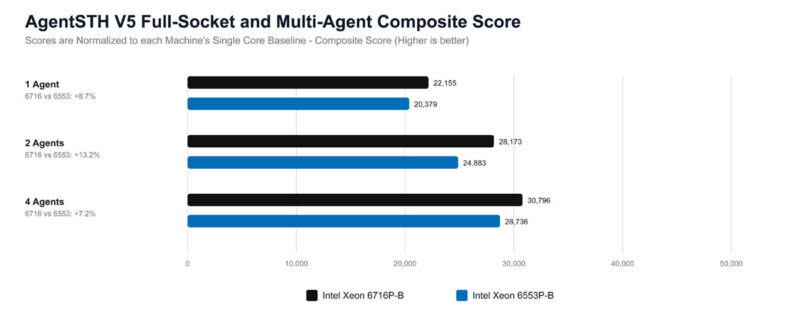
The high-level lesson from the full socket chart is that running multiple agents can use the CPU more effectively than one large job that waits on a single slower path. That is why the multi-agent view is important for modern servers.
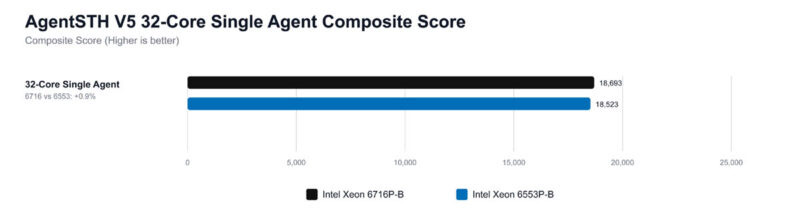
With AgentSTH running across 32 cores, the 36-core and 40-core systems are close in many parts of the suite because they use the same core generation. That makes this view useful because it removes some of the obvious core-count difference. 32-cores is just one shape we are testing for these workloads.
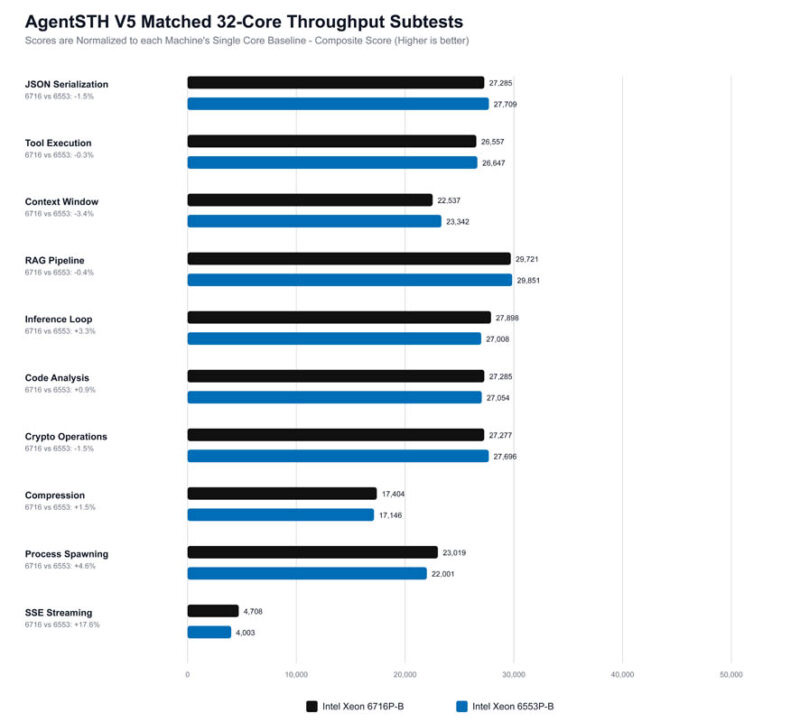
The throughput subtests show that the differences are not simply a matter of one model always winning. Once the benchmark is held to the same 32-core scale, cache behavior, clock behavior, and the subtest mix can change the result.
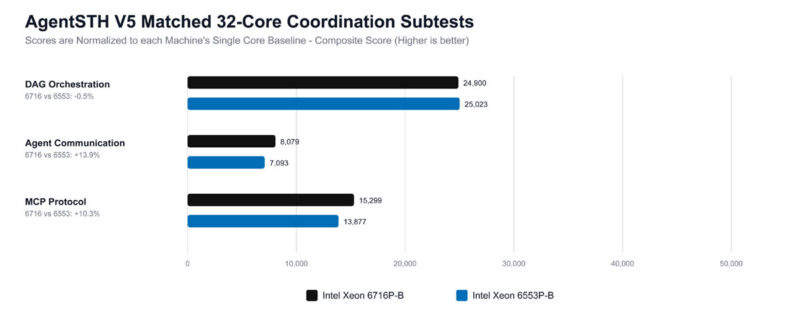
Coordination tasks are where the platform differences become more interesting. The Xeon 6716P-B can do better when threads repeatedly revisit related state, which helps keep metadata hot.
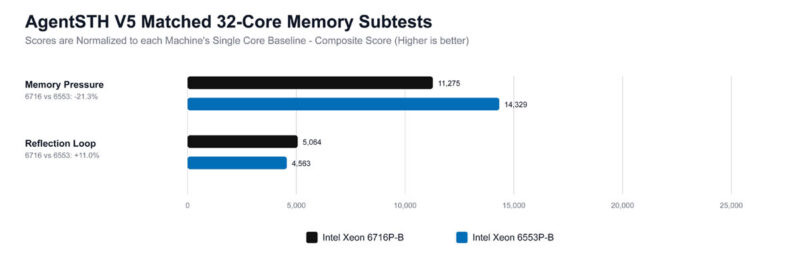
When the workload becomes more diverse due to allocator and hash-table churn, the Xeon 6553P-B platform can still look stronger in this V5 data. This underscores how the difference between the two Supermicro servers is more than just CPU core counts. It is not just a lower-core version of the 40-core system.
We should probably note that we are now on AgentSTH V7, having refined the benchmark set a bit after Ubuntu 26.04 LTS was released. Still, we wanted to maintain parity with the previous server review.
Next, let us get to the power consumption.


Please can you post the graphs in a lossless format – the compression makes some of the headings hard to read