
MSI XpertStation WS300 NVIDIA Grace Performance
Since we recently did a relatively big deep-dive into the NVIDIA DGX Station performance, we wanted to show some similar numbers so you can compare reviews, but also show a few new looks at performance to keep things fresh. In the MSI WS300, we get an NVIDIA Grace CPU running with a 300W TDP. First, we wanted to see how the 72-core Arm Neoverse-V2-based CPU fares, so let us start with the core-to-core latency.
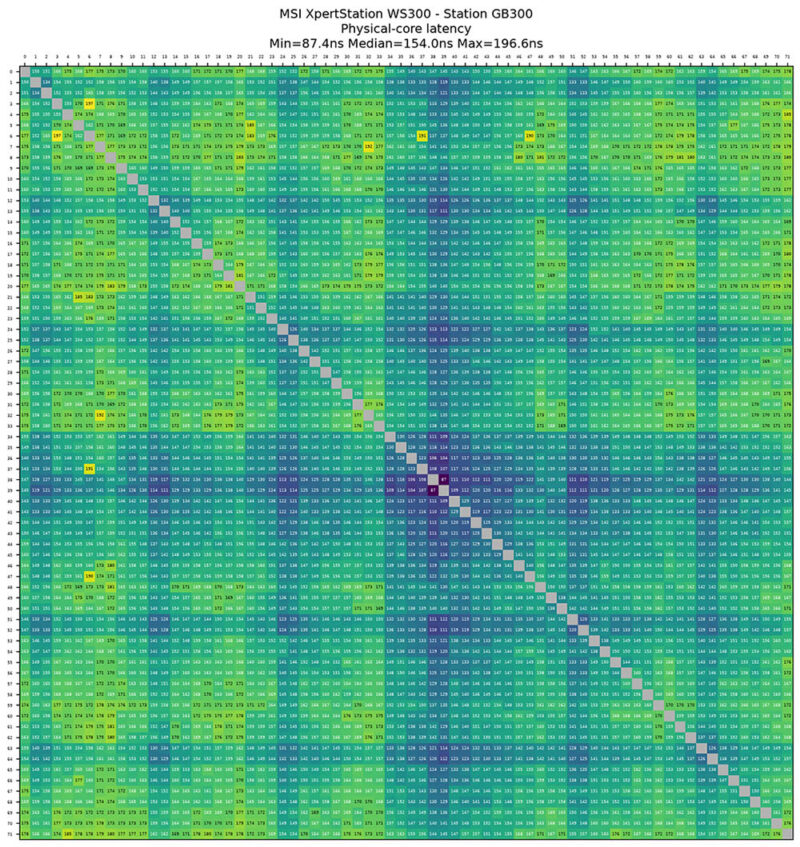
The Grace CPU is a monolithic die, so we get a fairly predictable pattern. These charts, even at 72 cores, are getting enormous. Now imagine dual 256-core parts, which we will see in 2026, which is why we will change the visualization. We already have other interesting ones, from Vera servers to new x86 CPUs, that we have not shown yet, but the topologies are getting very large.
We also ran lmbench on the chip for those who like seeing those charts:
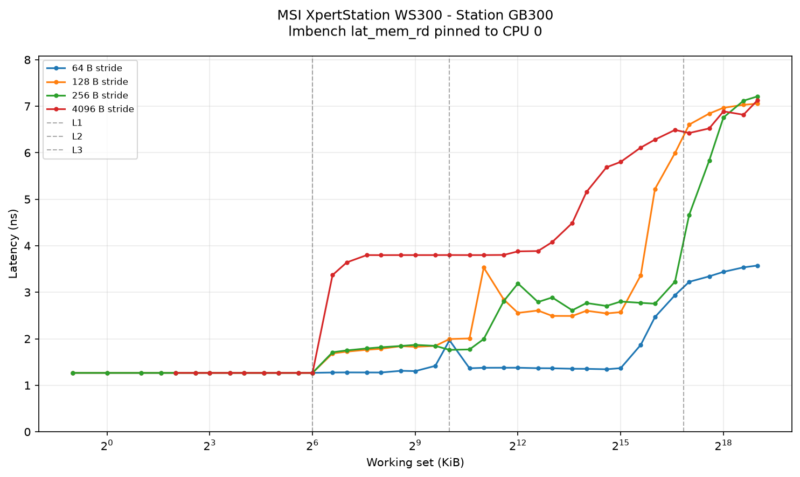
Again, this is what we are accustomed to seeing for the platform. From what we have seen, these NVIDIA DGX Station GB300 platforms stay relatively close.
MSI WS300 AgentSTH V7 Performance
NVIDIA’s flagship agentic AI CPU is soon to be the NVIDIA Vera, but for NVIDIA Grace we still get very good performance. Let us start with some of the per-core performance of workstation CPUs.
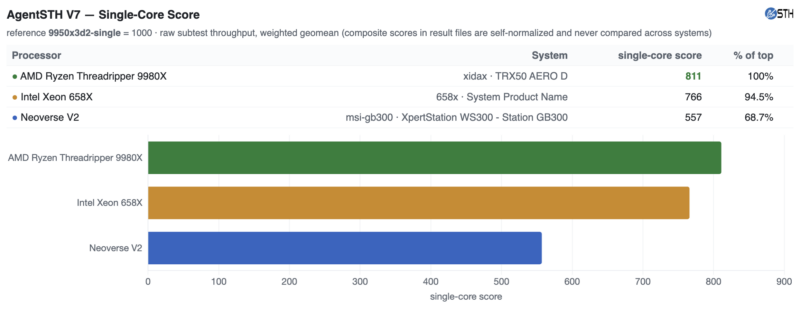
One of the major challenges with this comparison is that the Grace portion of the system is running at a 300W power limit. That is somewhere in the range of the Intel Xeon 658X (250W, 300W turbo) at 24 cores, and is a bit less than a 64 core/ 128 thread AMD Ryzen Threadripper 9980X. We wanted to see what the performance per core would be of a 72-core design against some workstation chips. These are not the perfect comparison points, but they are at least useful in this generation. SMT helps on a number of tasks (but not all), so the x86 processors do well when we look at single-core performance.
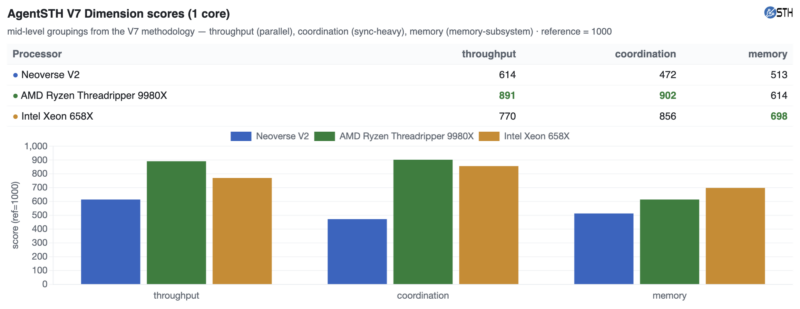
Overall, the Neoverse V2 is not clocked as high, so the pure single-core comparisons tend to sway a bit more towards the higher-clocked x86 CPUs performing better. That is why we will bring in an AMD EPYC 8000 series part later. Still, the single-core performance is not bad at all, and certainly in the ballpark of the others.
72 cores is a lot, and more than most agentic AI workloads will use. Usually, larger AI shops tell us they target 2-4 cores for AI agents, so the Grace CPU’s architecture scales very well. Here is what that typical 2-4 core range looks like, but expanded to 1-32 cores and how the scaling happens even in those common bands across the chips.
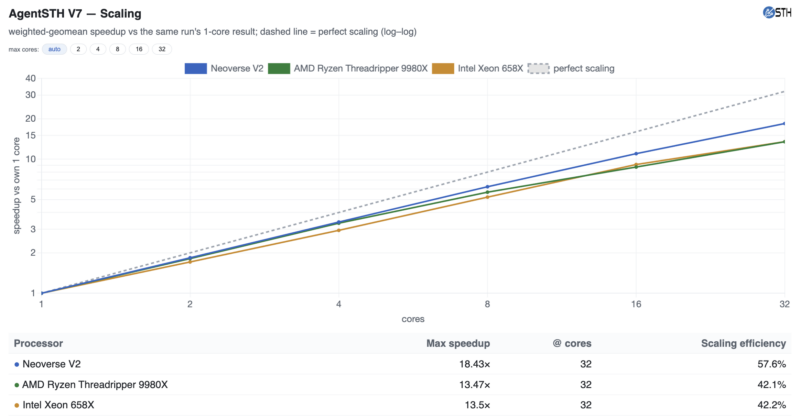
What you can see here is that the NVIDIA Grace Neoverse V2 cores are out-scaling the AMD and Intel chips in this test. That is part of the design since we do not have chiplets like on the Threadripper (you can see the boundary get crossed in the data) and there is no SMT.
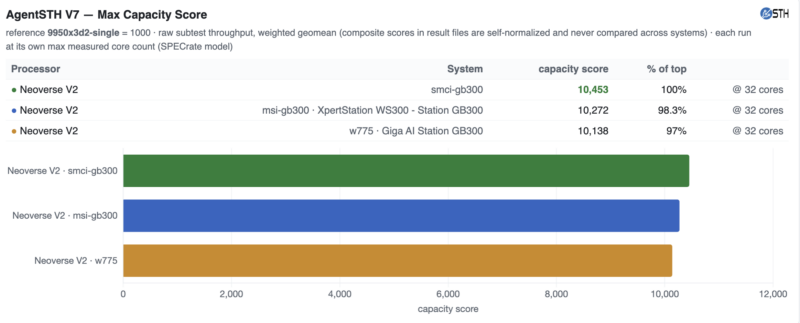
Scaling this out, we also wanted to see how this compares to the other NVIDIA DGX Station units that we have been testing. MSI’s system is dead in the center at the 32-core AgentSTH V7 run, and in our testing, generally the three systems we had are +/- 2%.
MSI WS300 Estimated SPEC CPU2026 -O3 Performance
Given that these are designs that have been on the market for some time, you can look up many of the standard benchmarks which are highly optimized. Vendors are very good at optimizing compiler flags and systems for the official SPEC CPU runs. At the same time, we wanted to offer a different view, getting to a lower optimization point using an -O3 flag instead. Our goal is really to create something that is different from the official results, removing many of the common optimizations. Starting with the SPEC CPU 2026 integer rate base estimated result, here is what we saw:
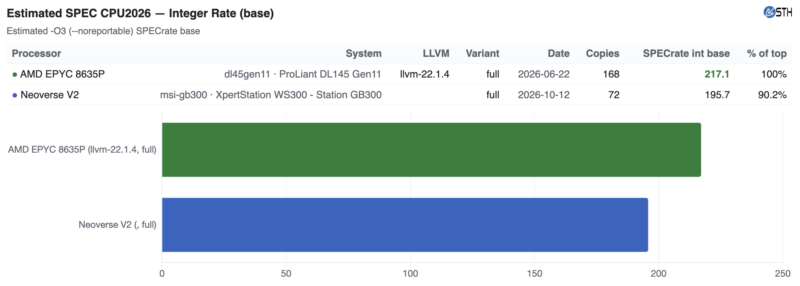
We are using the AMD EPYC 8635P here despite its lower TDP just to get something a bit closer to the spirit of what the NVIDIA Grace CPU was designed for. It is lower TDP, but an 84 core/ 168 thread part so its integer rate is great. Swapping to the floating-point side, here is what we saw:
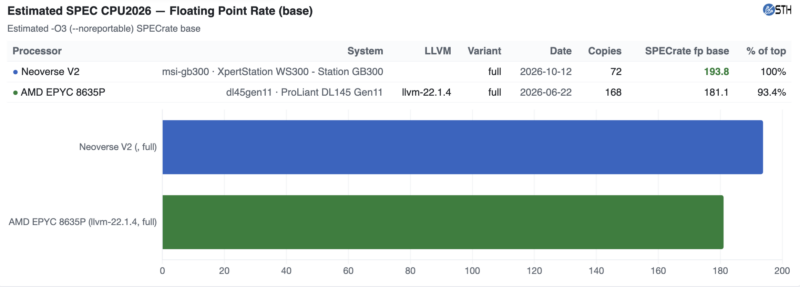
NVIDIA does well, really well, here, partly due to the memory hierarchy. That is part of the reason we picked this comparison point, since this is one where AMD’s Zen 5 cores and the Arm Neoverse-V2 CPU trade places in the integer and floating-point tests.
On that note, let us get to the GPU.