Intel Xeon W-1290P Benchmarks
For this exercise, we are using our legacy Linux-Bench scripts which help us see cross-platform “least common denominator” results we have been using for years as well as several results from our updated Linux-Bench2 scripts. At this point, our benchmarking sessions take days to run and we are generating well over a thousand data points. We are also running workloads for software companies that want to see how their software works on the latest hardware. As a result, this is a small sample of the data we are collecting and can share publicly. Our position is always that we are happy to provide some free data but we also have services to let companies run their own workloads in our lab, such as with our DemoEval service. What we do provide is an extremely controlled environment where we know every step is exactly the same and each run is done in a real-world data center, not a test bench.
We are going to show off a few results and highlight several interesting data points in this article.
Python Linux 4.4.2 Kernel Compile Benchmark
This is one of the most requested benchmarks for STH over the past few years. The task was simple, we have a standard configuration file, the Linux 4.4.2 kernel from kernel.org, and make the standard auto-generated configuration utilizing every thread in the system. We are expressing results in terms of compiles per hour to make the results easier to read:
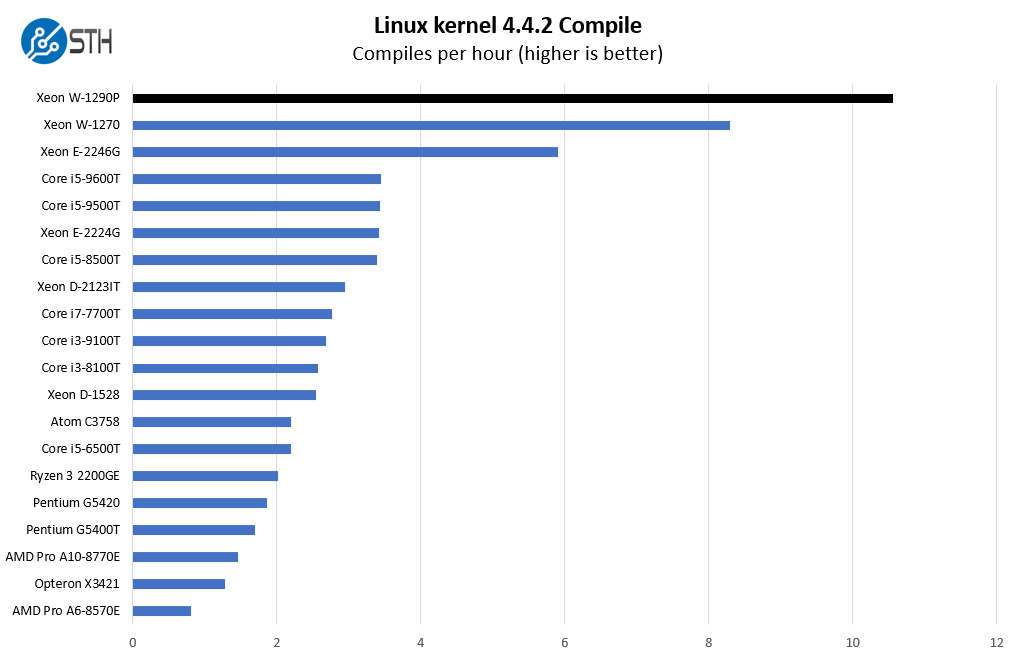
Since we are doing a lot with our Project TinyMiniMicro with 35W desktop PCs, we wanted to show this view. For a company looking to upgrade a user’s desktop from a standard 1L PC to a higher-end Xeon W offering, this is not a simple core count upgrade. Power matters and we are around a 3x performance increase over a Core i5-9600T as we saw in our recent Lenovo ThinkCentre M920 and M920q Tiny Guide and Review.
c-ray 1.1 Performance
We have been using c-ray for our performance testing for years now. It is a ray tracing benchmark that is extremely popular to show differences in processors under multi-threaded workloads. We are going to use our 8K results which work well at this end of the performance spectrum.
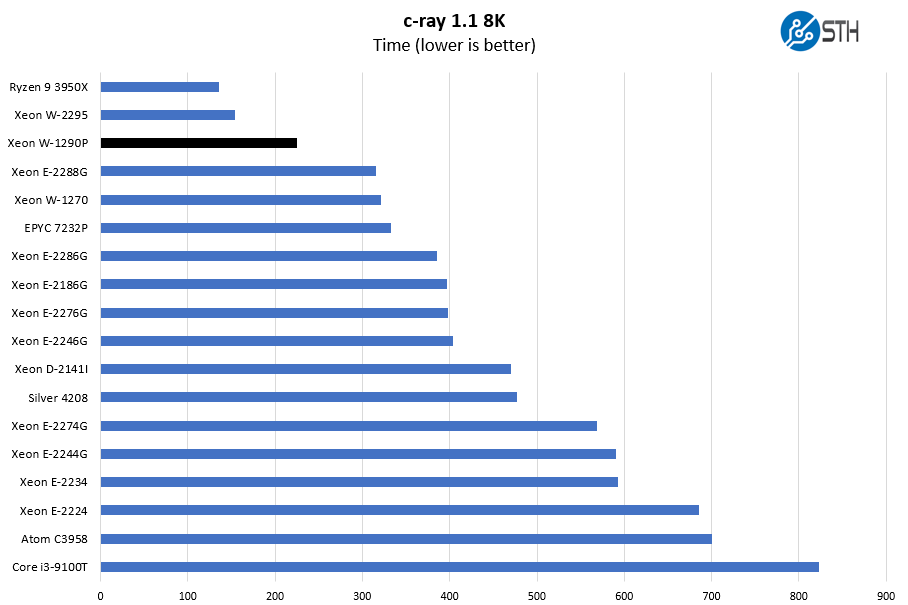
There are architectural differences that come into play on AMD v. Intel. Here we see the AMD EPYC 7232P 8-core part and the AMD Ryzen 9 3950X 16-core part book-end the performance of the Xeon W-1290P. While many may point to the Ryzen being faster here, despite this being a very AMD architecture-friendly workload, one must also remember that the Ryzen 9 is more expensive so we would expect it has better performance.
7-zip Compression Performance
7-zip is a widely used compression/ decompression program that works cross-platform. We started using the program during our early days with Windows testing. It is now part of Linux-Bench.
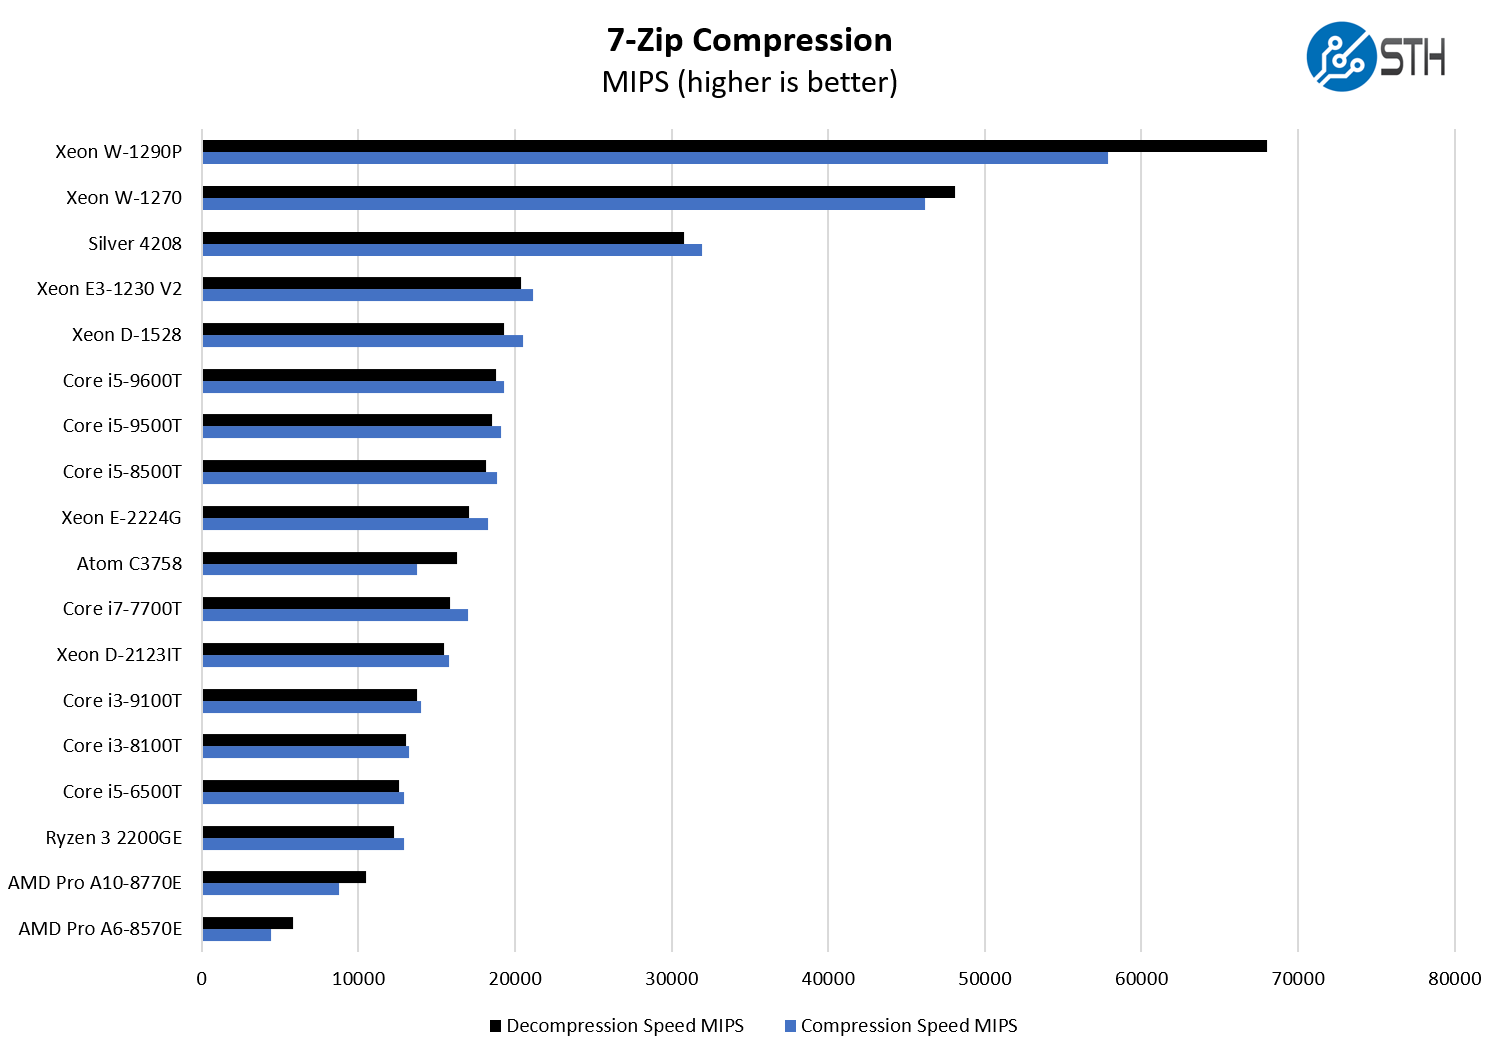
Here we simply wanted to point out the massive difference between this chip and the Xeon E3 series. Although we only get 2.5x the number of cores, we are seeing the performance in the 3-3.5x range in terms of performance due to higher clock speeds than the Xeon E3-1200 V2 series. This is a big departure from previous generations.
NAMD Performance
NAMD is a molecular modeling benchmark developed by the Theoretical and Computational Biophysics Group in the Beckman Institute for Advanced Science and Technology at the University of Illinois at Urbana-Champaign. More information on the benchmark can be found here. We are going to augment this with GROMACS in the next-generation Linux-Bench in the near future. With GROMACS we have been working hard to support Intel’s Skylake AVX-512 and AVX2 supporting AMD Zen architecture. Here are the comparison results for the legacy data set:
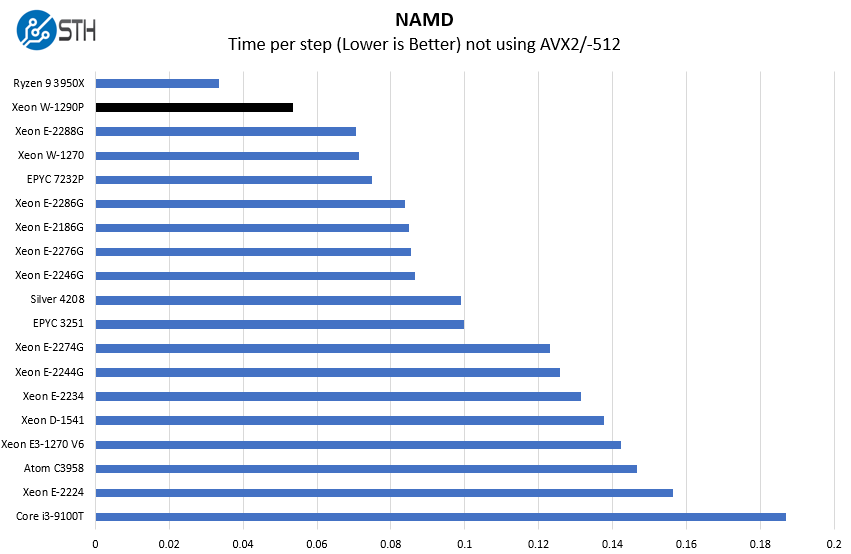
This is a good example of where we can see the TDP performance delta at play. Both the Xeon E-2288G and the Xeon W-1270 are 8 core parts, but we can see a much larger gap between those parts and the Xeon W-1290P versus their gap with the Intel Xeon E-2286G. This is a great way to see the TDP plus core benefit of the newer “P” series parts.
Sysbench CPU test
Sysbench is another one of those widely used Linux benchmarks. We specifically are using the CPU test, not the OLTP test that we use for some storage testing.
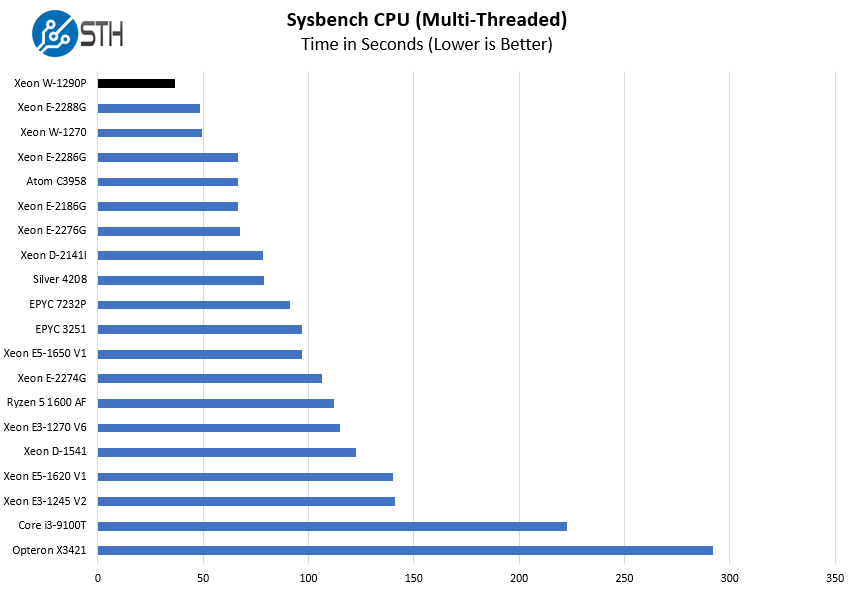
There is fairly intense competition at the lower-TDP levels. We can see a large number of SKUs in the 4-8 core range with similar performance. Here we see even the Intel Xeon Silver 4208 is nowhere near as fast as the Xeon W-1290P due to the Xeon W’s higher core count and clock speeds.
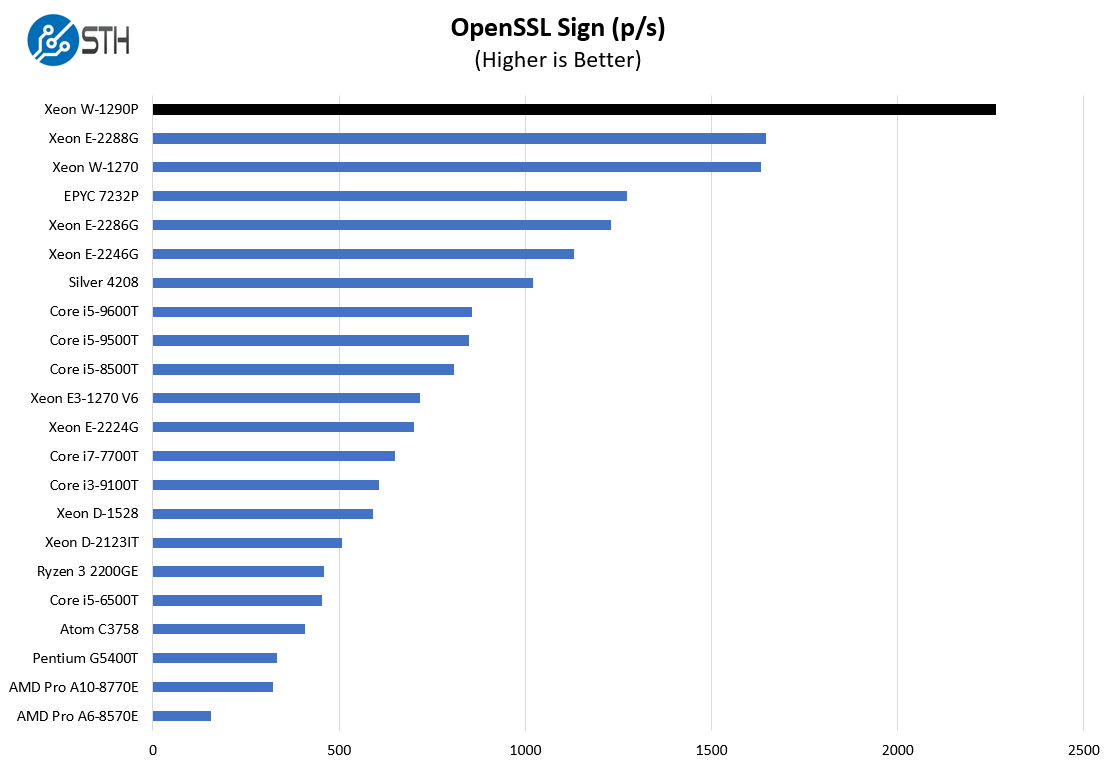
OpenSSL Performance
OpenSSL is widely used to secure communications between servers. This is an important protocol in many server stacks. We first look at our sign tests:
Here are the verify results:
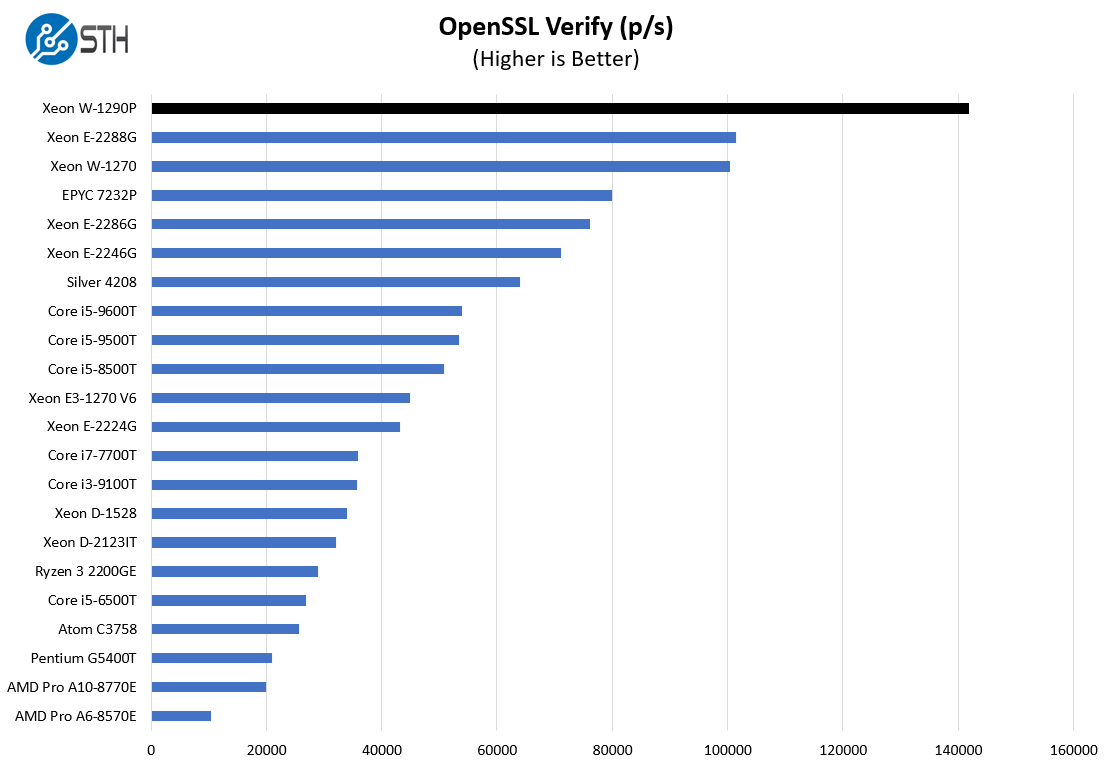
These results also show the huge delta between the Xeon W-1290P and the Xeon W-1270. Frankly, after our recent Intel Xeon W-1270 Benchmarks and Review piece, we thought that the chips would be close here. Instead, there is a massive delta which is partly due to the TDP increase as well. Both chips were tested back-to-back in the Supermicro platform so we had a very stable testbed for generating these results.
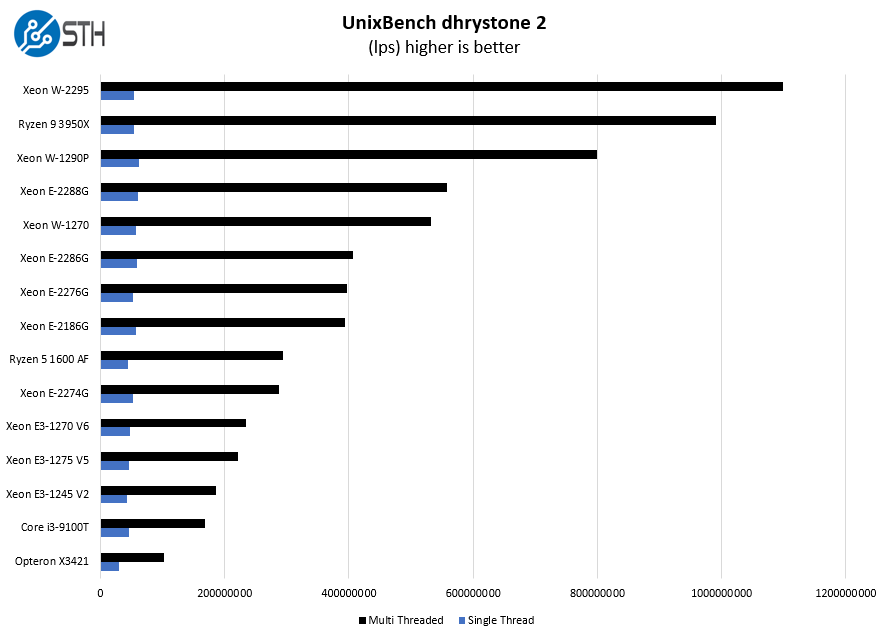
UnixBench Dhrystone 2 and Whetstone Benchmarks
Some of the longest-running tests at STH are the venerable UnixBench 5.1.3 Dhrystone 2 and Whetstone results. They are certainly aging, however, we constantly get requests for them, and many angry notes when we leave them out. UnixBench is widely used so we are including it in this data set. Here are the Dhrystone 2 results:
Here are the whetstone results:
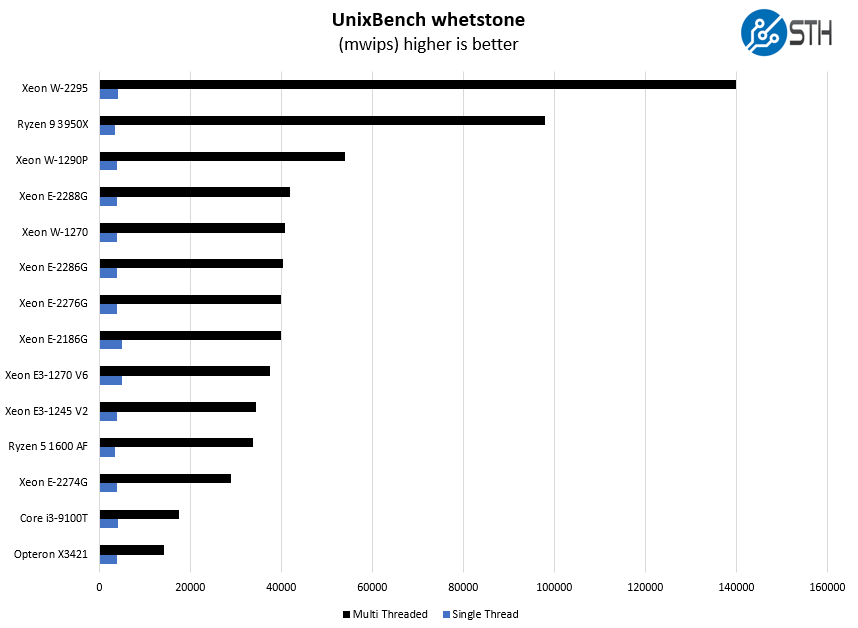
The Intel Xeon W-1200 line has the Xeon W-1290P as its top-end SKU, but it is not the fastest in the Xeon W stable. Here we are showing the Intel Xeon W-2295. That is a significantly higher-end CPU with a much larger platform as well. Likewise, there is the Intel Xeon W-3275 we reviewed with 28 cores. That also uses yet another and much larger still platform. In a way, the Xeon W-1290P is the top-end of the low-end of Intel’s Xeon W lines.
GROMACS STH Small AVX2/ AVX-512 Enabled
We have a small GROMACS molecule simulation we previewed in the first AMD EPYC 7601 Linux benchmarks piece. In Linux-Bench2 we are using a “small” test for single and dual-socket capable machines. Our medium test is more appropriate for higher-end dual and quad-socket machines. Our GROMACS test will use the AVX-512 and AVX2 extensions if available.
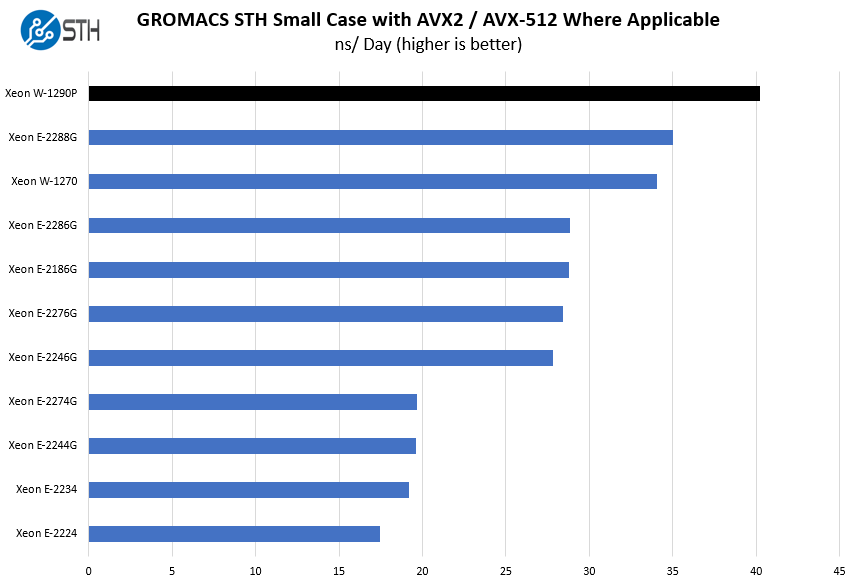
This test tends to be notoriously TDP limited. On some of the larger Xeon CPUs we can see CPUs with the same TDP and different core counts perform relatively similarly here simply due to TDP limitations with AVX(-512.) Here, we can see that the extra TDP is really helping the W-1290P.
Chess Benchmarking
Chess is an interesting use case since it has almost unlimited complexity. Over the years, we have received a number of requests to bring back chess benchmarking. We have been profiling systems and are ready to start sharing results:
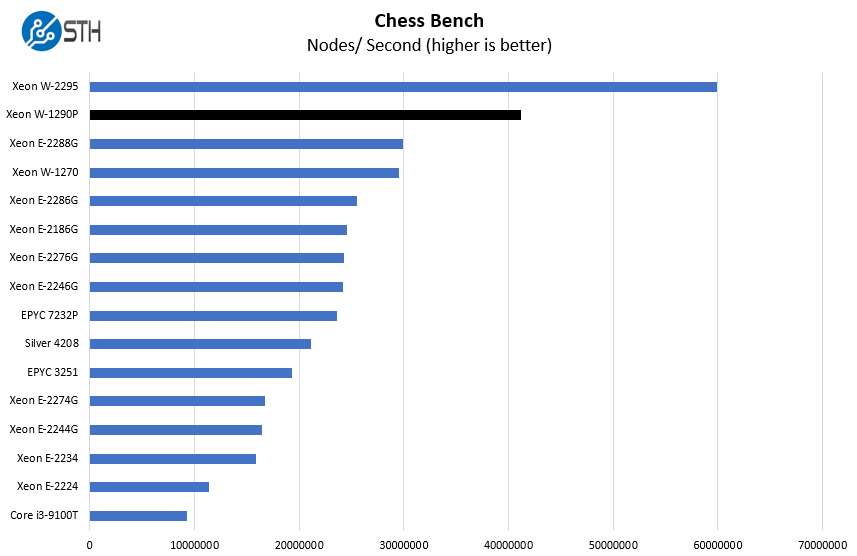
Here we have a comparison that includes the Xeon W-2295, the Xeon W-1270, and several of the SKUs from the Xeon E-2200 series just to show the family and generational scaling across the different lines.
Next, we are going to have power consumption, market positioning, and our final words.


…so, it’s kind a ‘deja vu’ e5-1650v2 with gimped pcie lines and memory channels :-)
Don’t see a point of multi-thread comparison of cpu’s with different core count.
What would be more interesting (for me at least):
1) Relative single-core performance at the same frequency (3GHz for example).
I know it’s pretty hard to do with server mainboards, but if possible, i’d like to know how much faster 1 core of w-1290p compared to e-2288g at the same conventional 3ghz.
2) Absolute single-core performance at cpu’s max turbo boost. (when all other cores idle).
3) Full-load single-core performance (all cores at 100% load). And what is the cpu frequency in this situation.
Of course 10-core w-1290p is overall faster in multi-thread than 8-core e-2288g, and of course 18-core w-2295 is even “faster”. In quotes because each of the w-2295 cores is definitely NOT faster because of the much lower frequency at full load.
Yes, overall cumulative cpu performance is interesting, but performance of each core is what really makes the cpu “fast” – that’s interesting too.
Surely due to its low cost, low core count, but high frequency, this CPU could be fairly useful for GPU workstations/servers (eg just to feed the GPUs). So I was a bit surprised you never mentioned its PCIE lanes in this review? (I guess there is probably a reason that I am overlooking).
@Chris. Per the Ark page linked, it has 16 lanes. Which is because this is a desktop CPU with it’s ECC not fused off.
Intel segments the market too much. This is a CoreMumbleMumble CPU. But which Cove (or is it Creek or Peak or Crag or SlagHeap) core uarch? With the Other Companie one can at least draw a straight line fro. The product name to what is inside.
John,
A little disappointed about:
1- The inconsistent CPUs listed in benchmark results
2- The mixing of server CPUs (AMD EPYC) along with desktop CPUs
3- The complete lack of Ryzen 2000 or 3000 CPUs in the benchmark (you include a Ryzen 1600AF)
4- No comparison larger value proposition of Intel vs. AMD.
Chris, the platform is limited to 1x PCIe 16 or 2x PCIe wires. So max two crippled GPUs or one with full-speed of PCIe 3.0 version.
NotSlow, for ST performance comparison I would recommend to compare geekbench on the same OS with the same GB version.
Laugh, not so, e5-1650v2 was adult chip supporting RDIMMs, this is just sporty CPU with just poor UDIMM ECC support.
I can handle the crippling for a large last level cache, a pair of slots supporting Optane in storage mode is fine to feed a model, and a OCP 3.0 or Intel 100g. I would be running AVX codes on these with a presumably fat margin captured by Intel for Optane DIMMS, (oh why can’t we have a on board accelerated Intel 100g NIC? The other x8 lanes do me fine for a FPGA (I really can see this SKU being used under a Bluefield hypervisor solely for AVX codes. Iris graphics would have been perfectly lovely. Seriously these kinds of topologies need to be AICs that I can install in my POWER 9 RHEL/OpenShift environment. With a dma link across to the Accelerator Formerly Known As Quadro installed in the adjacent CXL slot. I would love to dedicate something like this (but upscale) to running Nuke / Baselight / Unity (per card, all wanting x64, me wanting POWER and ARM SVE for everything we write). I would spend more with Intel for CPU alone in this way.
BinkyTo: I usually find I can get a pretty good idea of “missing” data if I really read the review over. I know rtfa is so cliché but obviously delineation of the skus gives free product away that if I’ve need to show anyone else I’ll buy not claim I’m clever… I actually thought this review more generous than usual by mixing up the geometry of the comparables.
Comments are closed.