AMD EPYC 7H12 Performance
For this exercise, we are using our legacy Linux-Bench scripts which help us see cross-platform “least common denominator” results we have been using for years as well as several results from our updated Linux-Bench2 scripts. Starting with our 2nd Generation Intel Xeon Scalable refresh benchmarks, we are adding a number of our workload testing features to the mix as the next evolution of our platform.
At this point, our benchmarking sessions take days to run and we are generating well over a thousand data points. We are also running workloads for software companies that want to see how their software works on the latest hardware. As a result, this is a small sample of the data we are collecting and can share publicly. Our position is always that we are happy to provide some free data but we also have services to let companies run their own workloads in our lab, such as with our DemoEval service. What we do provide is an extremely controlled environment where we know every step is exactly the same and each run is done in a real-world data center, not a test bench.
We are going to show off a few results, and highlight a number of interesting data points in this article.
Python Linux 4.4.2 Kernel Compile Benchmark
This is one of the most requested benchmarks for STH over the past few years. The task was simple, we have a standard configuration file, the Linux 4.4.2 kernel from kernel.org, and make the standard auto-generated configuration utilizing every thread in the system. We are expressing results in terms of compiles per hour to make the results easier to read:
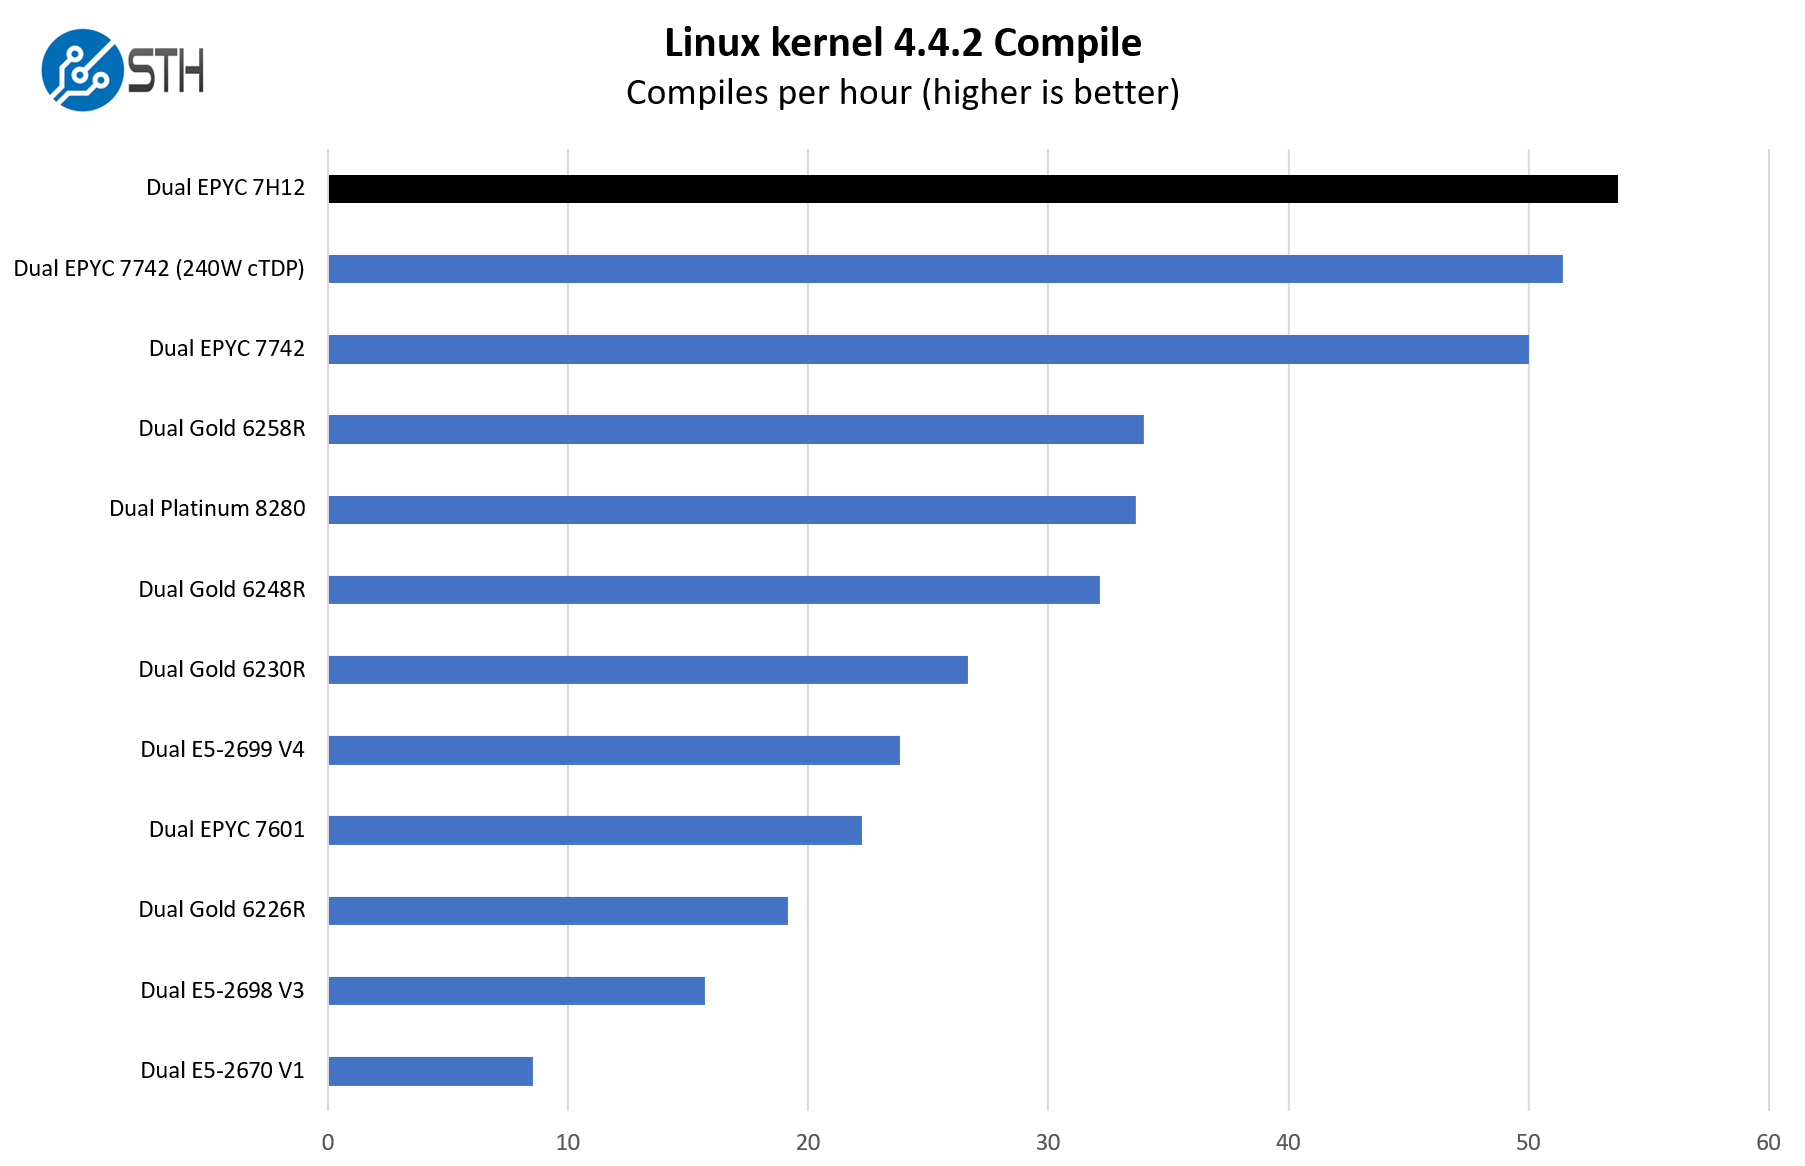
Setting the stage here, our primary comparison group is going to be the AMD EPYC 7H12, EPYC 7742, and both the Intel Xeon Platinum 8280 as well as the Intel Xeon Gold 6258R. At some point, the older generations of parts are simply not able to keep up. The AMD EPYC 7H12 is also a >$7000 SKU. As a result, it likely does not make sense spending time comparing it to the Xeon Bronze series or the AMD EPYC 7232P. Realistically, the market for these chips is the high performance per socket market.
c-ray 1.1 Performance
We have been using c-ray for our performance testing for years now. It is a ray tracing benchmark that is extremely popular to show differences in processors under multi-threaded workloads. We are going to use our 8K results which work well at this end of the performance spectrum.
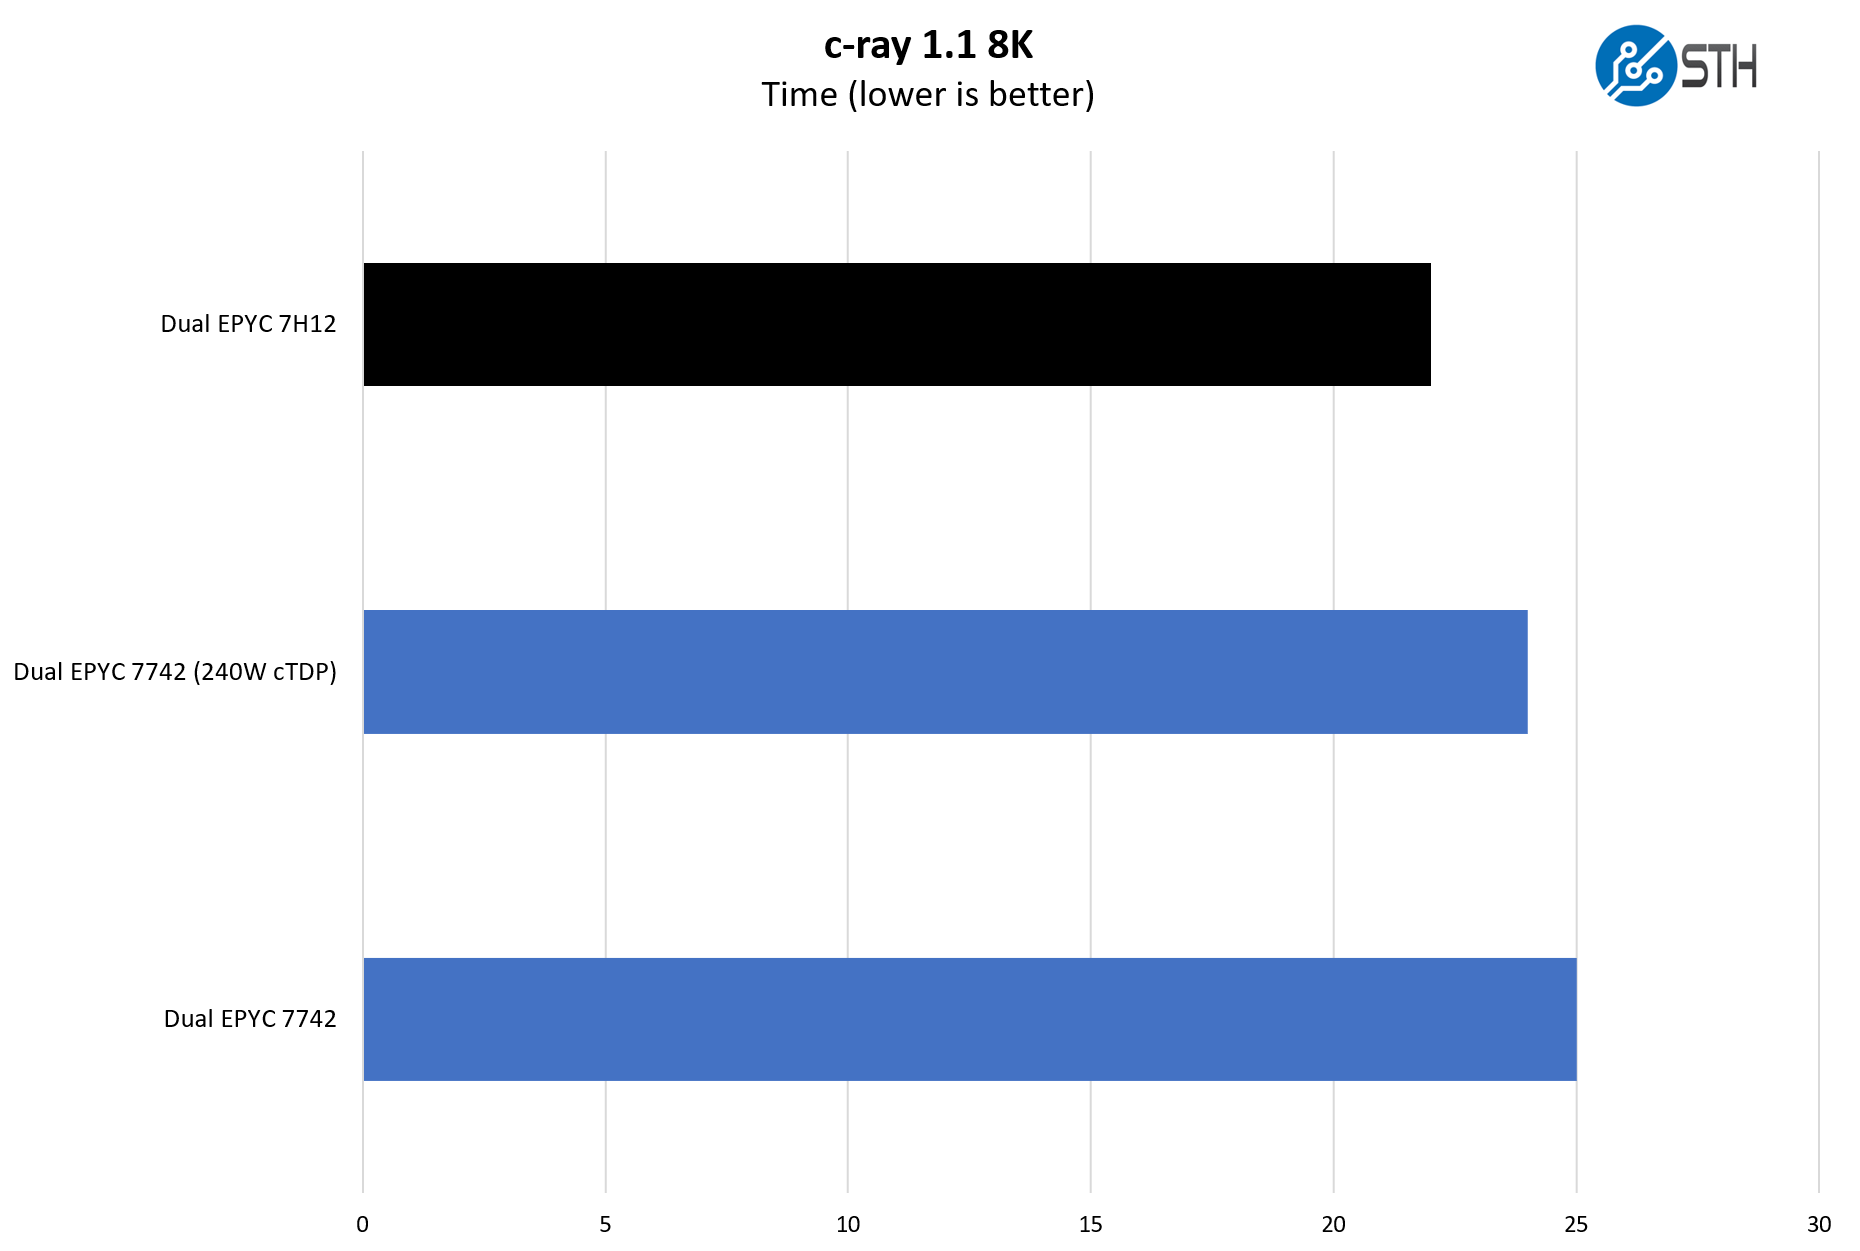
This is a benchmark that we started to use several years ago. There are architectural reasons the AMD Zen and Zen 2 chips perform extremely well here. Instead of looking at AMD versus Intel, it is best to look at AMD v. AMD here. This, along with tests such as Cinebench R20 on the Windows side tend to favor AMD architecture to an extent that they are not great CPU line to CPU line comparison points. As a simple comparison point for AMD-AMD it makes sense. Here, we can see that the extra 40W TDP is non-trivial. We are getting much better performance with the EPYC 7H12.
7-zip Compression Performance
7-zip is a widely used compression/ decompression program that works cross-platform. We started using the program during our early days with Windows testing. It is now part of Linux-Bench.
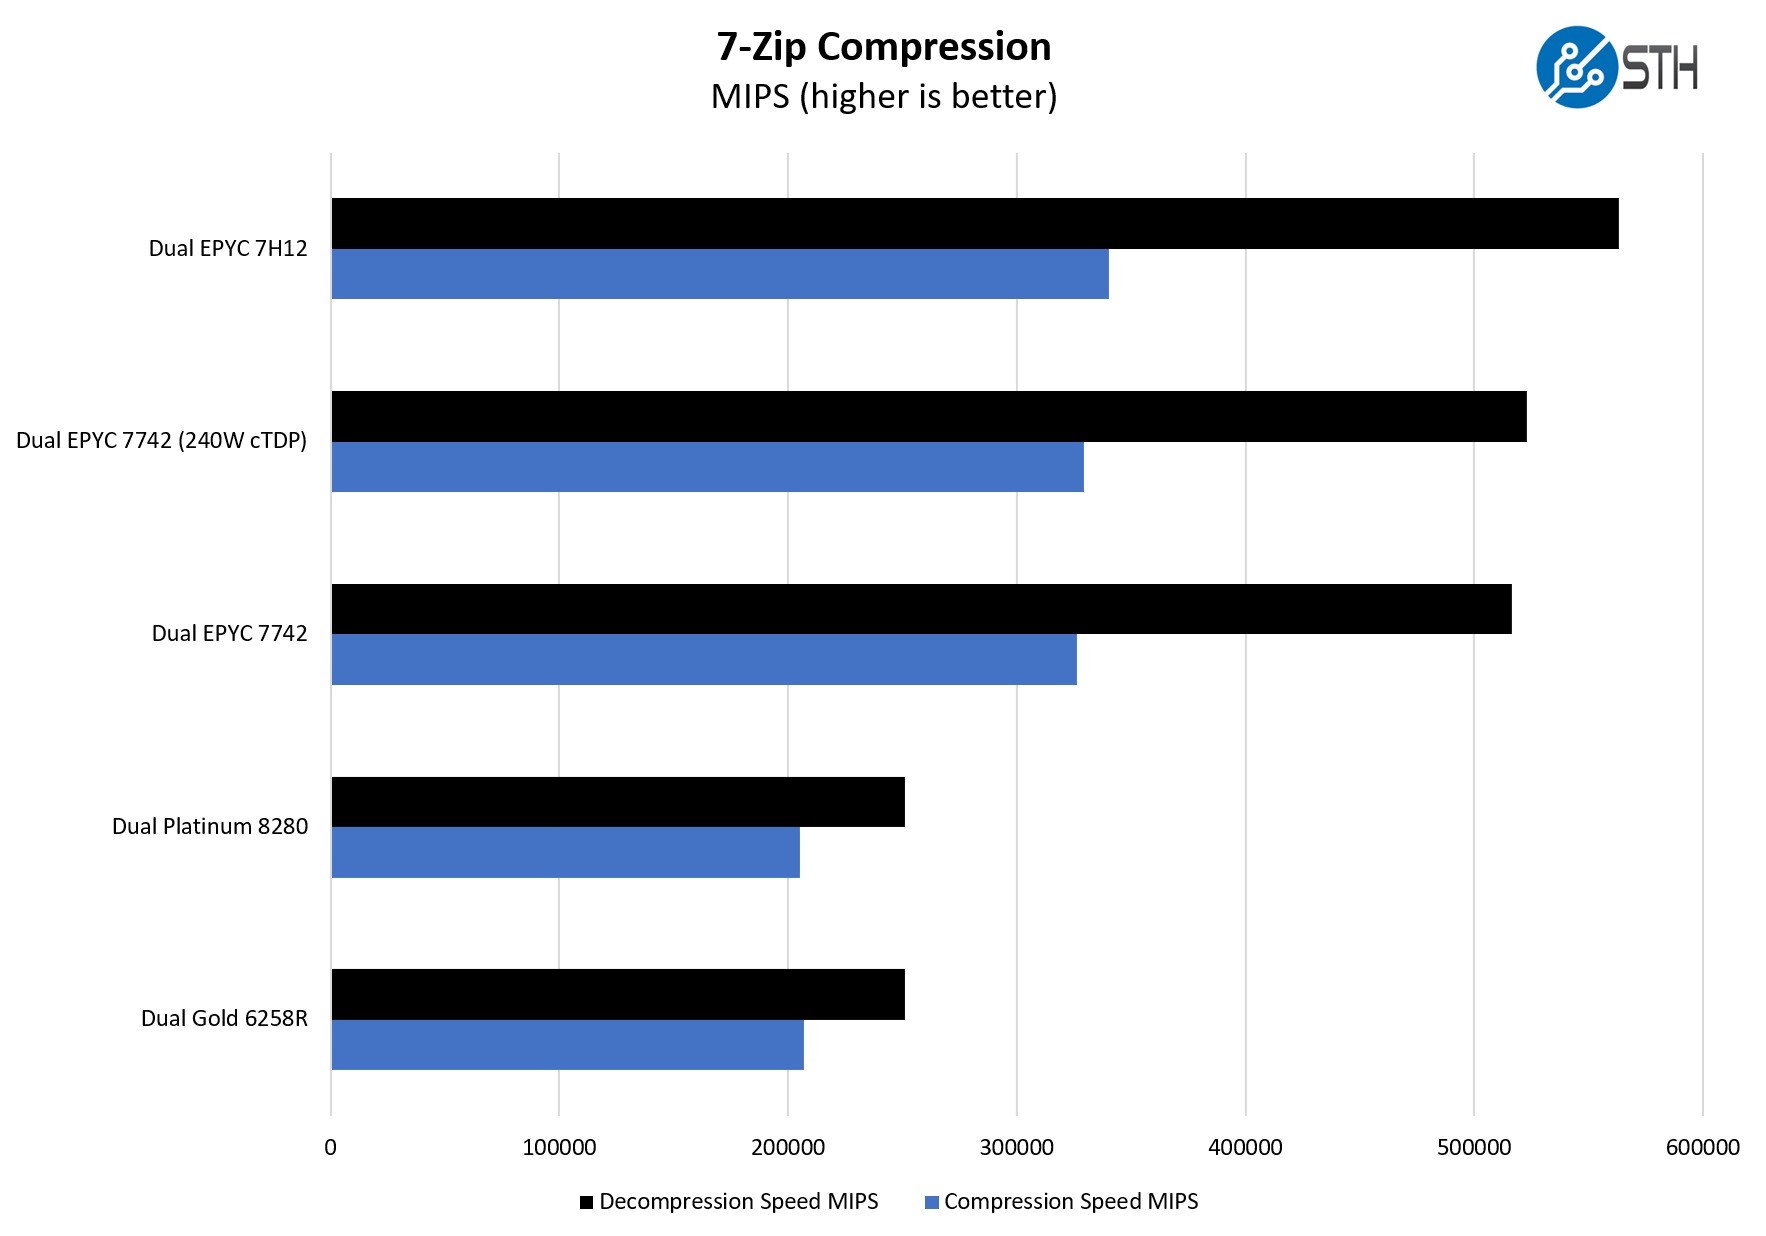
Sometimes, one simply needs cores. That is the impact of the 7zip compression benchmark. As we can see, AMD generally does very well on the decompression side, but as we would expect, with the nature of compression, that the compression side is much closer.
NAMD Performance
NAMD is a molecular modeling benchmark developed by the Theoretical and Computational Biophysics Group in the Beckman Institute for Advanced Science and Technology at the University of Illinois at Urbana-Champaign. More information on the benchmark can be found here. With GROMACS we have been working hard to support AVX-512 and AVX2 architectures. Here are the comparison results for the legacy data set:
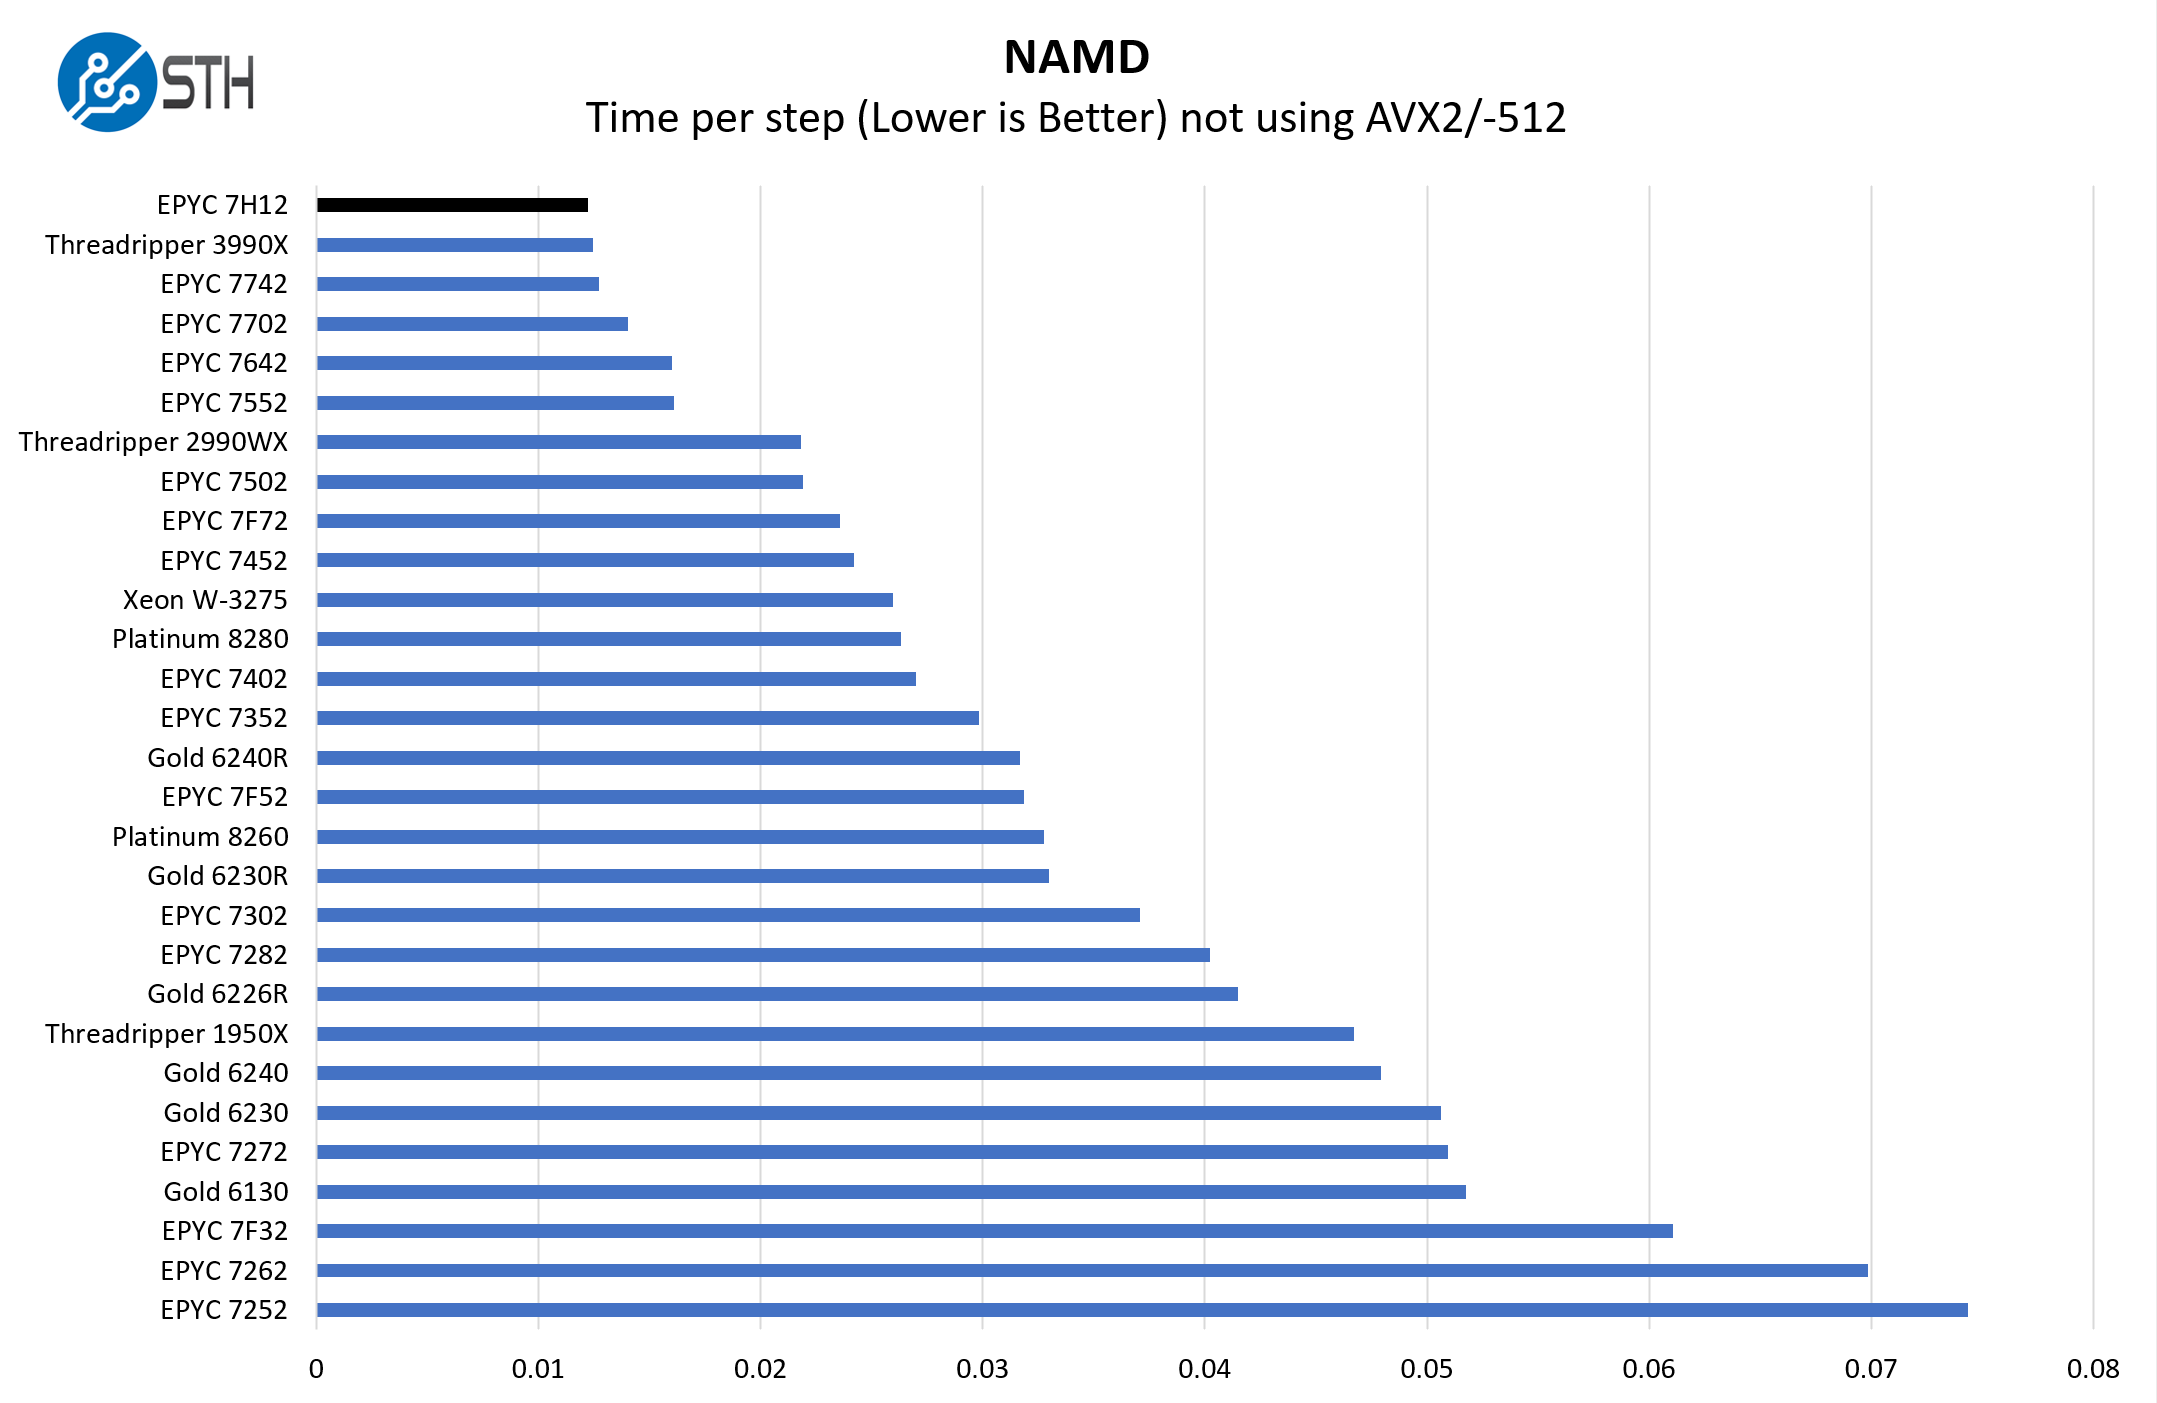
We know there are those that will immediately point to the AMD Ryzen Threadripper 3990X as the top-end processor with a similar TDP. We went through our test data and indeed, the Threadripper 3990X can in some cases out-performs the AMD EPYC 7H12. On heavier sustained workloads the EPYC 7H12 tends to do better. There is another benefit: one gets a bigger platform with the EPYC versus Threadripper scaling to more memory capacity, bandwidth, more PCIe Gen4 I/O, and most importantly dual socket configurations.
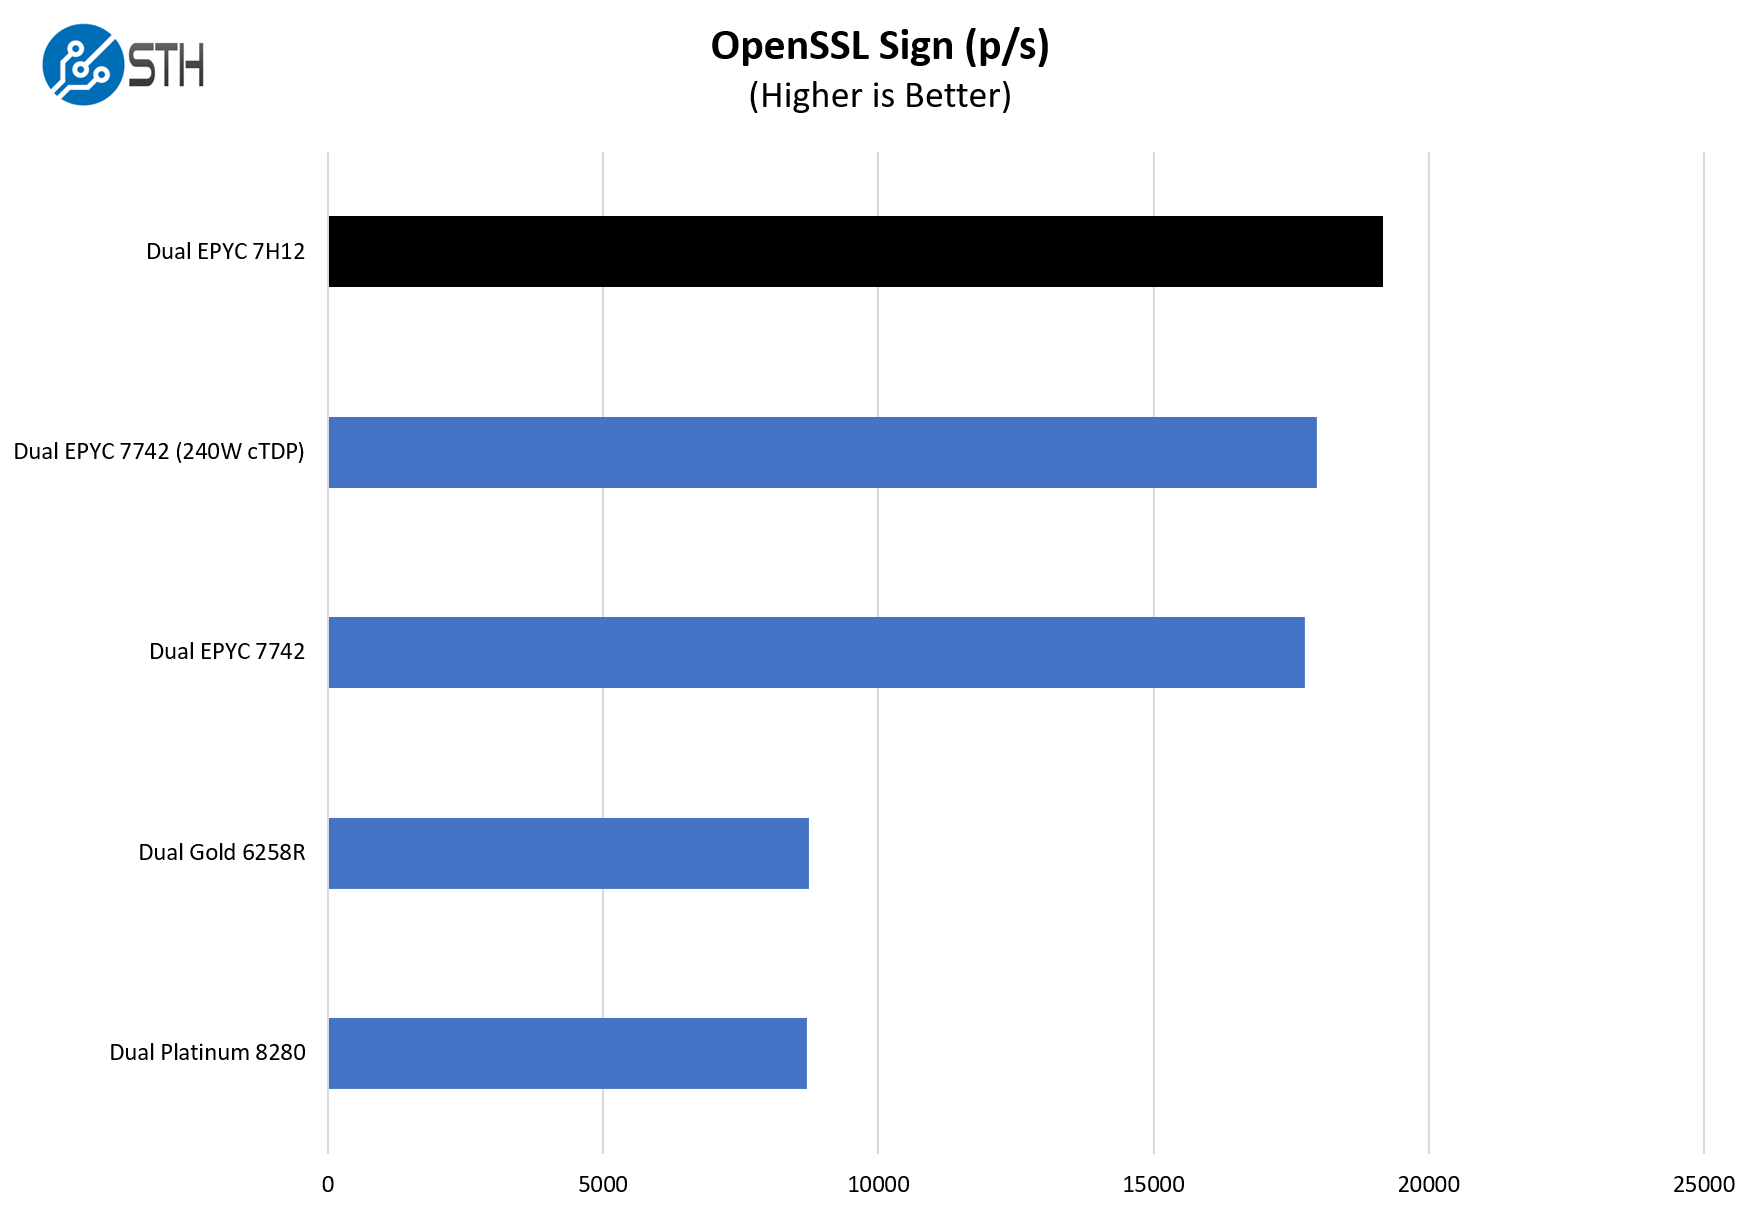
OpenSSL Performance
OpenSSL is widely used to secure communications between servers. This is an important protocol in many server stacks. We first look at our sign tests:
Here are the verify results:
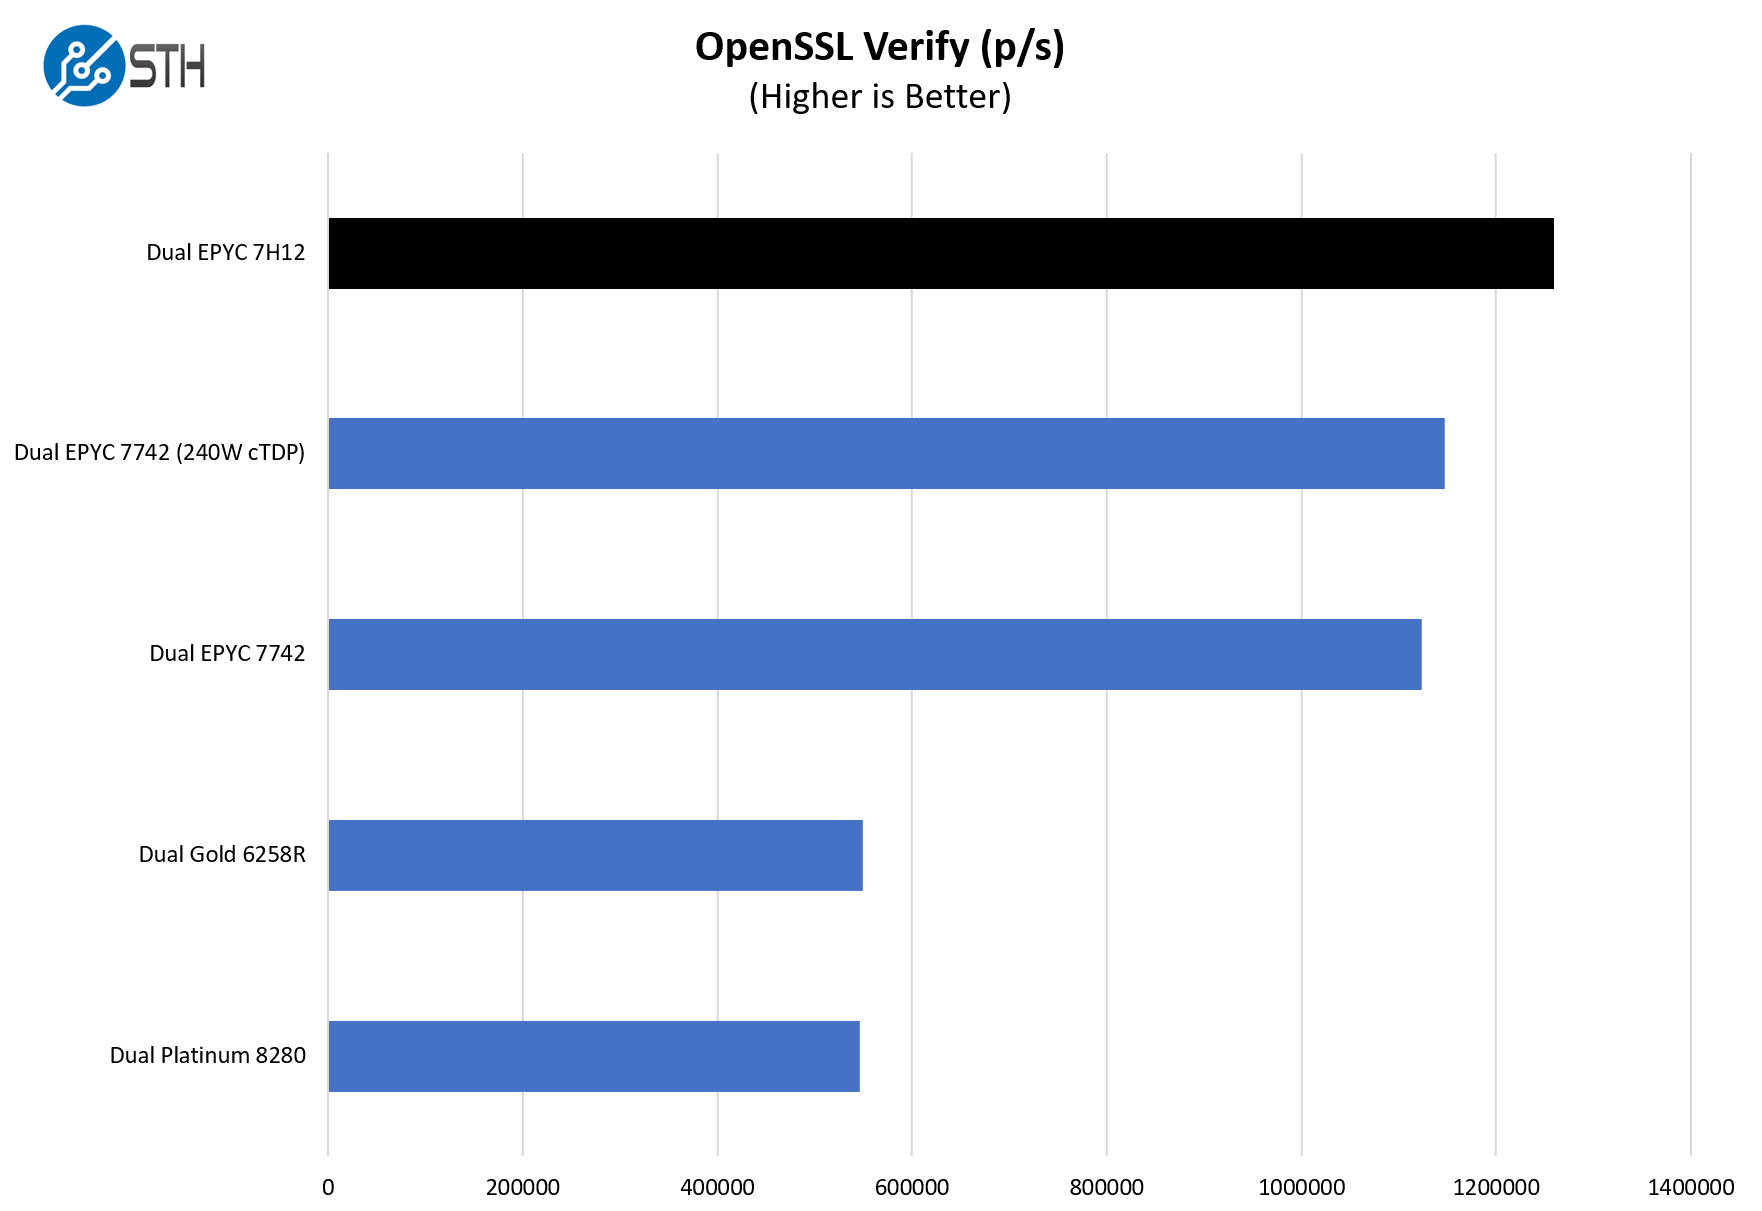
This is a workload that Intel may argue can be offloaded to QAT accelerators. OpenSSL is still done on a lot of CPUs but it is right to assume that there is an intense area of interest around moving this to accelerators given the prevalence. Still, it does show a nice gain from the 40-65W TDP boost.
Chess Benchmarking
Chess is an interesting use case since it has almost unlimited complexity. Over the years, we have received a number of requests to bring back chess benchmarking. We have been profiling systems and now use the results in our mainstream reviews:
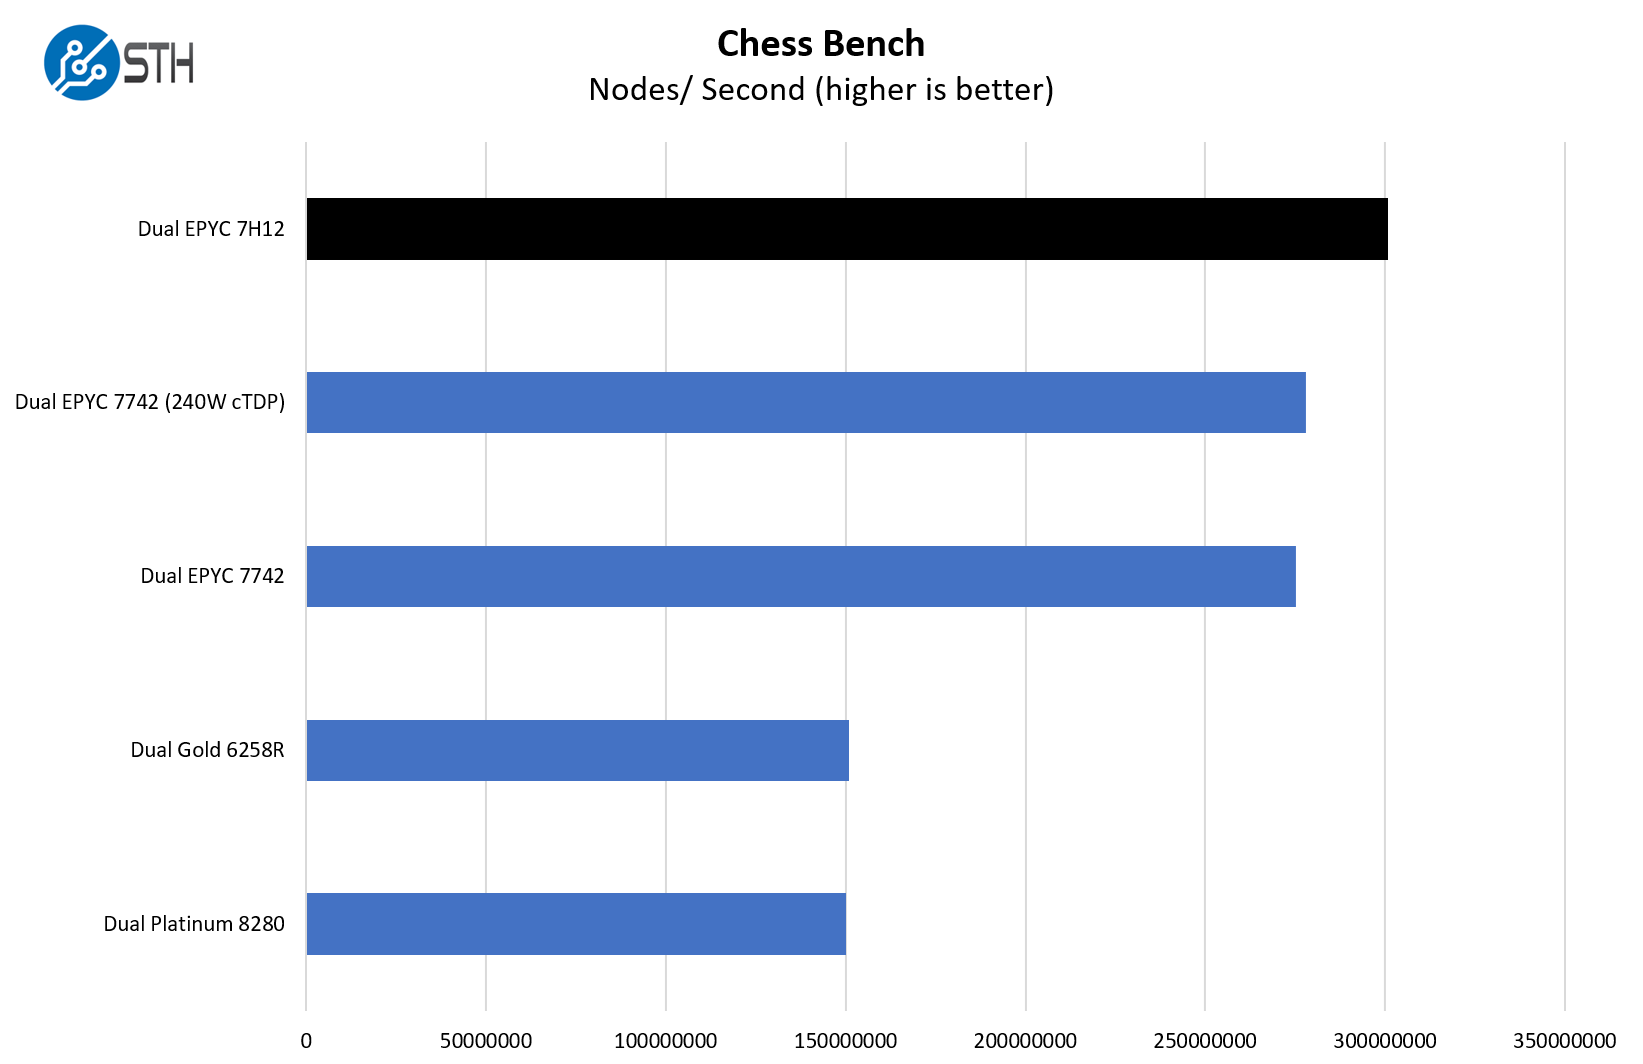
This tends to be a workload dominated by core counts and clock speeds, so perhaps it may make sense that the EPYC 7H12 is on top here. Technically, the AMD EPYC 7742 has a slightly higher boost clock, but we see the real impact of running higher clocks throughout testing due to the TDP increase.
STH STFB KVM Virtualization Testing
One of the other workloads we wanted to share is from one of our DemoEval customers. We have permission to publish the results, but the application itself being tested is closed source. This is a KVM virtualization-based workload where our client is testing how many VMs it can have online at a given time while completing work under the target SLA. Each VM is a self-contained worker.
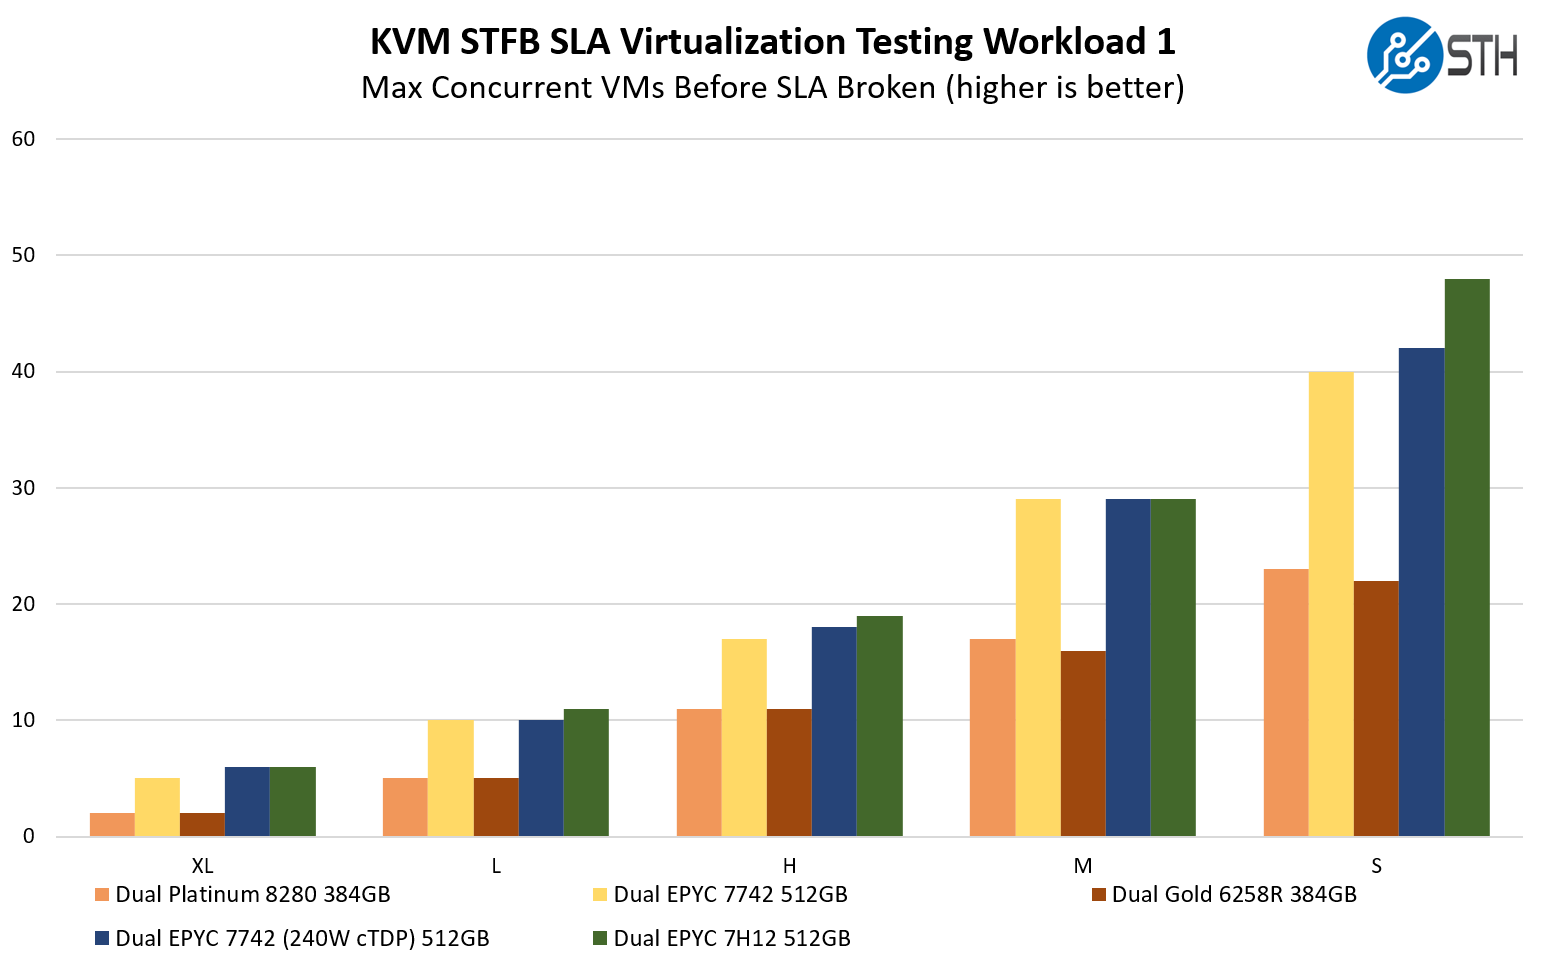
Something we wanted to point out here is that there is not perfect scaling in all scenarios. For example, here we have a case where we were still not getting extra VM/ VMs worth of extra performance over the dual EPYC 7742 setup. That is probably the pessimistic view. The more optimistic view is that the AMD EPYC 7H12 was as good if not better in terms of the number of KVM virtualized VMs that can be hosted on the machine and still hit their SLAs.
SPECrate2017_int_base
The last benchmark we wanted to look at is SPECrate2017_int_base performance. Specifically, we wanted to show the difference between what we get with Intel Xeon icc and AMD EPYC AOCC results. Server vendors get better results than we do, but this gives you an idea of where we are at in terms of what we have seen:
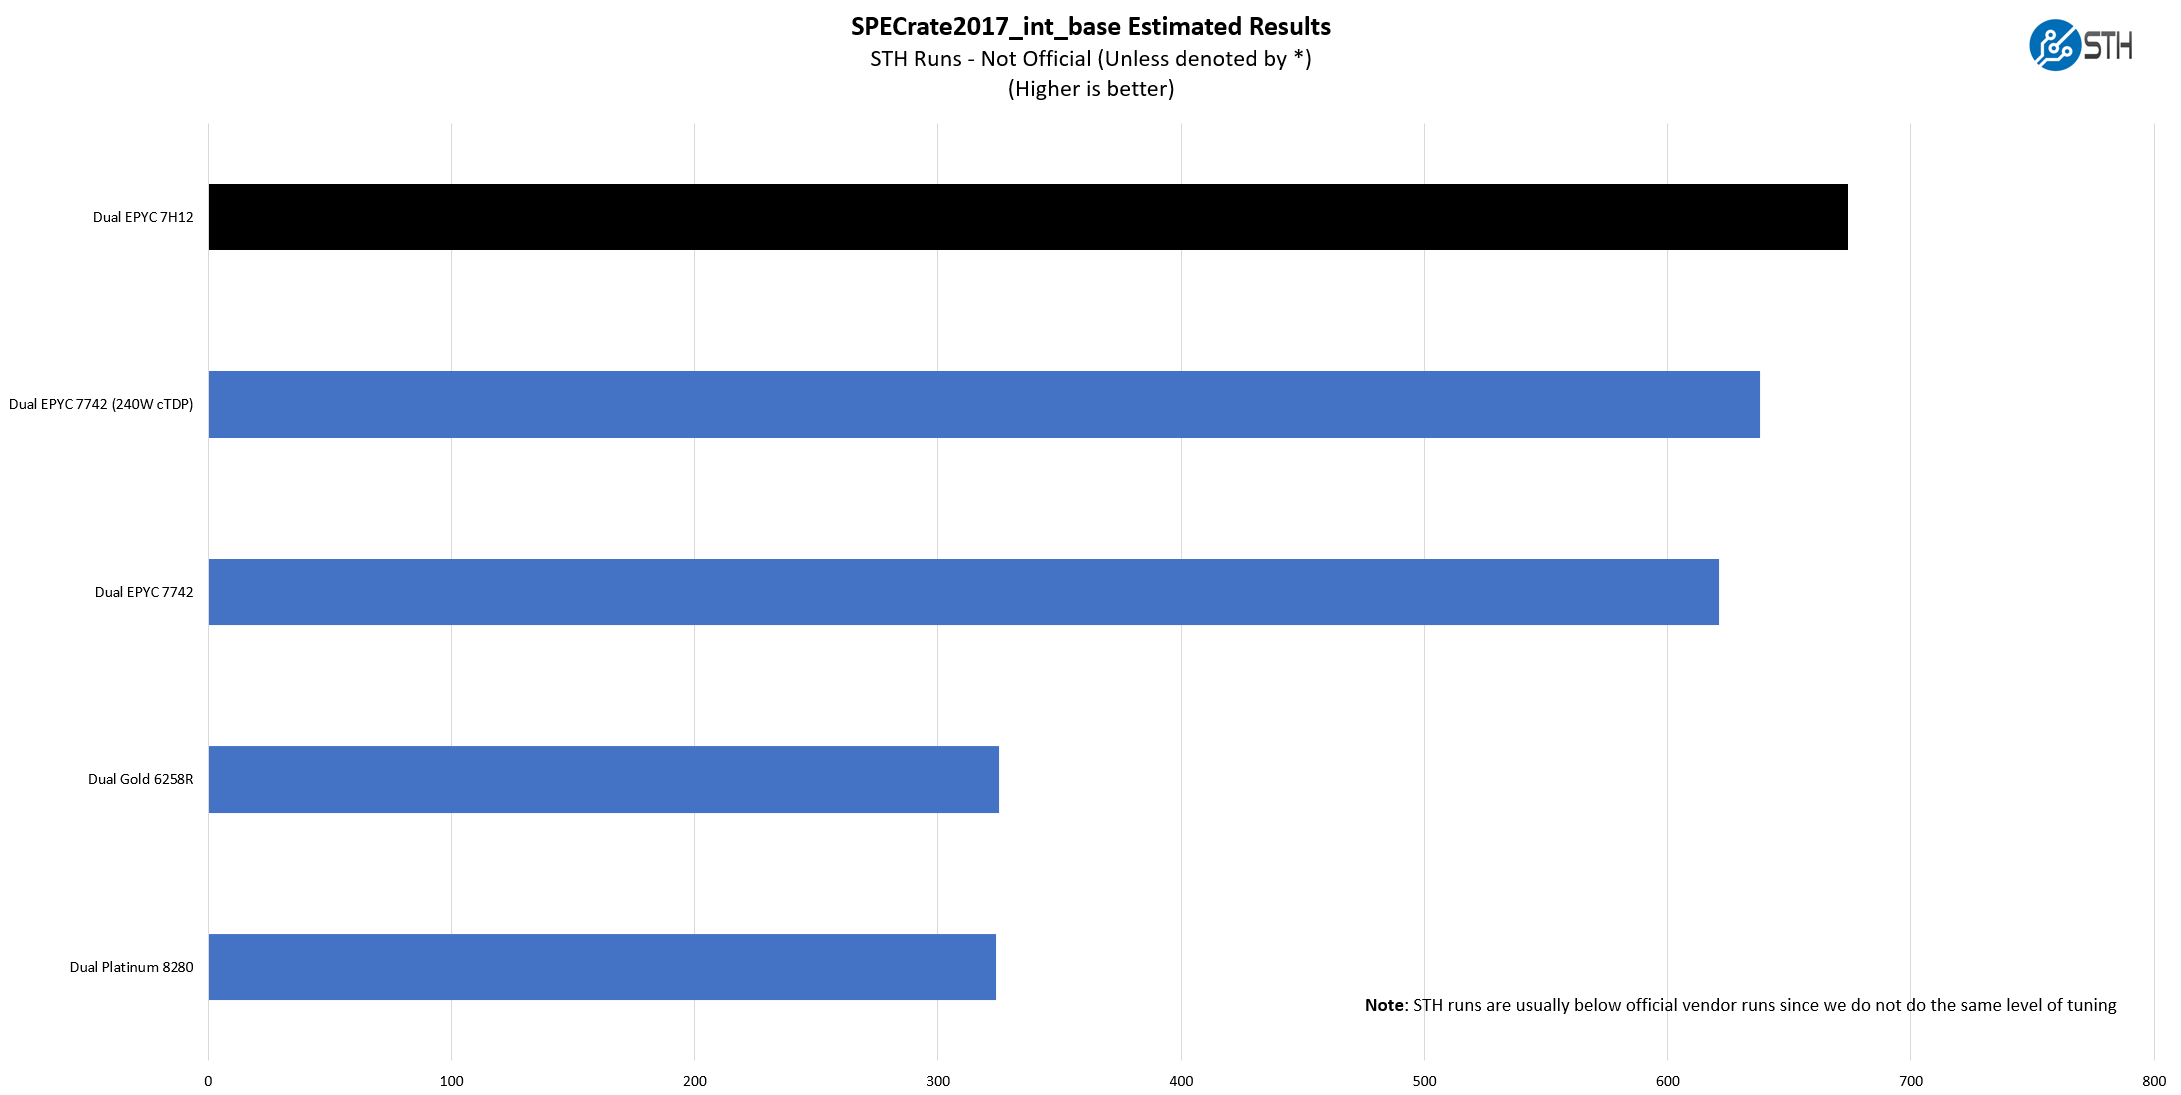
We received some comments noting we were a bit behind vendor results for some of our other tests, a fact that we noted in those reviews. Here we wanted to show both what we measured, and what server OEMs are measuring comparing the two chips. If the actual values are important for your RFP, then we suggest looking at the published results for the server(s) you are evaluating.
Here we see a fairly typical pattern. While we are generally lower than the published runs (OEMs have teams that specialize in tweaking platforms for these benchmarks), we still see a similar pattern. We did a quick check of published results instead of our estimated results because we are doing non-official benchmark runs. The difference seems to make sense since we tend to see a better than 2:1 consolidation ratio of the high-end 28 core Intel chips to the high-end 64-core EPYC chips represented in official results.
Next, we are going to get into the “so what” and discuss market positioning for the processor before giving our final words.


Impressive! Thanks Patrick. I wonder how soon you will be measuring Linux kernel compiles per second.
We actually use a larger codebase to compile than some others. When we started, I thought that it may be too big, especially for embedded chips. Now I am looking for what is next that is larger.
Chromium or Firefox are pretty large in LoC/Compile time but the build can be a bit finicky.
GCC is large too, might be an option.
Tensorflow takes ridiculously long to compile in my experience, too.
Building LLVM takes a while and Qt 5.15 takes ages.
Comments are closed.