Lenovo ThinkSystem ST250 Compute Performance
For this exercise, we are using our legacy Linux-Bench scripts which help us see cross-platform “least common denominator” results we have been using for years as well as several results from our updated Linux-Bench2 scripts. At this point, our benchmarking sessions take days to run and we are generating well over a thousand data points. We are also running workloads for software companies that want to see how their software works on the latest hardware. As a result, this is a small sample of the data we are collecting and can share publicly. Our position is always that we are happy to provide some free data but we also have services to let companies run their own workloads in our lab, such as with our DemoEval service. What we do provide is an extremely controlled environment where we know every step is exactly the same and each run is done in a real-world data center, not a test bench.
We are going to show off a few results, and highlight a number of interesting data points in this article.
Python Linux 4.4.2 Kernel Compile Benchmark
This is one of the most requested benchmarks for STH over the past few years. The task was simple, we have a standard configuration file, the Linux 4.4.2 kernel from kernel.org, and make the standard auto-generated configuration utilizing every thread in the system. We are expressing results in terms of compiles per hour to make the results easier to read:
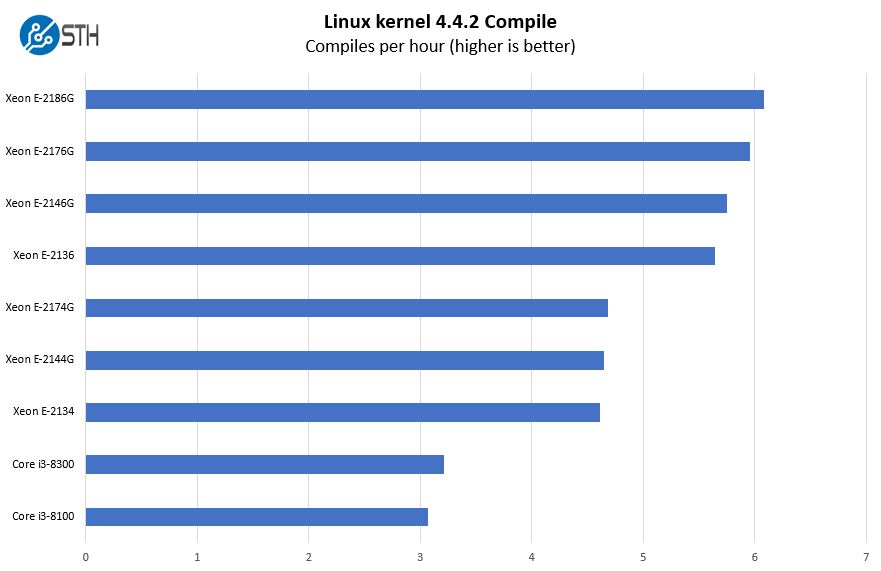
We tested the Lenovo ThinkSystem ST250 with a range of processors from the Intel Xeon E-2100 series as well as some of the Core i3 options. The overall top to bottom SKU price delta is much lower than the traditional Intel Xeon Scalable mainstream server market. As an interesting side effect, you generally get more CPU performance per dollar in this segment than you do on mainstream servers due to Intel’s pricing strategy.
c-ray 1.1 Performance
We have been using c-ray for our performance testing for years now. It is a ray tracing benchmark that is extremely popular to show differences in processors under multi-threaded workloads. We are going to use our 8K results which work well at this end of the performance spectrum.
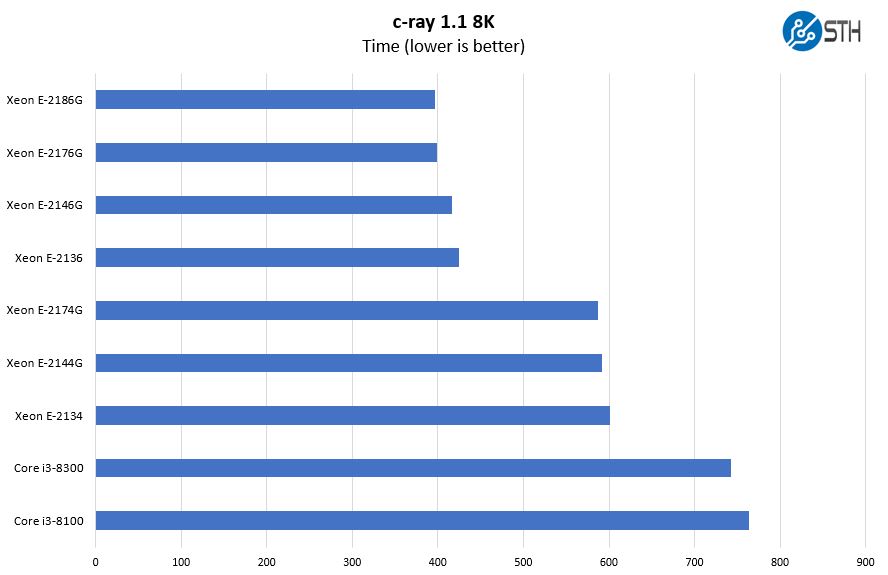
In this generation, the Intel Xeon E-2100 series now supports up to 6 cores per CPU and 12 threads. With the next generation Intel Xeon E-2200, this will go up to 8 cores and 16 threads. You can see the new SKUs in our Intel Xeon E-2200 Series SKU List and Value Analysis piece. Our test system came configured with the Intel Xeon E-2186G, but we are showing a wide range of options.
7-zip Compression Performance
7-zip is a widely used compression/ decompression program that works cross-platform. We started using the program during our early days with Windows testing. It is now part of Linux-Bench.
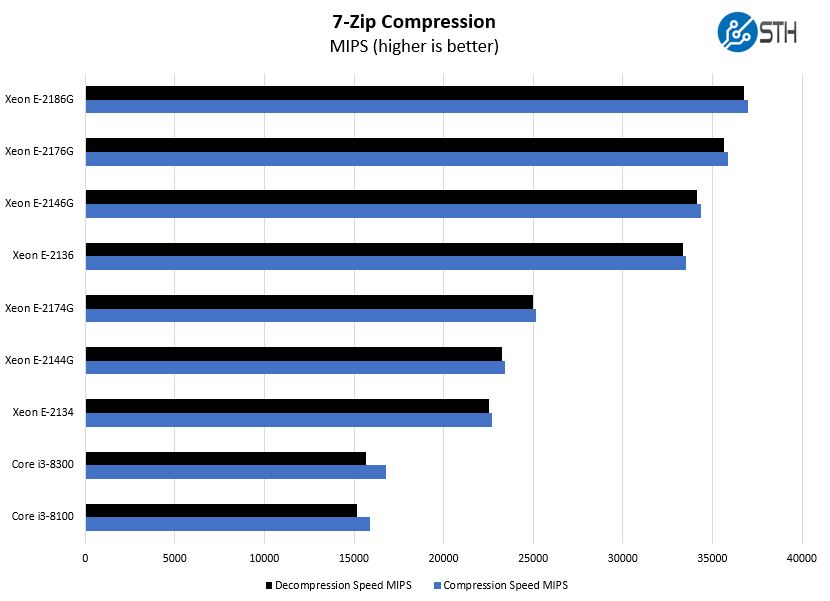
Here, the Intel Xeon E-2174G to Xeon E-2134 CPUs represent 4 core/ 8 thread parts. While in previous generations they would have been considered the high-end parts, they are now the midrange. If you have previously bought servers in this class and do not need more performance, that also makes them more attractive from a pricing standpoint.
Sysbench CPU test
Sysbench is another one of those widely used Linux benchmarks. We specifically are using the CPU test, not the OLTP test that we use for some storage testing.
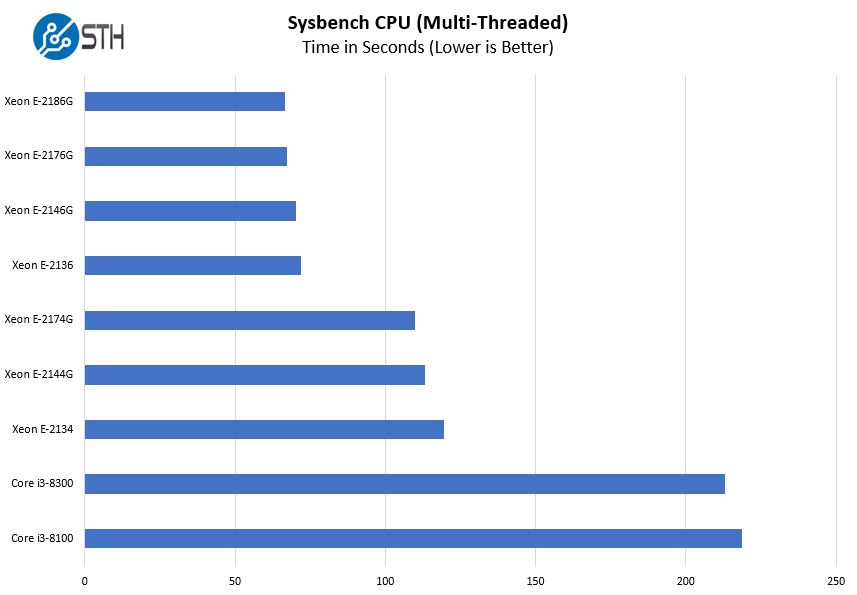
You may have noticed some CPUs in our charts, particularly the Xeon SKUs, have a “G” suffix. That “G” means that a Xeon has integrated graphics. Intel Core i3 CPUs also have the iGPU but do not carry the suffix. That also means an Intel Xeon E-2136 does not have an integrated GPU thanks to its lack of “G” suffix.
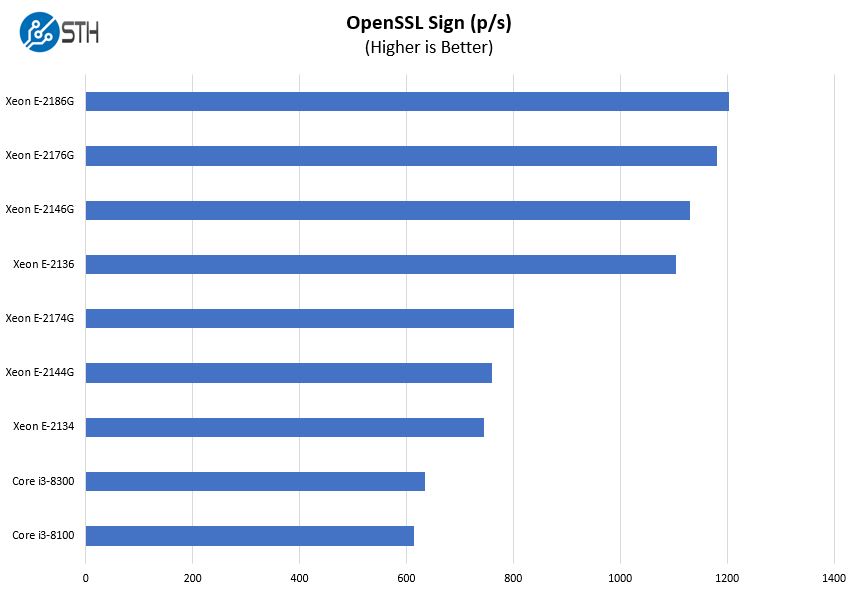
OpenSSL Performance
OpenSSL is widely used to secure communications between servers. This is an important protocol in many server stacks. We first look at our sign tests:
Here are the verify results:
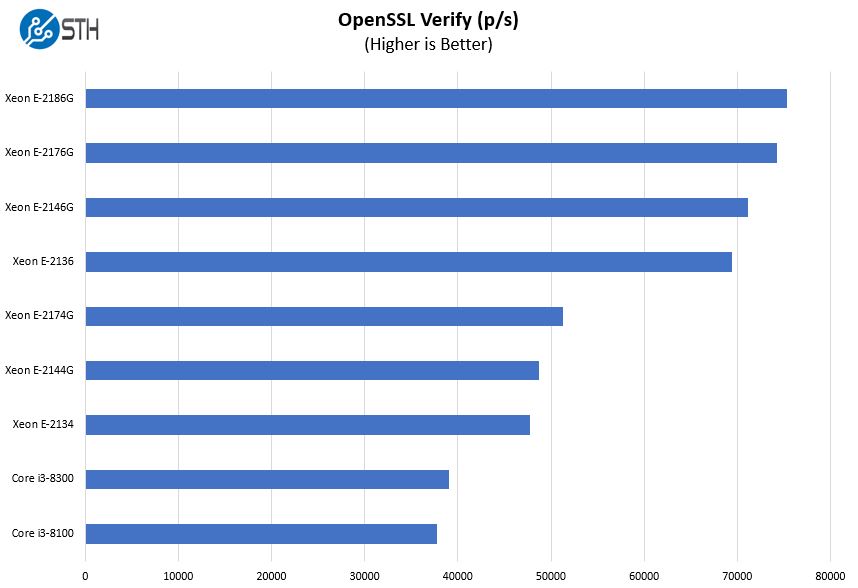
OpenSSL is a foundational technology that underpins many of today’s applications. In our Intel Xeon E-2146G Benchmarks and Review, we called that option our top pick for its price/ performance ratio which is on display here. Smart STH readers that want higher-end CPU performance will look at this option.
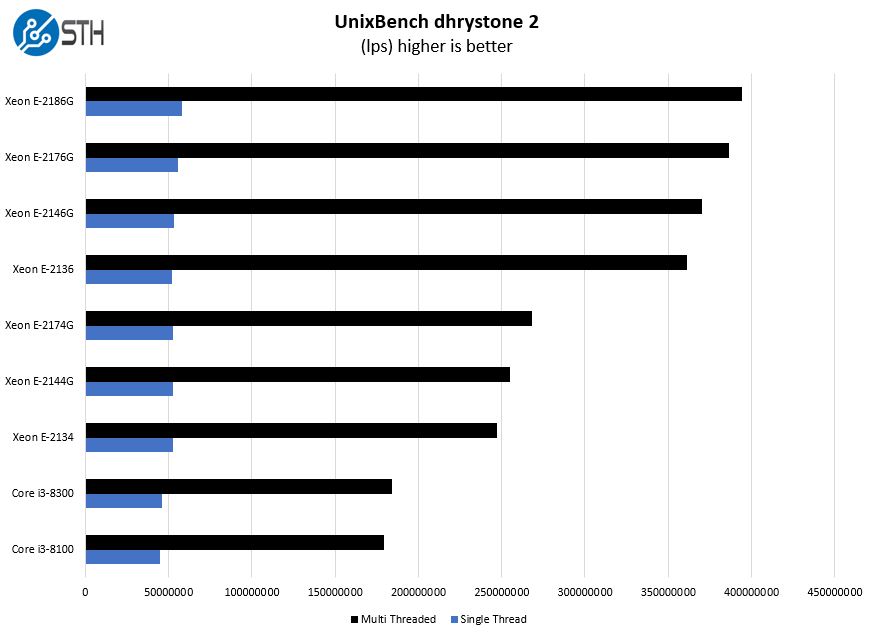
UnixBench Dhrystone 2 and Whetstone Benchmarks
Some of the longest-running tests at STH are the venerable UnixBench 5.1.3 Dhrystone 2 and Whetstone results. They are certainly aging, however, we constantly get requests for them, and many angry notes when we leave them out. UnixBench is widely used so we are including it in this data set. Here are the Dhrystone 2 results:
Here are the whetstone results:
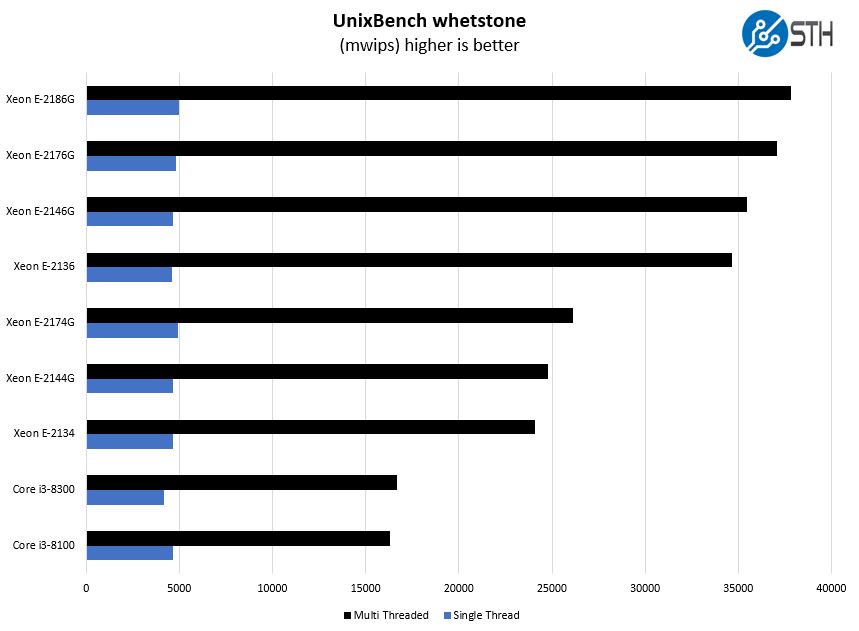
Again we are seeing a common step function here with the Intel Xeon E-2100 six-core parts performing very well. The Intel Core i3-8100 is still a fairly fast CPU. If you were satisfied with the Intel Xeon E3-1220 or E3-1225 level of performance in previous generations, then the Core i3 options may be enough and may save you some investment dollars.
Chess Benchmarking
Chess is an interesting use case since it has almost unlimited complexity. Over the years, we have received a number of requests to bring back chess benchmarking. We have been profiling systems and are ready to start sharing results:
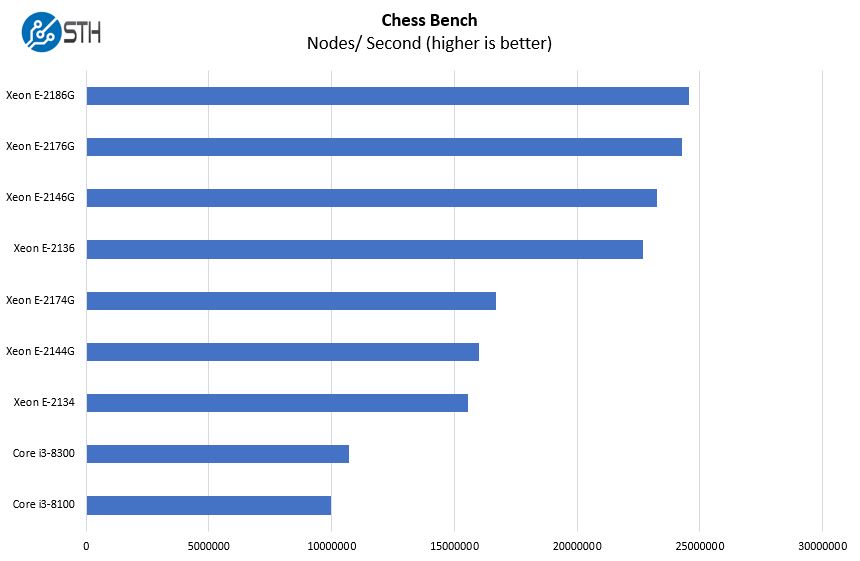
Moving from an Intel Xeon E-2174G to an Intel Xeon E-2146G may seem like a decrementing numerical value, but the performance increase is significant. Here you can see that the Intel Xeon E-2146G is significantly faster due to having 6 cores (6 in the model name) versus 4.
Next, we are going to look at the power consumption before covering the STH Server Spider and then our final words.


