Intel Xeon Gold 6230R Performance
For this exercise, we are using our legacy Linux-Bench scripts which help us see cross-platform “least common denominator” results we have been using for years as well as several results from our updated Linux-Bench2 scripts. Starting with our 2nd Generation Intel Xeon Scalable refresh benchmarks, we are adding a number of our workload testing features to the mix as the next evolution of our platform.
At this point, our benchmarking sessions take days to run and we are generating well over a thousand data points. We are also running workloads for software companies that want to see how their software works on the latest hardware. As a result, this is a small sample of the data we are collecting and can share publicly. Our position is always that we are happy to provide some free data but we also have services to let companies run their own workloads in our lab, such as with our DemoEval service. What we do provide is an extremely controlled environment where we know every step is exactly the same and each run is done in a real-world data center, not a test bench.
We are going to show off a few results, and highlight a number of interesting data points in this article.
Python Linux 4.4.2 Kernel Compile Benchmark
This is one of the most requested benchmarks for STH over the past few years. The task was simple, we have a standard configuration file, the Linux 4.4.2 kernel from kernel.org, and make the standard auto-generated configuration utilizing every thread in the system. We are expressing results in terms of compiles per hour to make the results easier to read:
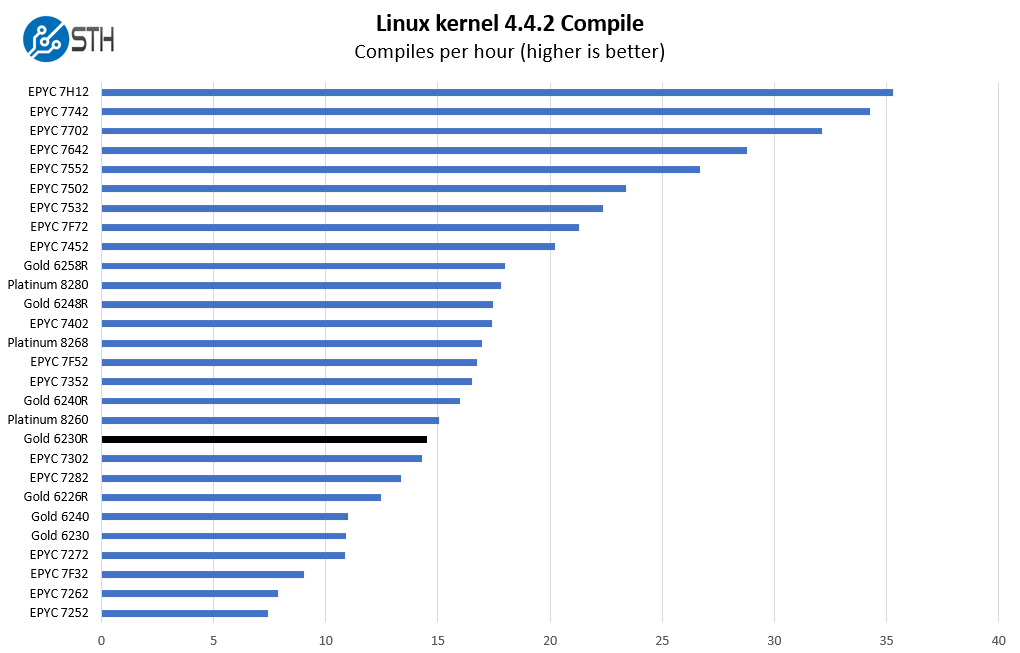
We have a wide range of results here. For example, we are scaling up to the AMD EPYC 7H12 which is clearly in a higher-end segment with a 280W TDP. Likewise, we are moving down the stack to the previous generation Gold 6230. Since this is a higher core count part, we wanted to show performance relative to a range of offerings but also tried constraining our charts a bit. We are very late in the product cycle for 2nd generation Xeon Scalable parts as well as AMD EPYC 7002 “Rome” CPUs that were launched in 2019 so we have a lot of data at this point.
c-ray 1.1 Performance
We have been using c-ray for our performance testing for years now. It is a ray tracing benchmark that is extremely popular to show differences in processors under multi-threaded workloads. We are going to use our 8K results which work well at this end of the performance spectrum.
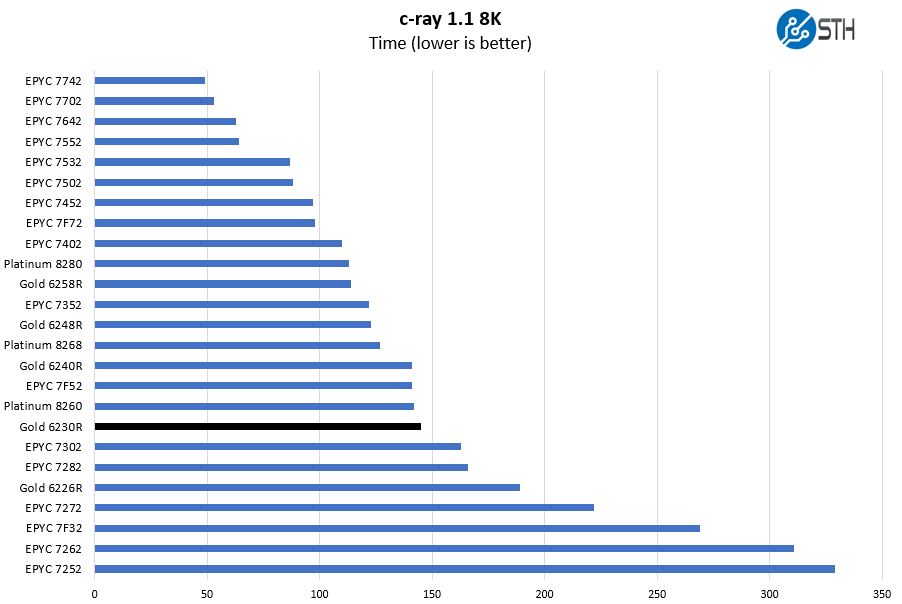
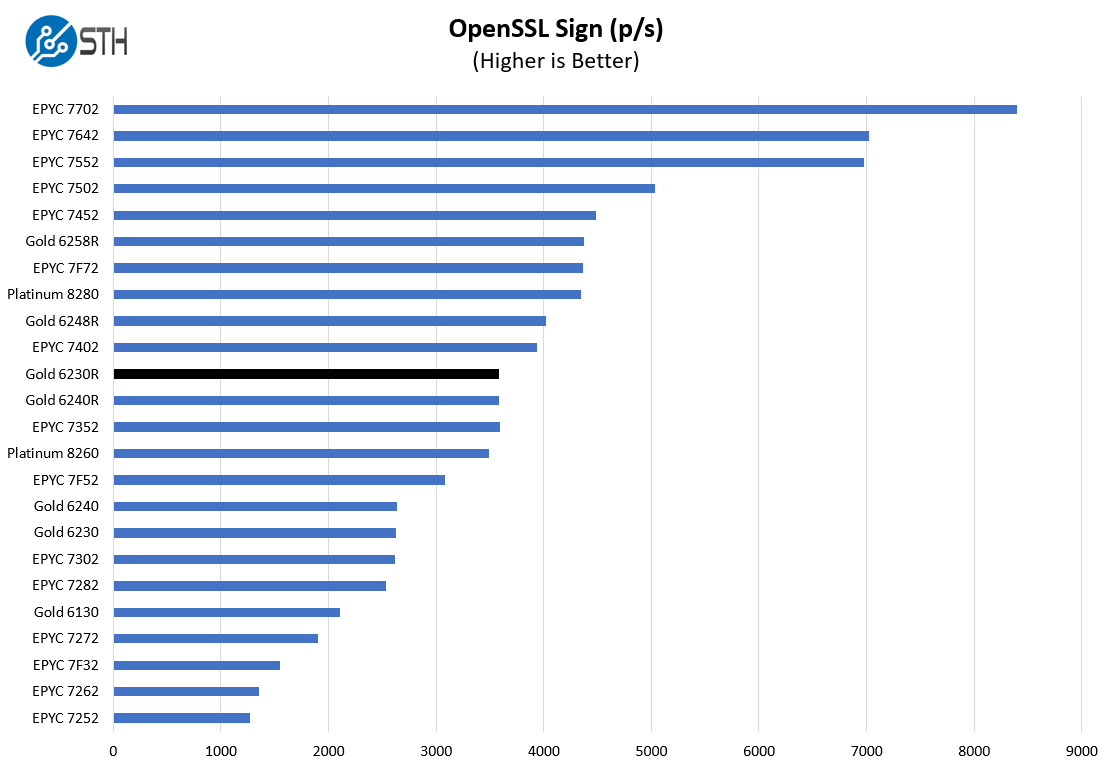
This is a benchmark that we started to use several years ago. There are architectural reasons the AMD Zen and Zen 2 chips perform extremely well here. Instead of looking at AMD versus Intel, it is best to look at Intel v. Intel here. Something that we will often see in these results is that the Intel Xeon Gold 6230R and Platinum 8260 are fairly close in many results even though the 8260 only has 24 cores. Additional clock speed and TDP help make the per-core performance of the Platinum 8260 better.
7-zip Compression Performance
7-zip is a widely used compression/ decompression program that works cross-platform. We started using the program during our early days with Windows testing. It is now part of Linux-Bench.
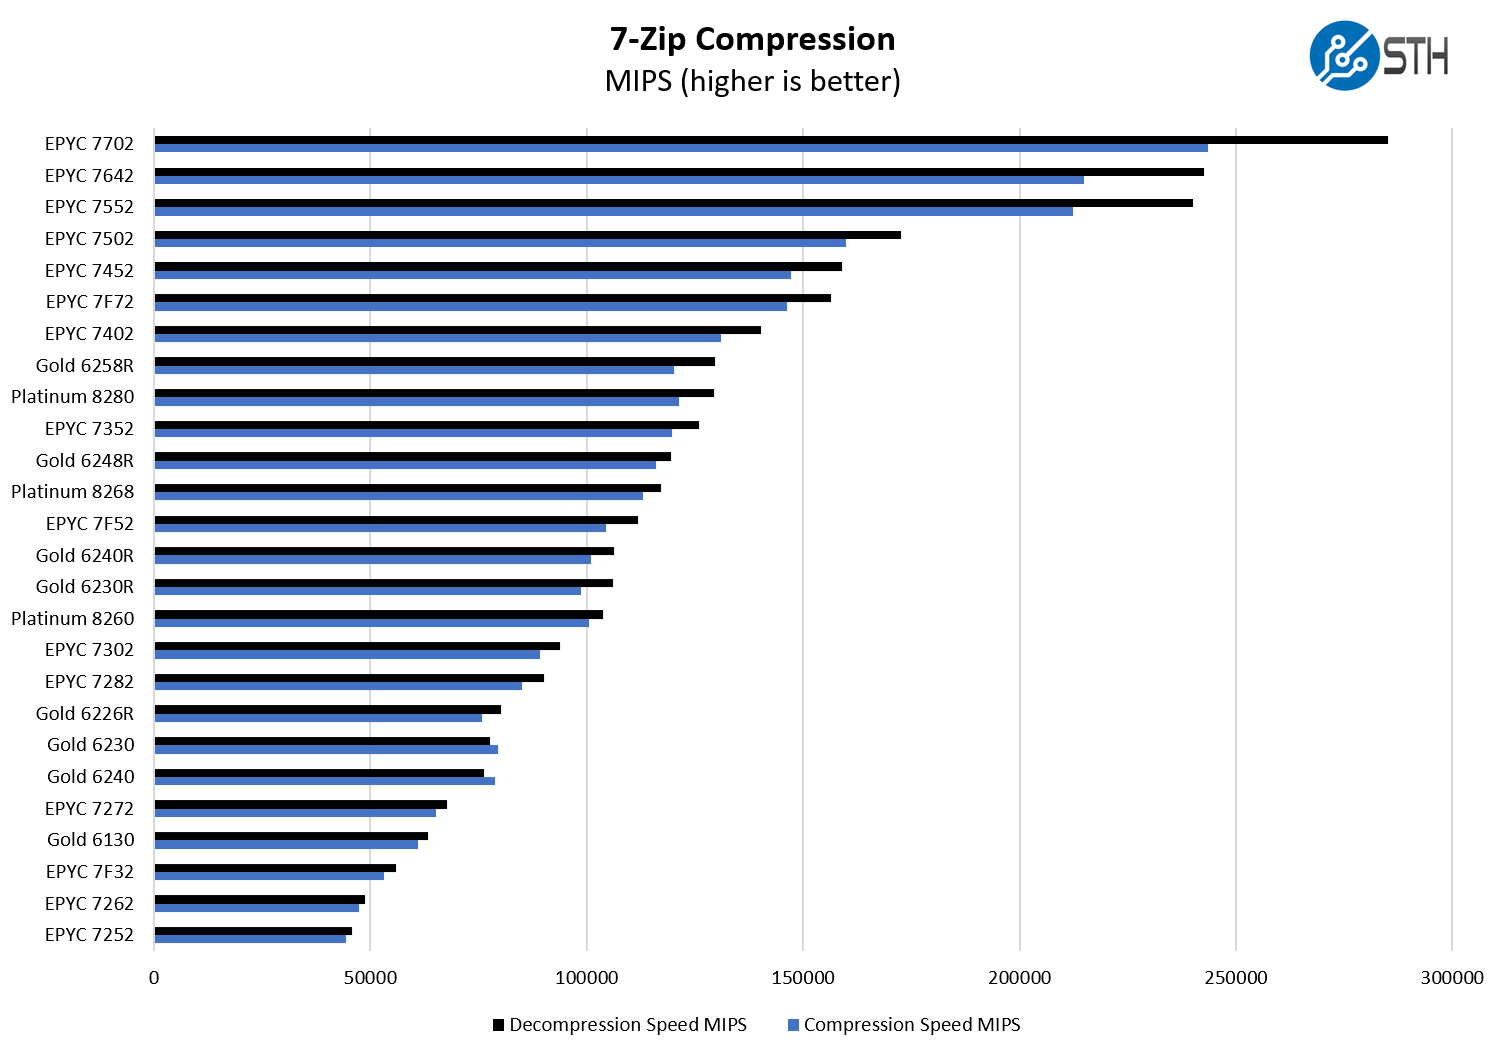
Since the Intel Xeon Gold 6240R is effectively a refresh version of the Platinum 8260, we see a similar pattern where TDP v. core count is playing a role. This is an interesting example since we sort on decompression, not compression, where the Gold 6230R falls between the two 24-core 165W TDP offerings. If we sorted by compression, the Gold 6230R would be below the 24-core options.
NAMD Performance
NAMD is a molecular modeling benchmark developed by the Theoretical and Computational Biophysics Group in the Beckman Institute for Advanced Science and Technology at the University of Illinois at Urbana-Champaign. More information on the benchmark can be found here. With GROMACS we have been working hard to support AVX-512 and AVX2 architectures. Here are the comparison results for the legacy data set:
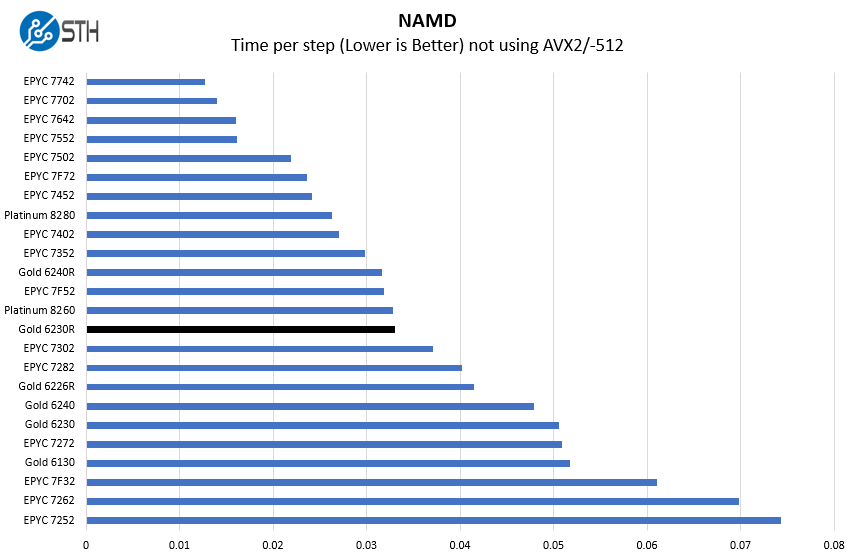
Here we see the Xeon Gold 6230R is slightly behind the AMD EPYC 7F52 frequency optimized part. The EPYC 7F52 is a 16-core part with a 240W TDP. With 60% more TDP headroom (albeit AMD and Intel calculate TDP differently) the higher clock speeds mean we see better performance than on the 26 core Intel part that has 62.5% more cores.
OpenSSL Performance
OpenSSL is widely used to secure communications between servers. This is an important protocol in many server stacks. We first look at our sign tests:
Here are the verify results:
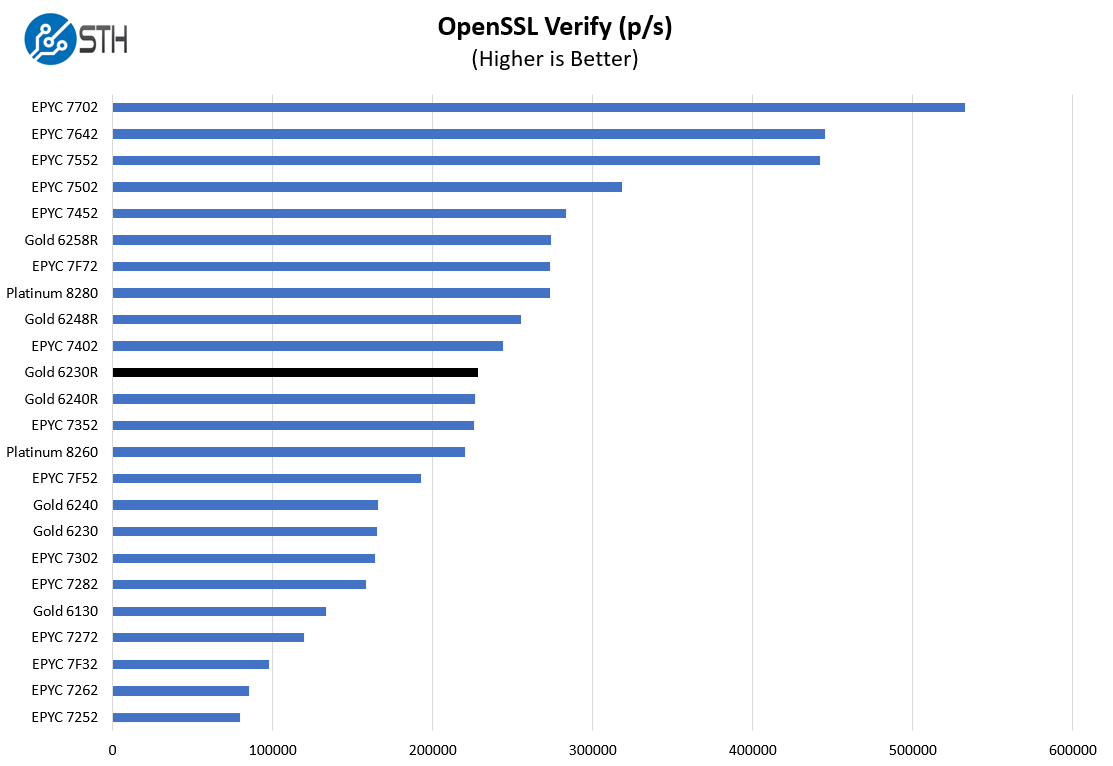
This is a workload that Intel may argue can be offloaded to QAT accelerators. Using CPUs, we can see here that the Xeon Gold 6230R is very close to the Gold 6240R, and in the range a 24-core AMD EPYC offerings (AMD does not have 26 core parts.)
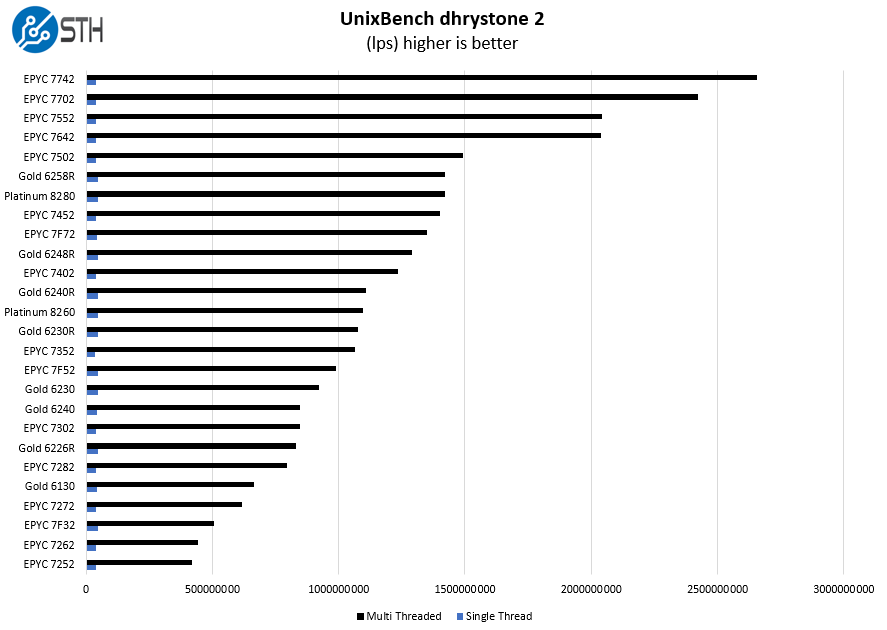
UnixBench Dhrystone 2 and Whetstone Benchmarks
Some of the longest-running tests at STH are the venerable UnixBench 5.1.3 Dhrystone 2 and Whetstone results. They are certainly aging, however, we constantly get requests for them, and many angry notes when we leave them out. UnixBench is widely used so we are including it in this data set. Here are the Dhrystone 2 results:
Here are the whetstone results:
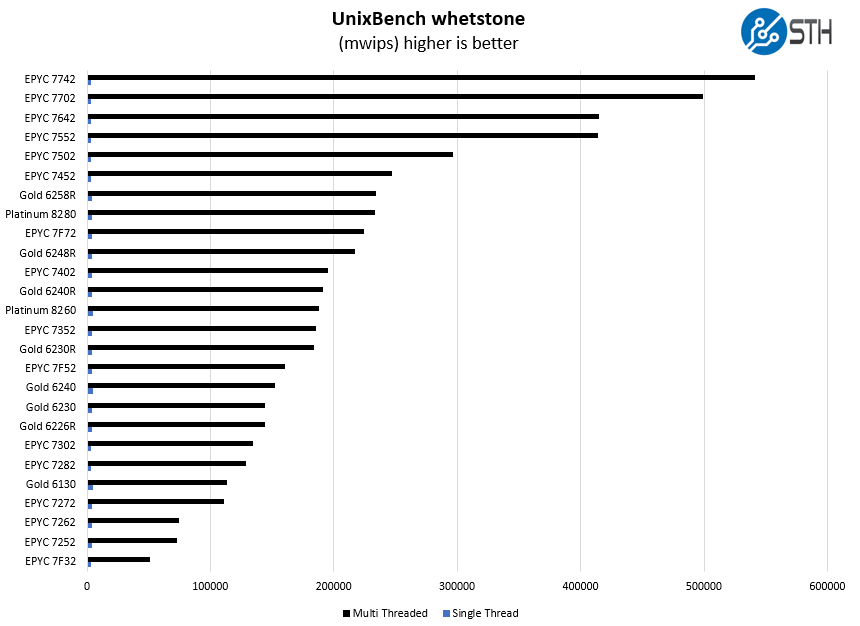
We have some Intel Xeon Gold 6130 and Gold 6230 results in here to show generational improvements. These charts give a fairly simple view of generational improvements Intel has made in its Xeon stack over the past few years.
Chess Benchmarking
Chess is an interesting use case since it has almost unlimited complexity. Over the years, we have received a number of requests to bring back chess benchmarking. We have been profiling systems and now use the results in our mainstream reviews:
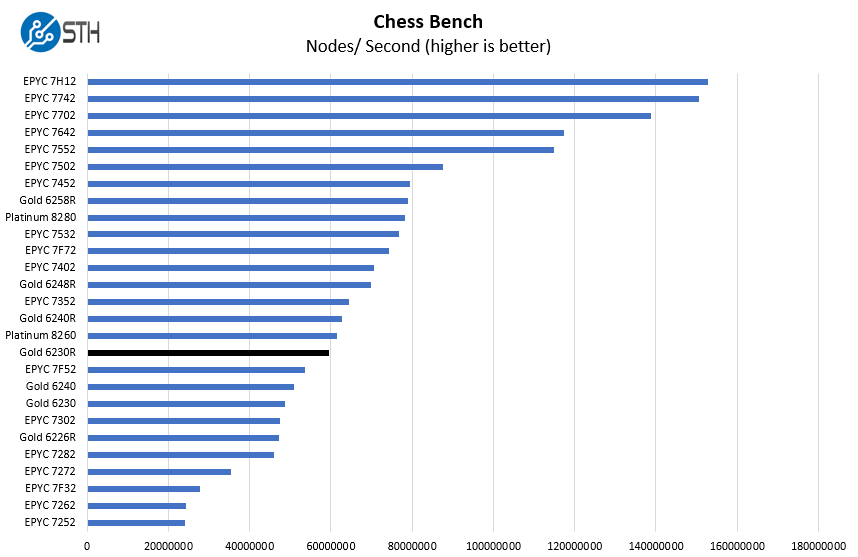
We are often seeing the Intel Xeon Gold 6230R perform somewhere around the AMD EPYC 7352 which is a 24-core 155W TDP $1350 list price part. The AMD parts operate in a tighter frequency range. There is little question that AMD is offering more performance at a lower list price in this generation. One does have to argue that in the context of a fully-configured (and discounted) system, whether organizations will choose AMD for a ~$600 per CPU list price savings.
STH STFB KVM Virtualization Testing
One of the other workloads we wanted to share is from one of our DemoEval customers. We have permission to publish the results, but the application itself being tested is closed source. This is a KVM virtualization-based workload where our client is testing how many VMs it can have online at a given time while completing work under the target SLA. Each VM is a self-contained worker.
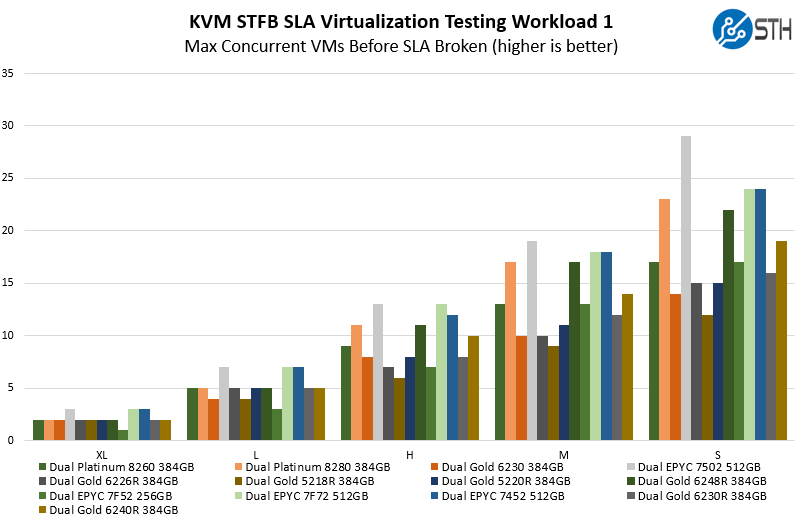
At this point, we generally know how this type of solution will perform. As we saw with the Gold 6240R review, we get a nice uplift over the Xeon Gold 5218R. In the context of per-system cost and performance, and upgrade from the Xeon Gold 5000 series can make a lot of sense.
SPECrate2017_int_base
The last benchmark we wanted to look at is SPECrate2017_int_base performance. Specifically, we wanted to show the difference between what we get with Intel Xeon icc and AMD EPYC AOCC results. Server vendors get better results than we do, but this gives you an idea of where we are at in terms of what we have seen:
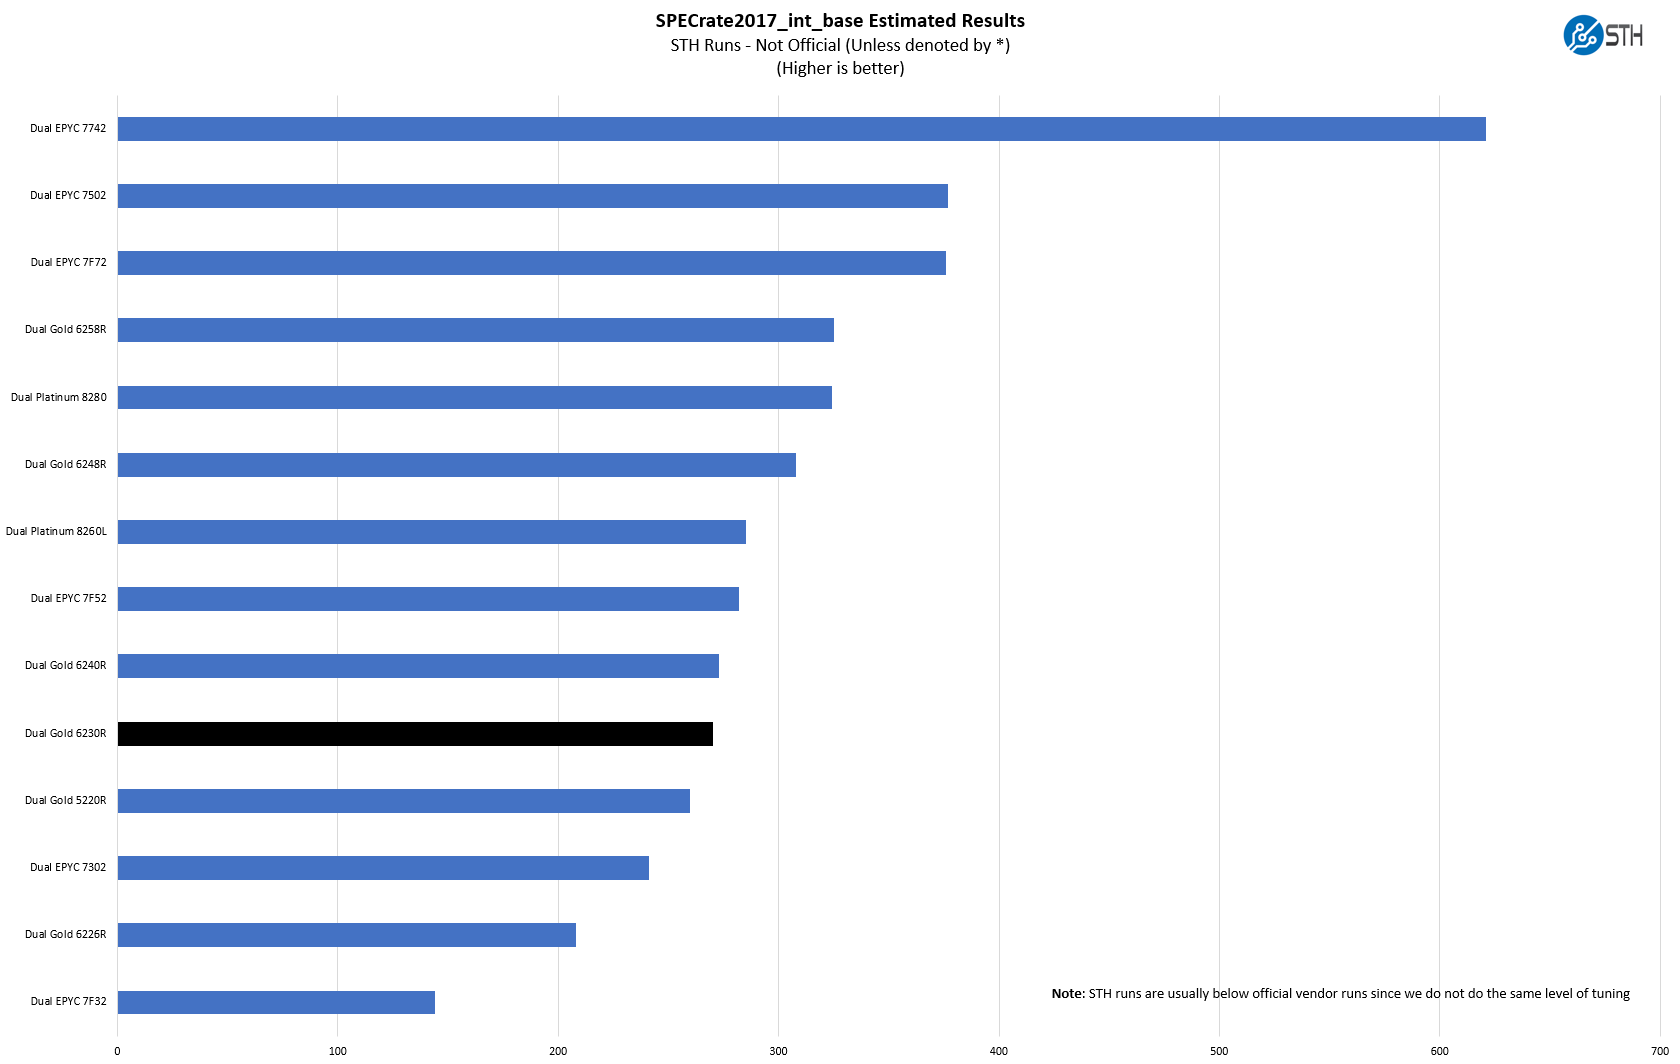
We received some comments noting we were a bit behind vendor results for some of our other tests, a fact that we noted in those reviews. Here we wanted to show both what we measured, and what server OEMs are measuring comparing the two chips. If the actual values are important for your RFP, then we suggest looking at the published results for the server(s) you are evaluating.
Here we see a fairly typical pattern with performance relatively still close to the Xeon Platinum 8260L. In our assessment, on a price/performance basis, the Xeon Gold 6230R part is a much better value than the Platinum 8260 which we have seen consistently in our results.
Next, we are going to get into the “so what” and discuss market positioning for the processor before giving our final words.


