
Dell PowerEdge R770AP Performance
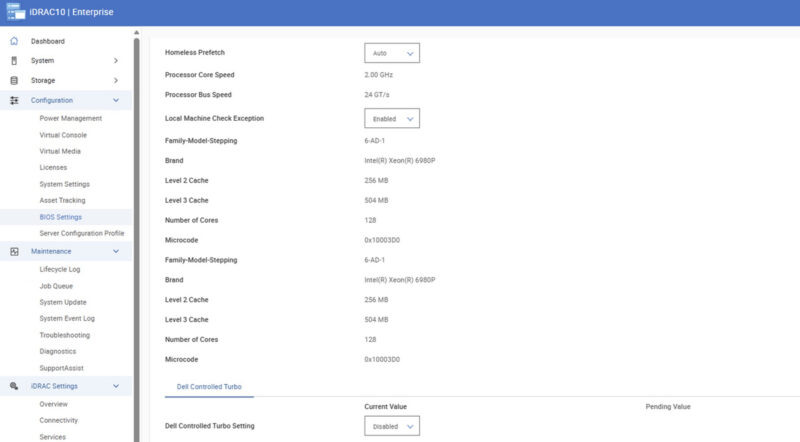
Our test system has two Intel Xeon 6980P series CPUs. These are Intel’s high-end Xeon 6 processors with plenty of cache.
We will start things off with a look at core-to-core latency. Here is a look at a single CPU, which is a 128×128 matrix and is an eye chart. As a result, we have the Min, Median, and Max for you.
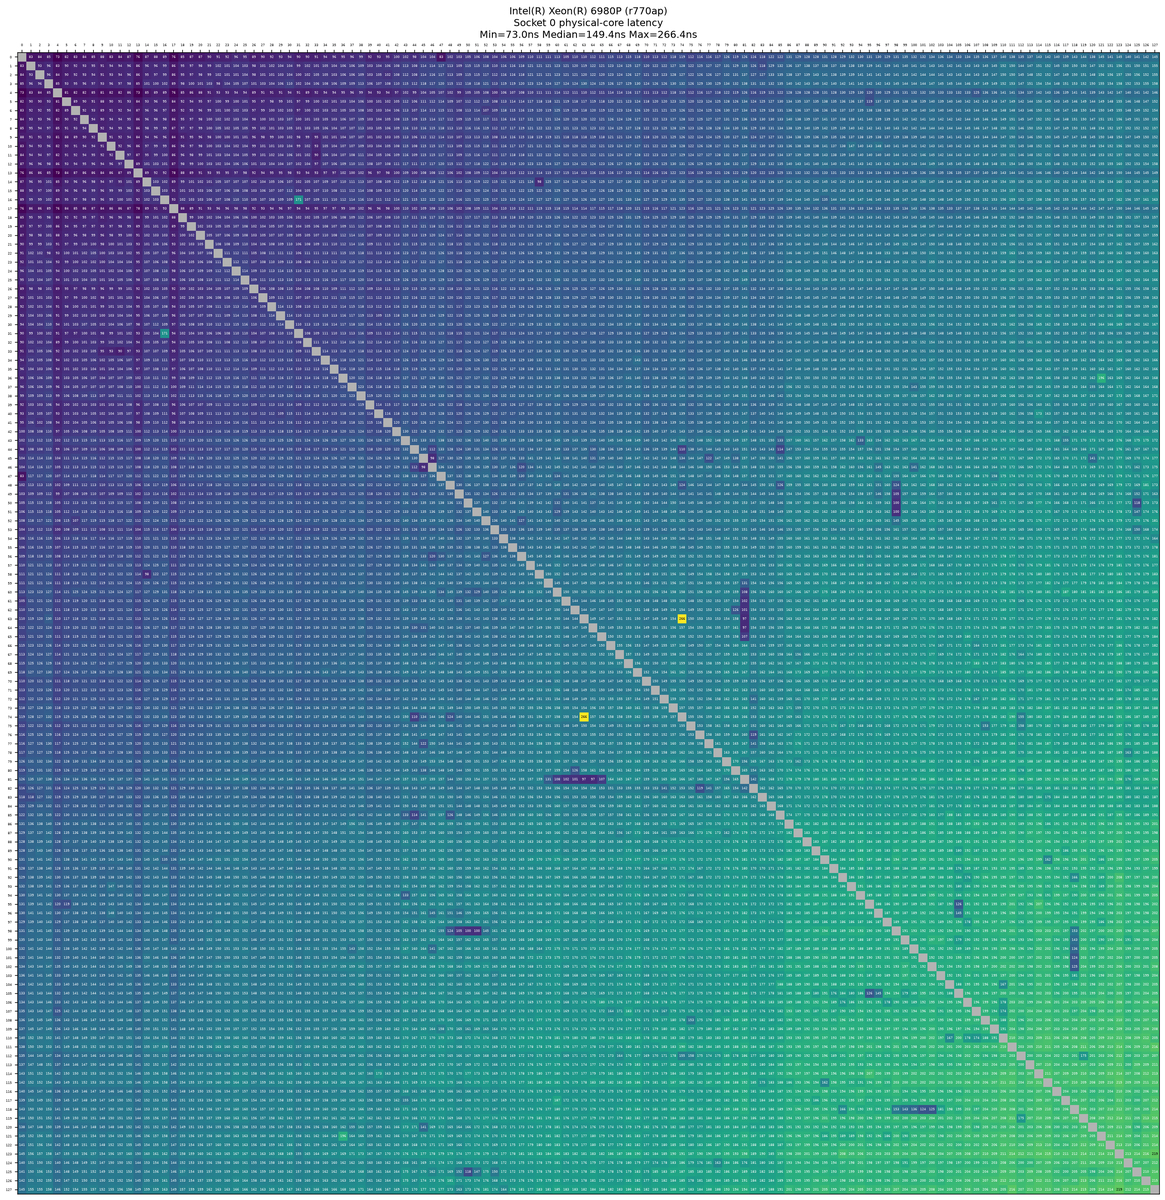
Within socket 0, the median core-to-core latency across all distinct physical core pairs is 149.4ns. Here is the other socket, socket 1 launching from the same point:
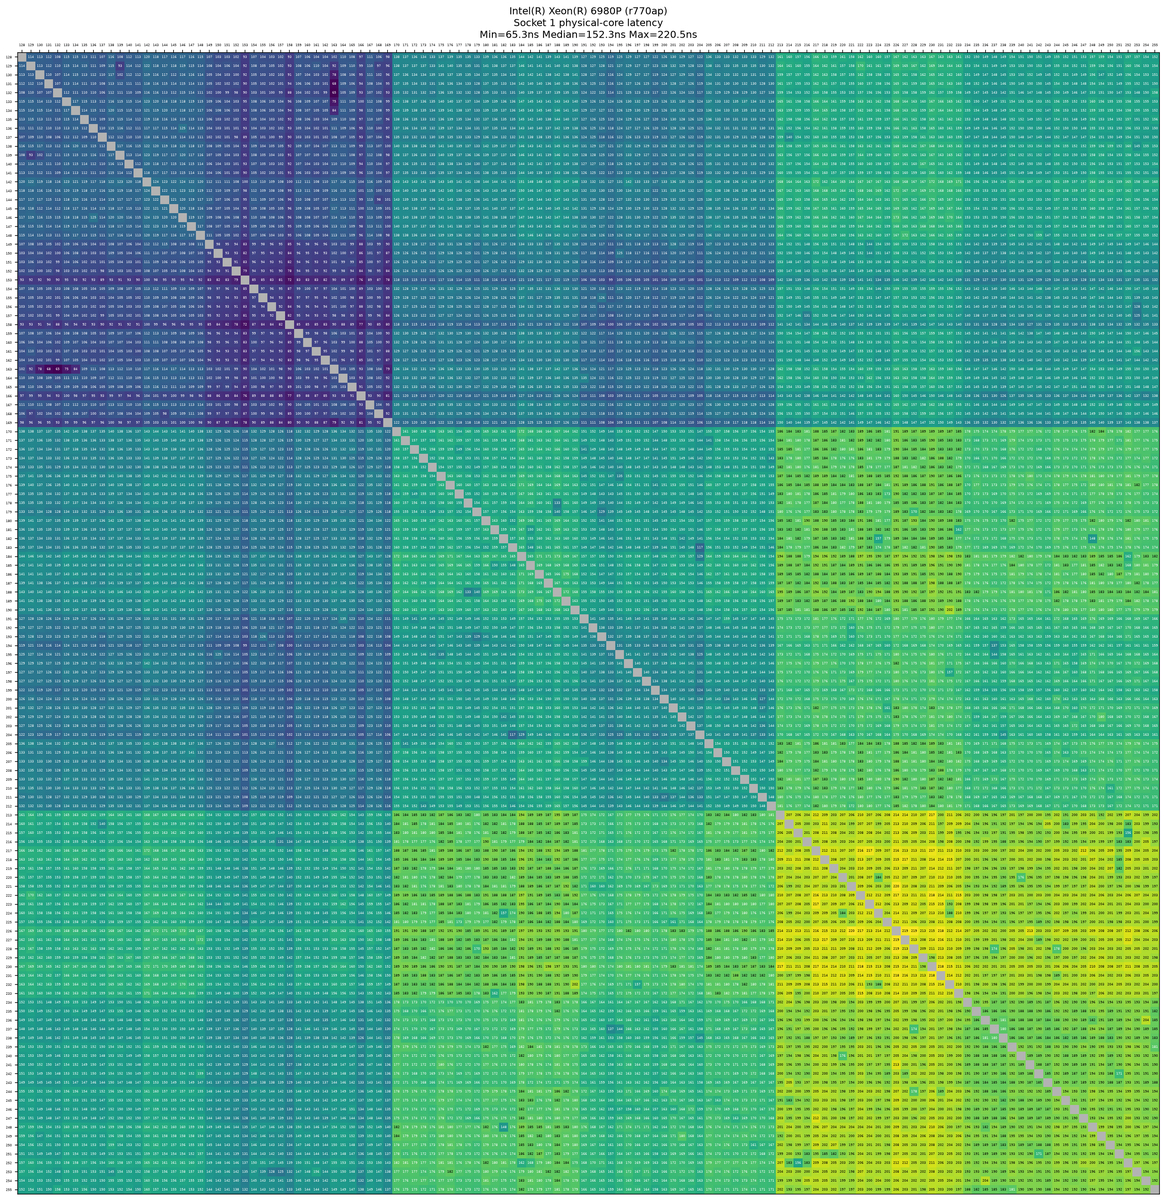
For socket1 physical-core pairs, the median latency was 152.275ns with a minimum of 65.346ns and a maximum of 220.454ns. Socket0 showed a similar pattern with a median of 149.374ns. These numbers reflect intra-socket core-to-core communication latencies. Now it is time to put this all into a 256×256 heatmap to show cross-socket latencies.
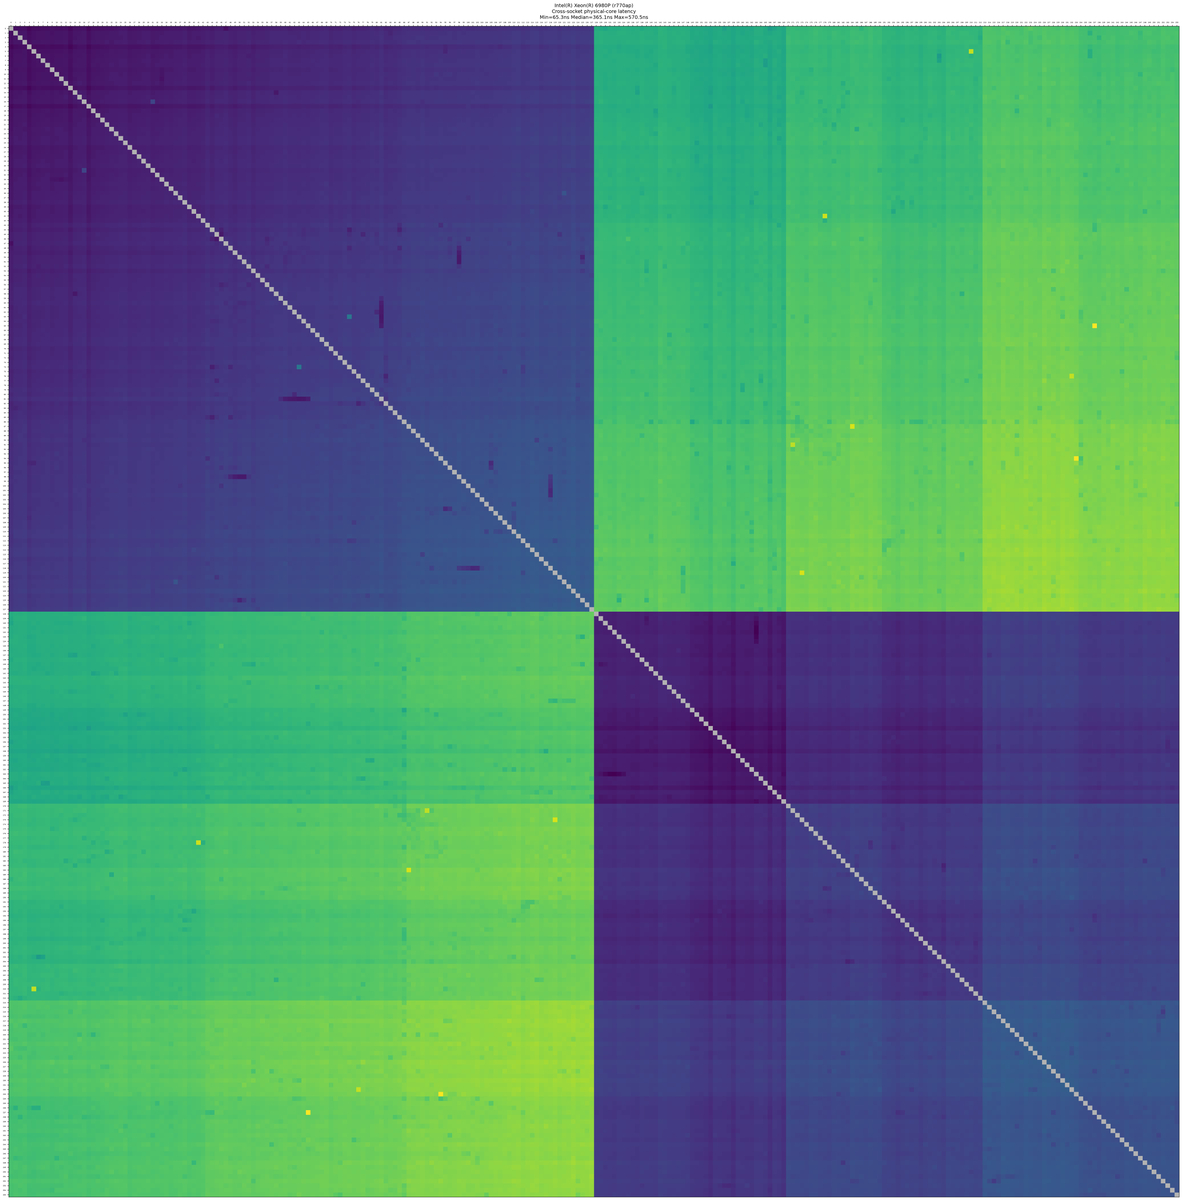
When folks talk about the benefits of single-socket systems to avoid NUMA penalties across sockets, this is a big part of what they mean. We got a very reasonable result, but there is a hit going to the remote socket.
Next, we ran a multichase sweep through the memory hierarchy.
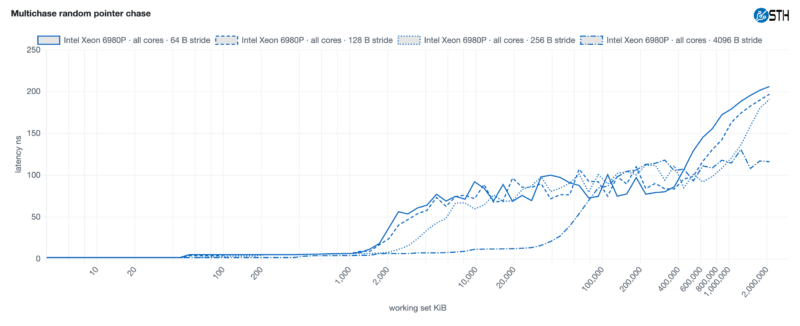
I think we will start using this over lmbench in the future.
AgentSTH V7 Performance
AgentSTH is our agentic CPU benchmark suite that exercises workloads resembling modern AI agent orchestration rather than traditional HPC kernels. We use a weighted geometric mean of raw subtest throughput scores, with the AmpereOne A192-32X as the reference baseline at 1000.
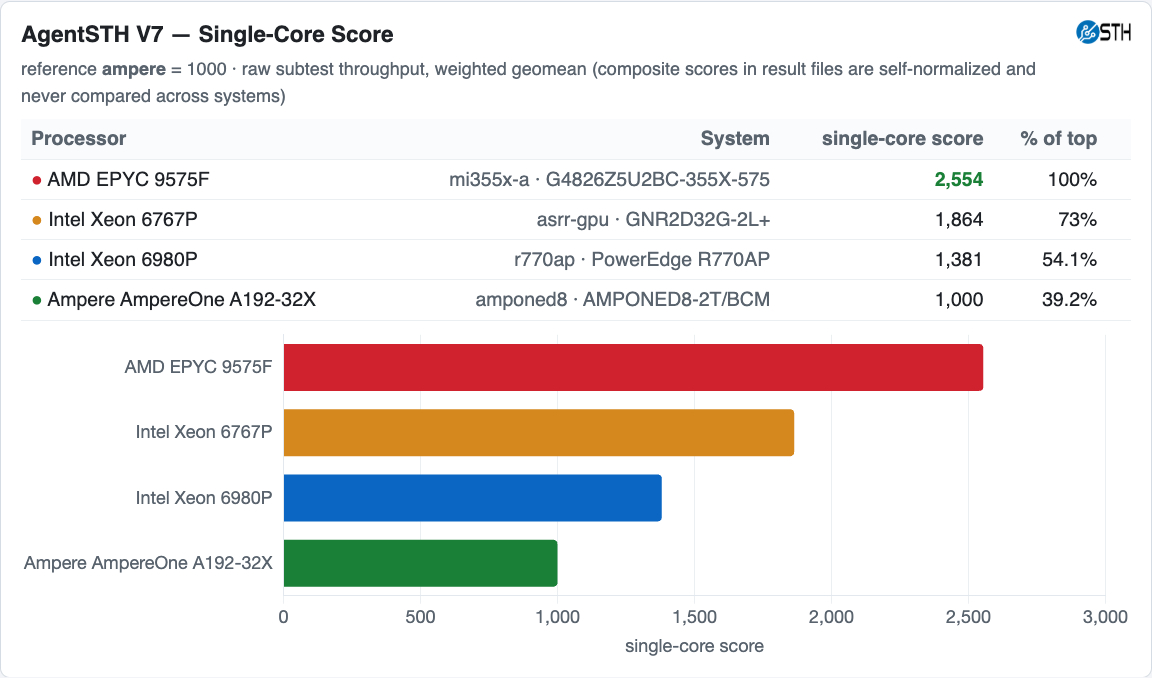
In a server-only single-core cohort normalized to AmpereOne A192-32X at 1000, we get much higher performance on the Intel Xeon 6 systems. You may be wondering about the Xeon 6767P versus 6980P here, and it is probably helpful to remember that the TDP per core is higher on the 350W/ 64 core part than the 500W/ 128 core part. That shows in a 20% higher base clock, for example. Likewise, the AMD EPYC 9575F has a much higher base clock, higher turbo clock, and a much higher TDP per core. If you are reading this and thinking that the better comparison would be ot the EPYC 9755, the answer is yes, but we need to cycle those chips through the system again with the final AgentSTH V7 runs.
The AgentSTH V7 split sweep uses a fixed total of 512 logical workers across all configurations. The aggregate benchmark index rises from 17827 with one agent to 40863 with two agents, then 105533 with four, 158696 with eight, and reaches 198880 with sixteen agents.
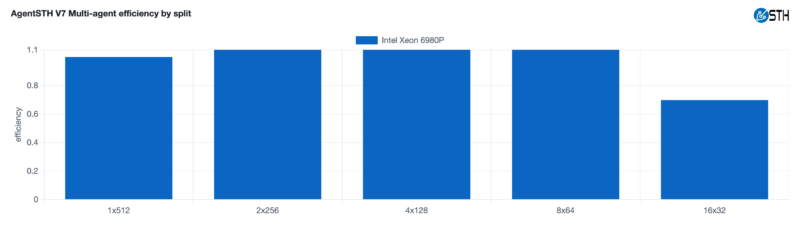
You will notice that the splits actually increase performance as we better localize access. On big chips like these, that can have a huge impact on performance.
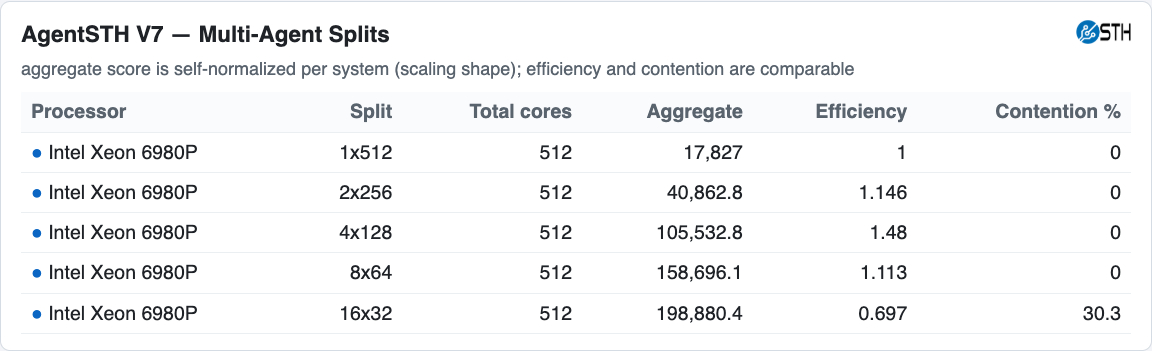
The highest aggregate among tested splits is 16×32 at 198880, which is about 11.16 times the single-agent score of 17827. The best mean per agent comes from 4×128 at 26383, while 16×32 has a lower mean of 12430 and a benchmark contention metric of 30.3%, as scaling to more copies increases net performance but decreases overall efficiency. These aggregates are self-normalized within this system.
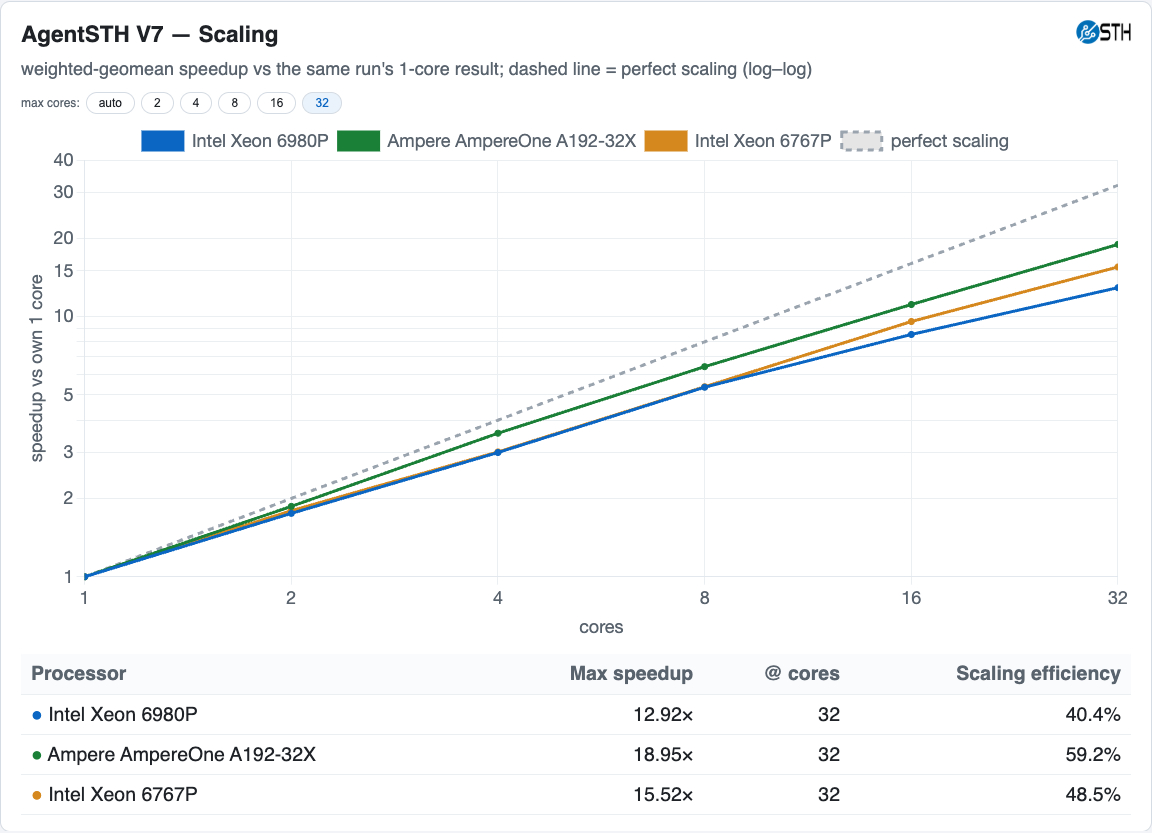
Going the other way and scaling an instance of AgentSTH V7, we see the smaller socket scales a bit better by 32 cores, which makes sense given the other slices we have. AmpereOne scales well here, but it also provides lower performance per core, as it was designed for cloud-native workloads. In the near future, we will show more on how this scales to the full socket.
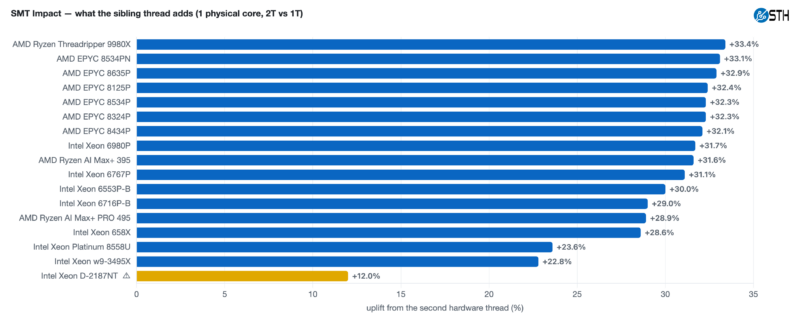
One last view we wanted to give was the impact of SMT on these runs. The Intel Xeon 6980P is somewhere in the middle of the pack when it comes to the scaling we get from SMT. On the Xeon 6980P we are getting around 31.7% net uplift from SMT being on, which is very strong for an Intel CPU.
Estimated SPEC CPU2026 Performance
Again, I just wanted to reiterate that the SPEC CPU2026 performance we show is the same benchmark suite, but using an LLVM 22 and -O3 optimization setup, not the more highly optimized setups you see on official published results. If you want to see the official numbers, you should look at those. We run at a much lower optimization level common across CPU architectures.
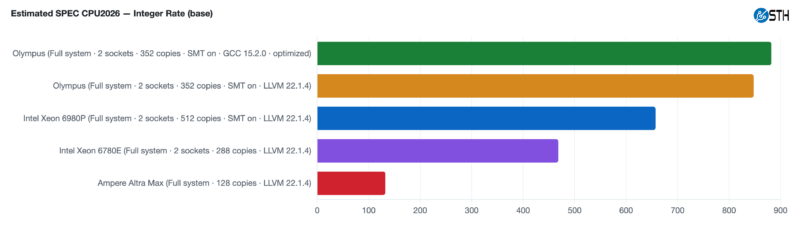
Starting with the Integer rate base case, you can see that the Intel Xeon 6980P is quick, but I wanted to bring in two data points here. First, the 128-core Ampere Altra Max, which is only single-socket, but it at least shows a fairly large gap between that and the Xeon 6980P. The P in the Xeon model number means Performance, and you can see the gap to a more cloud-native core performance level clearly here. Perhaps more interestingly, we pulled in some of the dual-socket NVIDIA Vera CPU numbers. When NVIDIA discusses its performance advantage per core with its PCIe Gen6 generation of CPUs this is what they mean.
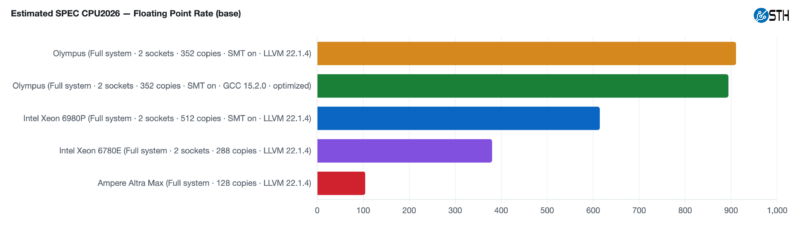
Vera benefits from a newer core, a fast LPDDR5X memory subsystem, and so on, which helps here. Of course, it would be neat if there were a new CPU to compare this to soon.
Next, let us get to the power consumption.