AMD EPYC 7F52 Performance
For this exercise, we are using our legacy Linux-Bench scripts which help us see cross-platform “least common denominator” results we have been using for years as well as several results from our updated Linux-Bench2 scripts. Starting with our 2nd Generation Intel Xeon Scalable refresh benchmarks, we are adding a number of our workload testing features to the mix as the next evolution of our platform.
At this point, our benchmarking sessions take days to run and we are generating well over a thousand data points. We are also running workloads for software companies that want to see how their software works on the latest hardware. As a result, this is a small sample of the data we are collecting and can share publicly. Our position is always that we are happy to provide some free data but we also have services to let companies run their own workloads in our lab, such as with our DemoEval service. What we do provide is an extremely controlled environment where we know every step is exactly the same and each run is done in a real-world data center, not a test bench.
We are going to show off a few results, and highlight a number of interesting data points in this article.
Python Linux 4.4.2 Kernel Compile Benchmark
This is one of the most requested benchmarks for STH over the past few years. The task was simple, we have a standard configuration file, the Linux 4.4.2 kernel from kernel.org, and make the standard auto-generated configuration utilizing every thread in the system. We are expressing results in terms of compiles per hour to make the results easier to read:
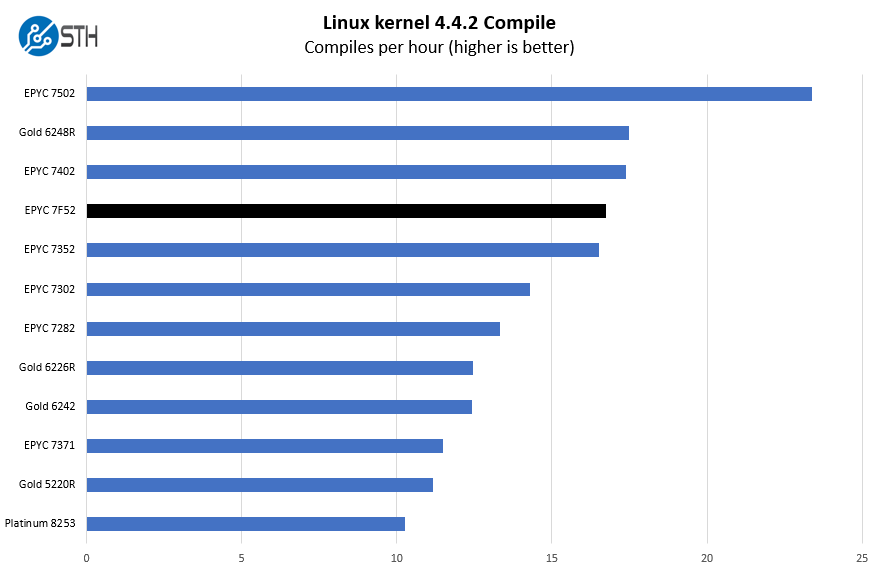
This result may both be surprising, but will also set a tone for the rest of the section. The AMD EPYC 7F52 is not going to be the lowest cost per unit of performance on these charts. If all we cared about was the hardware cost of a server, the AMD EPYC 7352 and EPYC 7402 are much better buys.
Instead, we are looking at per-core performance here which means we want to look at 16 core parts like the EPYC 7302. Here, there is a big gap, although nowhere near the size of the delta between the list price of the chips. That is the unique frequency optimized segment nuance in our evaluation.
c-ray 1.1 Performance
We have been using c-ray for our performance testing for years now. It is a ray tracing benchmark that is extremely popular to show differences in processors under multi-threaded workloads. We are going to use our 8K results which work well at this end of the performance spectrum.
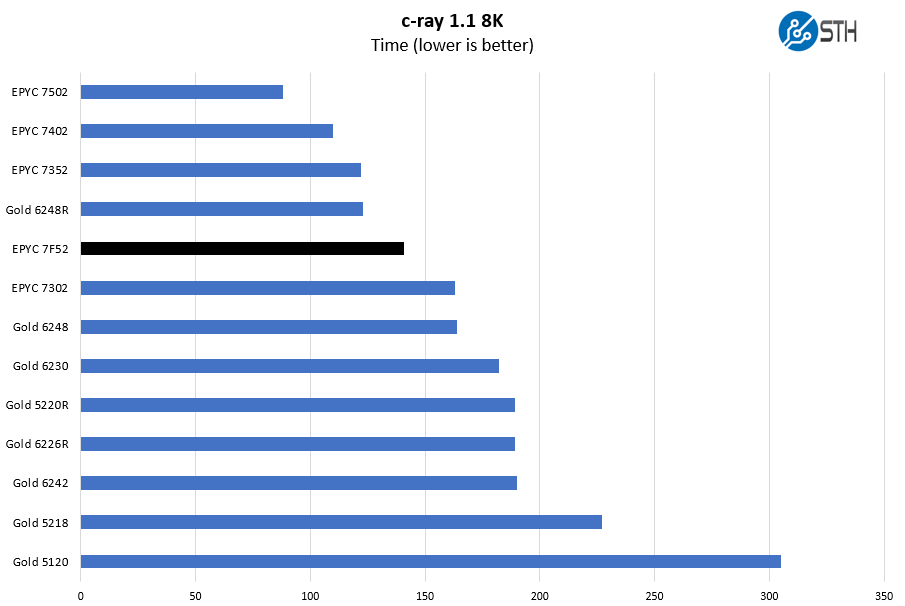
Here we see another large gap open up over the EPYC 7302, the mainstream 16-core part. One can also look to the Xeon Gold 6242/ Gold 6226R for other 16 core mainstream parts to get a sense of how Intel Xeons fare.
7-zip Compression Performance
7-zip is a widely used compression/ decompression program that works cross-platform. We started using the program during our early days with Windows testing. It is now part of Linux-Bench.
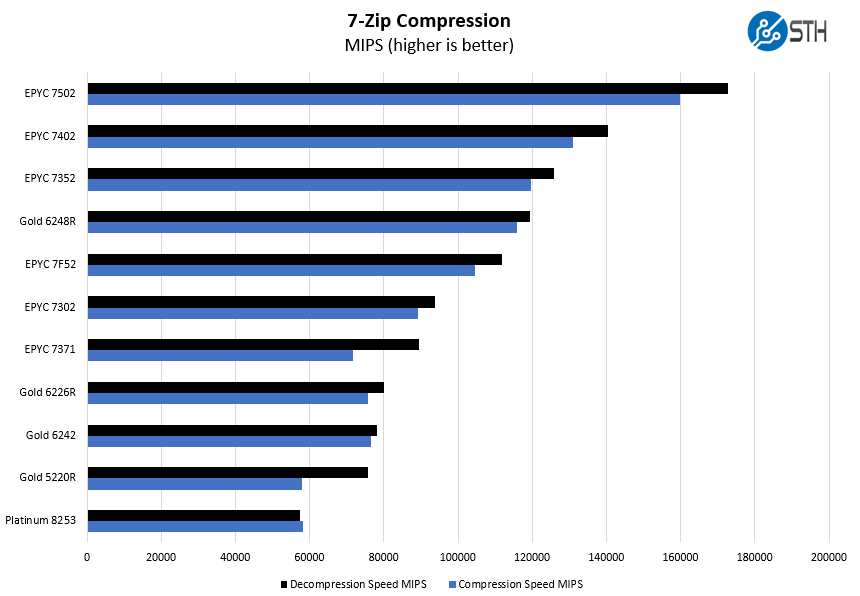
Here we wanted to draw attention to the EPYC 7371 to EPYC 7F52 comparison. As revolutionary as the EPYC 7371 was when it was released, the EPYC 7F52 is a big improvement.
NAMD Performance
NAMD is a molecular modeling benchmark developed by the Theoretical and Computational Biophysics Group in the Beckman Institute for Advanced Science and Technology at the University of Illinois at Urbana-Champaign. More information on the benchmark can be found here. With GROMACS we have been working hard to support AVX-512 and AVX2 architectures. Here are the comparison results for the legacy data set:
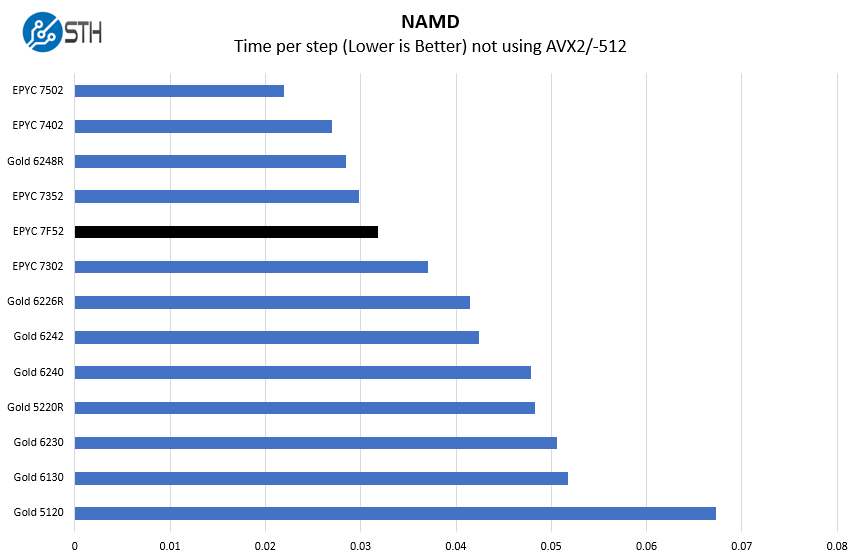
Here again, we see a very large gap open up over the other 16-core parts. The EPYC 7352 is a 24-core part, another quirk of the “Rome” naming conventions. The EPYC 7302 and 7352 may seem close, but the EPYC 7352 has 8 more cores. When the EPYC 7F52 gets close to the EPYC 7352 it is closing in on making up an 8 core delta.
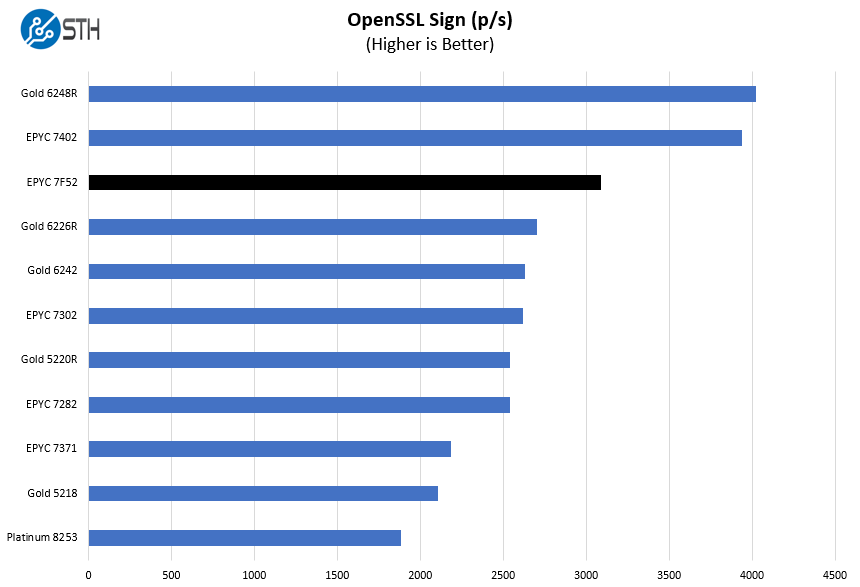
OpenSSL Performance
OpenSSL is widely used to secure communications between servers. This is an important protocol in many server stacks. We first look at our sign tests:
Here are the verify results:
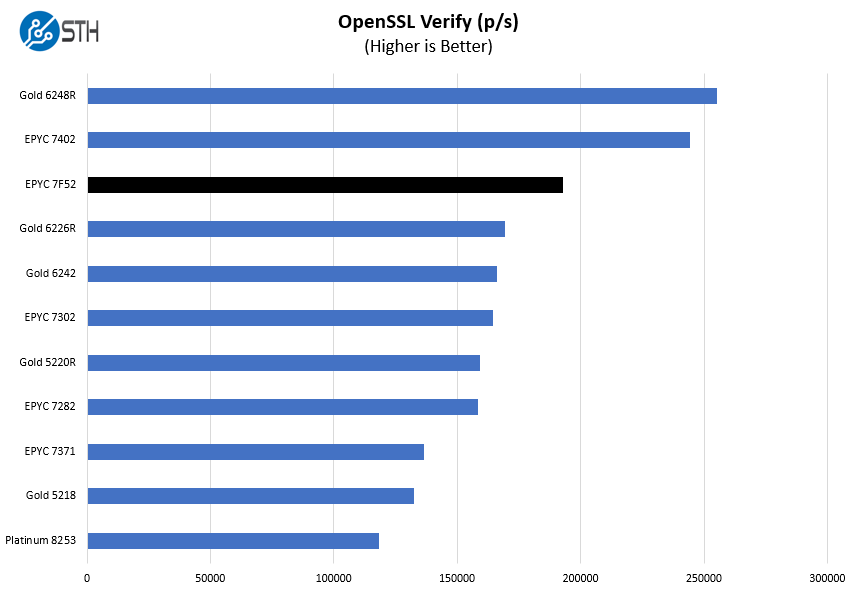
Here Intel performs very well. The Gold 6226R is a lower-clocked part. When we see the gap between the Gold 6226R and the EPYC 7302 we get a sense of how this will look with the Gold 6246R.
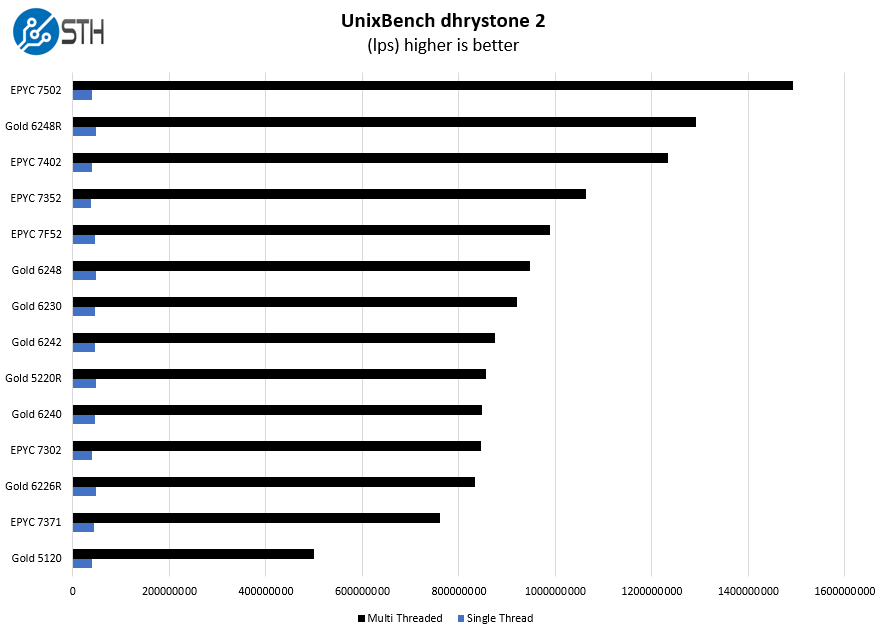
UnixBench Dhrystone 2 and Whetstone Benchmarks
Some of the longest-running tests at STH are the venerable UnixBench 5.1.3 Dhrystone 2 and Whetstone results. They are certainly aging, however, we constantly get requests for them, and many angry notes when we leave them out. UnixBench is widely used so we are including it in this data set. Here are the Dhrystone 2 results:
Here are the whetstone results:
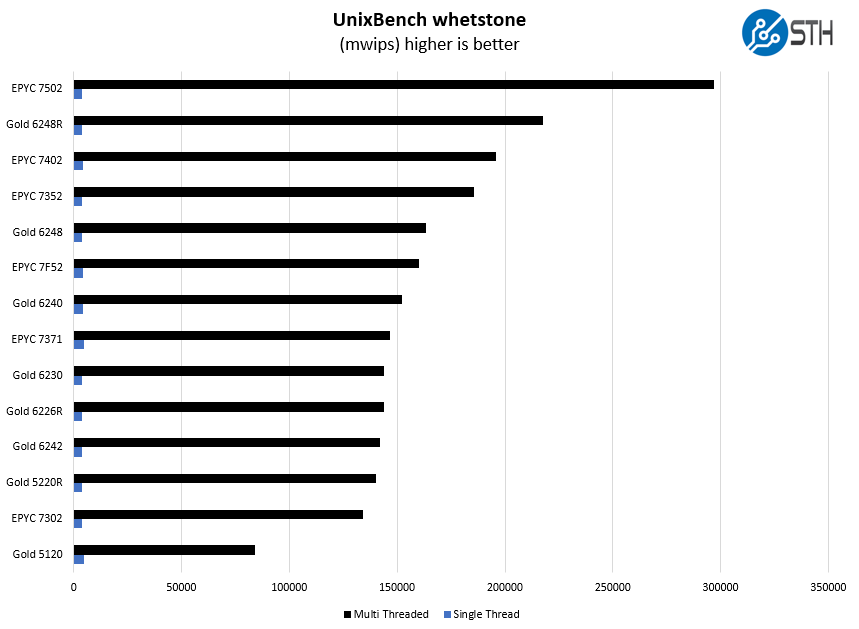
Here we see performance of the EPYC 7F52 well above the Xeon Gold 6240. While the Gold 6240 is a pre-refresh part, it is also an 18 core part.
Chess Benchmarking
Chess is an interesting use case since it has almost unlimited complexity. Over the years, we have received a number of requests to bring back chess benchmarking. We have been profiling systems and now use the results in our mainstream reviews:

In this workload one can see the EPYC 7F52 put a large gap between it and some of the 16 and 24-core competitors. This is a workload that has less of a memory impact and is more impacted by cores and clock speeds.
STH STFB KVM Virtualization Testing
One of the other workloads we wanted to share is from one of our DemoEval customers. We have permission to publish the results, but the application itself being tested is closed source. This is a KVM virtualization-based workload where our client is testing how many VMs it can have online at a given time while completing work under the target SLA. Each VM is a self-contained worker.
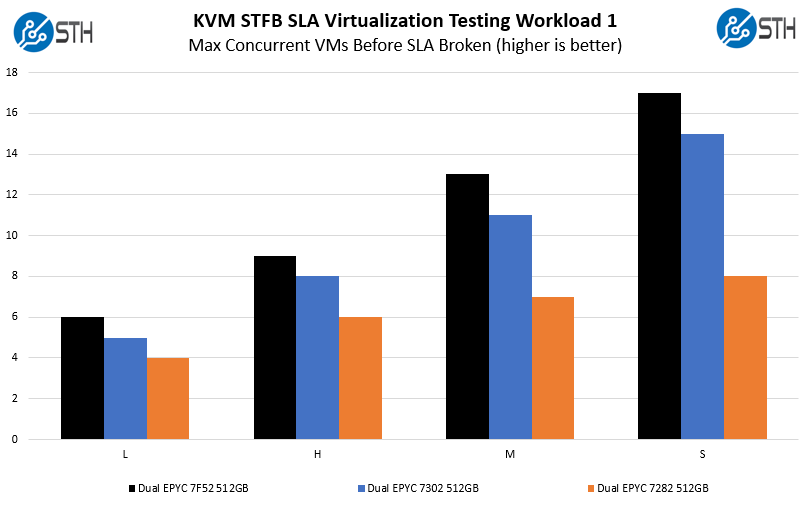
We first wanted to show the AMD EPYC 16-core lineup here using 512GB. At some of the larger VM sizes, memory capacity can become a limiting factor. As one can see, the constrained memory bandwidth and low cache levels on the AMD EPYC 7282 hurt that solution in this workload while the EPYC 7F52 shows why it is significantly faster than its stablemates.
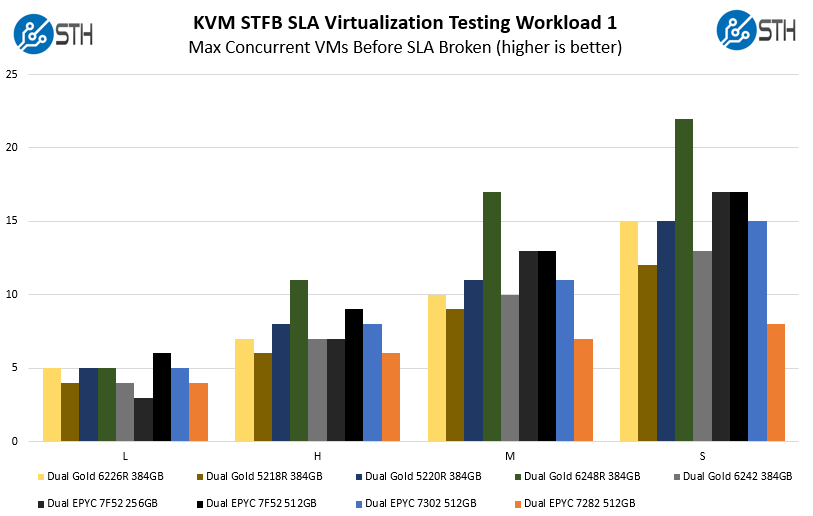
Here we can see the EPYC 7F52 perform extremely well against a collection of its peers. The Large VMs tend to be very memory-constrained which is why we see the 256GB EPYC 7F52 configuration perform poorly. As we move to smaller VM memory footprints, the EPYC 7F52’s large caches help keep the VMs working at an acceptable rate. It cannot rival a 24-core high-end Xeon Scalable Refresh part like the Xeon Gold 6248R, but the exercise here is performance per core not necessarily absolute performance.
SPECrate2017_int_base
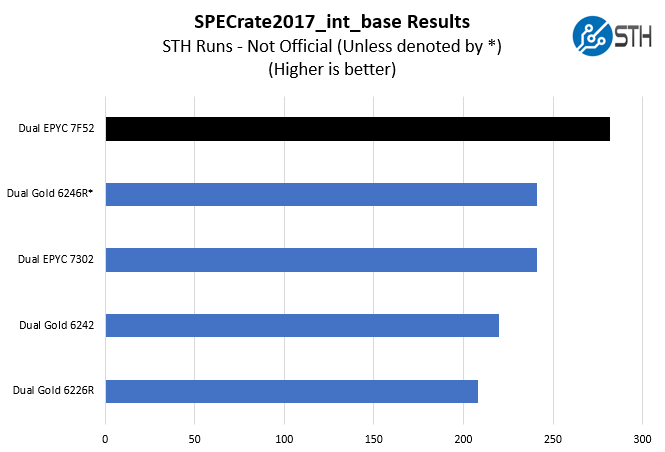
The last benchmark we wanted to look at is SPECrate2017_int_base performance. Specifically, we wanted to show the difference between what we get with Intel Xeon icc and AMD EPYC AOCC results.
Server vendors get better results than we do, but this gives you an idea of where we are at in terms of what we have seen:
A few quick and important notes here:
- These are not vendor official results. For official results, see the official results browser.
- We are about 1.5-2% behind where AMD is with their estimates in marketing materials. That is close enough that we think that AMD is likely near what server vendors will publish.
- We did not have dual Intel Xeon Gold 6246R’s for testing. Instead, this is a figure published by Dell using the Dell EMC PowerEdge R740xd platform we reviewed. It is the only official result here and denoted with an (*).
This is perhaps the biggest metric server buyers use in the space and AMD is performing very well here which seems to match the results we saw in our test suite.
Next, we are going to get into the “so what” and discuss market positioning for the new products before giving our final words.


These are the SKUs that should be thought of as True Workstation class parts and the higher clocks are welcome there along with the memory capacity and the full ECC memory types support.
So what about asking Dell and HP, and AMD, about any potential for that Graphics Workstation market segment on any 1P variants that may appear. I’m hoping that Techgage can get their hands on any 1P variants, or even 2P variants in a single socket compatible Epyc/SP3 Motherboard(With beefed up VRMs) for Graphics workloads testing.
While in the 7F52 each core gets 16MB of L3 cache, that core has only 2048 4k page TLB entries which only cover 8MB. It would be interesting to see how much switching to huge pages improves performance.
I find the 24 core part VERY interesting, just wish they released P versions of the F parts.
Your 16 core intel model is wrong.
16 cores from a 28 core die could still be set up to have the full 28 cores worth of L3 Cache.
Hi Jorgp2 – this was setup to show a conceptual model of the 16-core Gold 6246R which only has 35.75MB L3 cache, not the full 38.5MB possible with a 28 core die
Hi ActuallyWorkstationGrade, if you are going to convince HPE/Dell about 1CPU workstation then IMHO you will have hard fight as those parts are more or less Xeon W-22xx competitive which means if those makers already do have their W-22xx workstation, then Epyc workstation of the same performance will not bring them anything. Compare benchmark results with Xeon W-2295 review here on servethehome and you can see yourself.
Sometimes I read STH for the what. In this “review” the what was nowhere near as interesting as the “why”. You’ve got a great grasp on market dynamics
whats the sustained all core clock speed
I have said it before and this release only highlights the need for it:
You need to add some “few thread benchmarks” to your benchmark suite !
You are only running benchmarks that scale perfectly and horizontally over all cores. This does not massage the turbo modes of the cores nor highlights the advantages of frequency optimized SKUs.
In the real world, most complex environments are built with applications and integrations that absolutely do not scale well horizontally. They are most often limited by the performance and latency of a lot fewer than all cores. Please add some benchmarks that do not use all cores. You can use exisiting software and just limit the amount of threads. 4 – 8 threads would be perfectly realistic.
As you correctly say, the trend with per core licensing will only make this more relevant over time. Best is to start benching as soon as possible so you can build up some comparison data in your database.
Comments are closed.