
Look, we hear you. On every mini workstation review, AI system review, GPU review, server review, or even with memory surcharges on your routers. Before memory pricing went wild, memory was our #1 hardware cost. Now, it is hard to even afford to buy memory for the systems we want to deploy. Since we have to deploy this year’s servers, I had a thought: what if we could use AI to strike back at memory pricing? The idea was simple. We could use AI to profile how much memory we were actually using and to build a business case for buying and deploying our servers. There were three key questions. First, we needed to figure out how much memory we are actually using. Putting more memory into machines was a luxury of the “before times,” when the cost of overprovisioning was relatively low. Now, we just cannot afford to do it, as it would mean deploying fewer nodes. Second, we needed to figure out how to lower the cost of the memory capacity we need to deploy, without compromising performance. Third, if we did lose some performance by choosing a lower-cost memory configuration, we wanted to know whether those savings could buy enough additional cores or systems to more than offset the loss. To many, that might sound scary, or maybe like something that only we can do because we have a testing lab. Instead of just saying “do this,” we thought we would give you some thoughts on how to profile your environment, then some data points on how memory population matters.
AMD provided the EPYC CPUs (we have to say this is sponsored), which we had to use because we wanted 12-channel 2DPC capabilities. Admittedly, it will underpin a portion of our analysis. Since I wanted this to scale beyond just higher-end EPYC, we also used a Xidax Threadripper system we received for another project, as it came with two DIMMs and seemed prime for continuing our analysis. Let us get to it.
Profiling Workloads Small to Massive
These days, most people already have some kind of infrastructure. That might be as small as a VPS or a cloud instance, a lab server, or as large as a fleet of servers. Luckily, no matter what that is, there is some way to monitor memory usage.
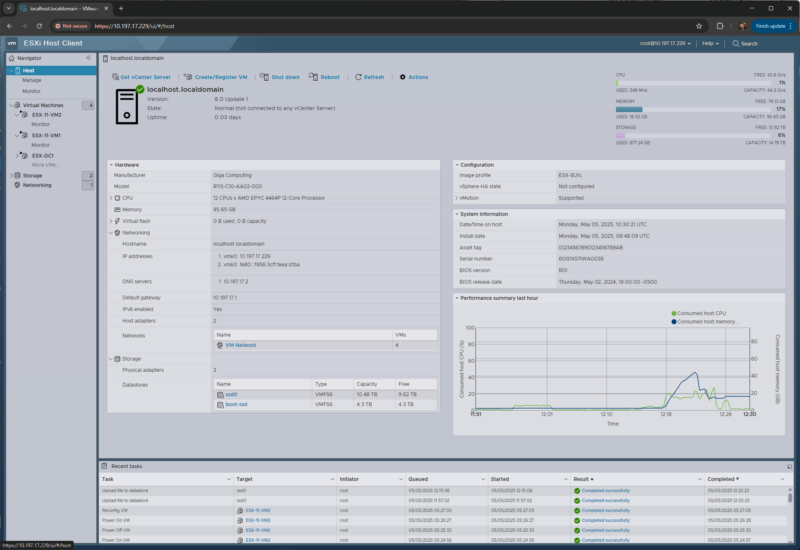
In a VMware environment, the first stop is usually the virtualization layer. ESXi and vCenter can show host memory consumption, active memory, ballooning, compression, and swapping. Those last three are especially important. A host sitting at a high consumed-memory percentage may simply be using memory efficiently, but a host that is ballooning or swapping is telling you that right-sizing has already gone too far. For this exercise, the number we care about is not “how much memory is installed?” It is “what is the sustained and peak working set after we remove caches and normal OS housekeeping?”
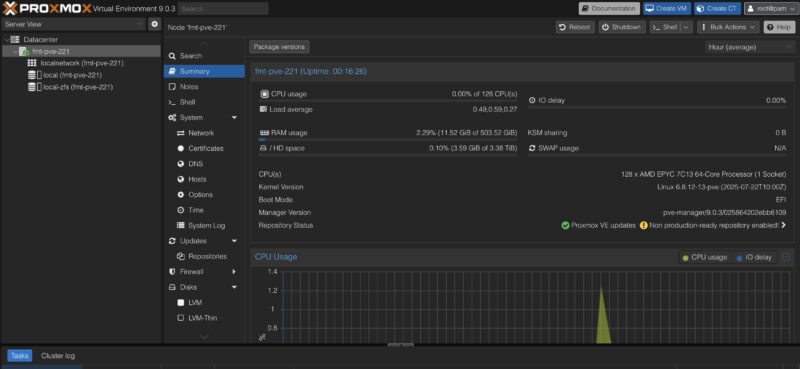
The same concept applies if you are using Proxmox VE, KVM, Hyper-V, Nutanix, XCP-ng, or another virtualization stack. At the host level, look for memory pressure, swap activity, ballooning, and NUMA imbalance. At the guest level, look at the OS view: Linux `MemAvailable`, page faults, swap in/out, PSI memory pressure, cgroup or container memory limits, and Windows committed bytes, working set, and hard faults. The dangerous shortcut is to look at “free memory” and assume the rest is required. Modern operating systems aggressively use memory for cache because unused DRAM is wasted DRAM. That cache can often be reclaimed. A database buffer pool, a JVM heap, or an AI inference service with pinned memory is a different story.
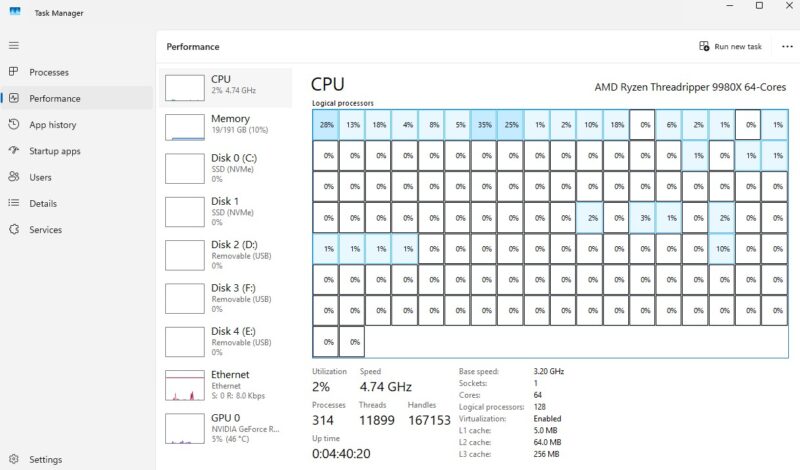
For a single workstation or a small server, even Task Manager, Resource Monitor, `top`, `htop`, `free`, `vmstat`, `sar`, or Netdata can get you started. The trick is to collect data over the right window. A five-minute snapshot is not a capacity plan. A month that includes backup windows, patching, index rebuilds, model loads, month-end jobs, and customer traffic peaks is much better. For fleets, this is where Prometheus plus node_exporter, Grafana, Telegraf, Zabbix, Datadog, New Relic, CloudWatch, Azure Monitor, Google Cloud Monitoring, or your existing observability platform comes in. In Kubernetes, the story extends to kube-state-metrics, cAdvisor, container memory requests and limits, and whether pods are being OOM-killed or throttled. There are, of course, other tools that you may be using, but hopefully you get the idea.
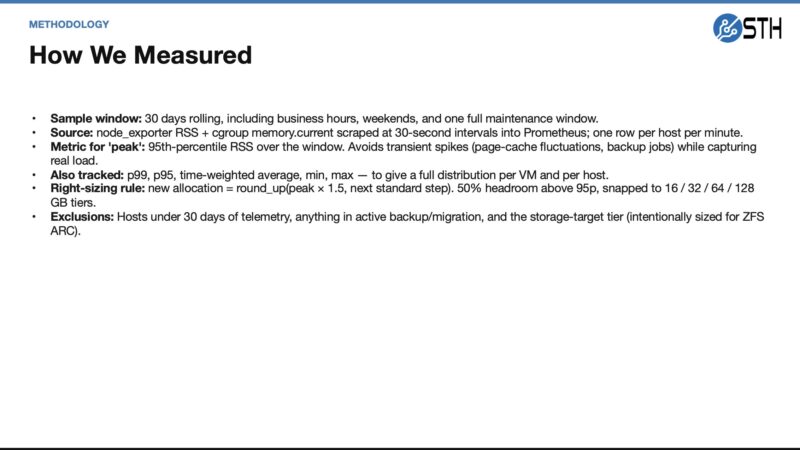
For our pilot, we wanted more than a one-time screen grab. The point was to capture a window that captures normal business activity, maintenance windows, and enough daily variation to avoid right-sizing based on a quiet afternoon.
The output we want from that first step is a capacity target. For example, a server might have 512GB installed, but if its p95 reclaimable-adjusted usage is 170GB and its p99 is 220GB, then buying another 512GB server because “that is what we always do” is expensive muscle memory. Perhaps that workload really needs 256GB plus headroom. Maybe it needs 384GB because it has a quarterly spike. Or the answer might be that it should not be touched because it is a database or cache tier where misses are costly. The point is that we should know which one before we buy memory at 2026 prices.
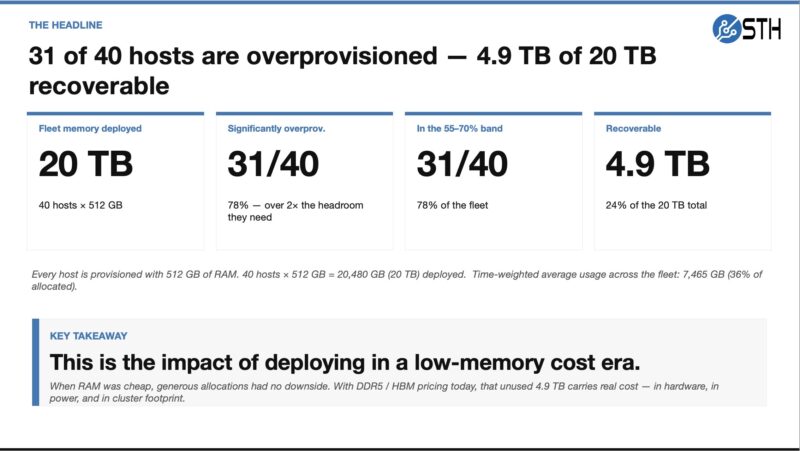
The uncomfortable headline from that first pass was how much memory was deployed because it was historically cheap to overprovision. That is the habit we are trying to put a number on before buying the next wave of systems.
Previously, doing this for a single system or VM was easy. Doing it for a fleet if you have good monitoring is also relatively trivial if you know what you are doing, because this is a very common bit of analysis. Using AI to take this data, do analytics, and come up with recommendations is where it becomes ultra useful. You can use a modern AI agent (on a decently large model) to summarize patterns that humans are bad at seeing across hundreds or thousands of virtual or physical machines: which systems never go above 40 percent actual working set, which ones peak only during backups, which VMs have high allocation but low p95 usage, which nodes have swap activity, and which workloads are clearly memory-resident and should be excluded from an aggressive cut. There are many folks who have only a few systems or maybe who are just running a VPS, who do not do this regularly, and doing this is a simple task to get an answer of whether you can move to a smaller VPS and save a few dollars every month. On the other end, there may be people who know VMware but do not know other tools, for example. AI agents help democratize the creation of insights, so long as you can access the data. It still likely requires a human review, no matter how confident the AI agent sounds, but at least it gives you a starting point and a relatively low-cost option to get second, third, and more opinions using different AI agents and prompts.
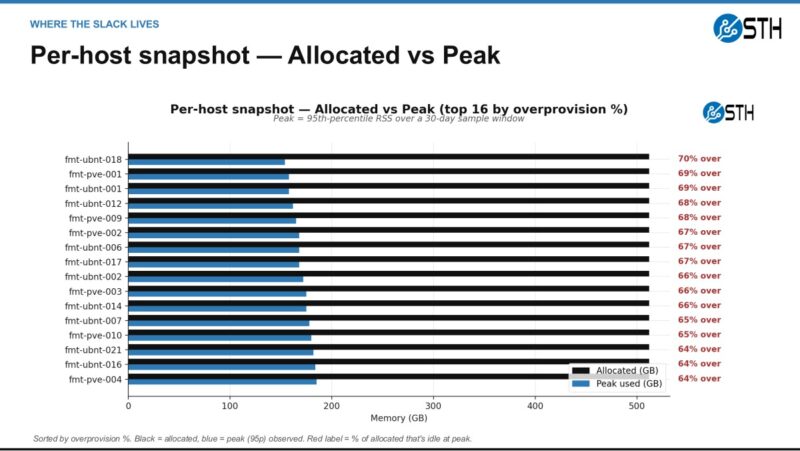
This is also where the visualization matters. A table of hosts can make the issue feel abstract, but an allocated-versus-observed view quickly shows where the slack is concentrated and which systems deserve human review first.
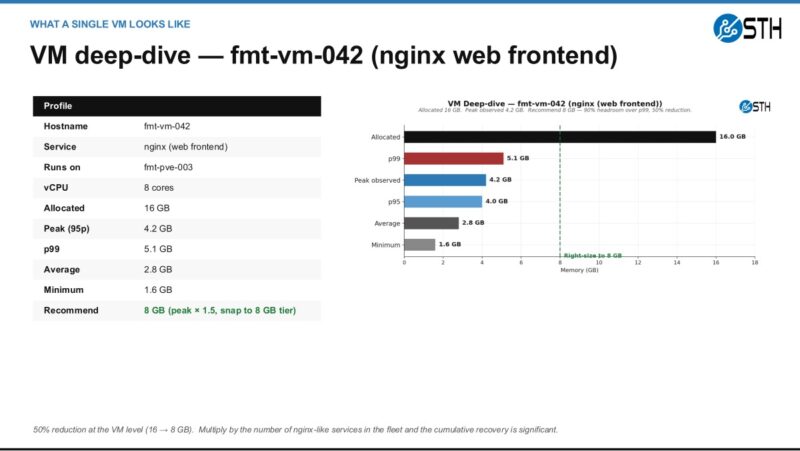
Here is a smaller example of why the agent output should still be reviewed by a person. A web frontend can be an easy candidate for a smaller allocation when p95 and p99 stay far below the current setting, especially if the change is reversible.
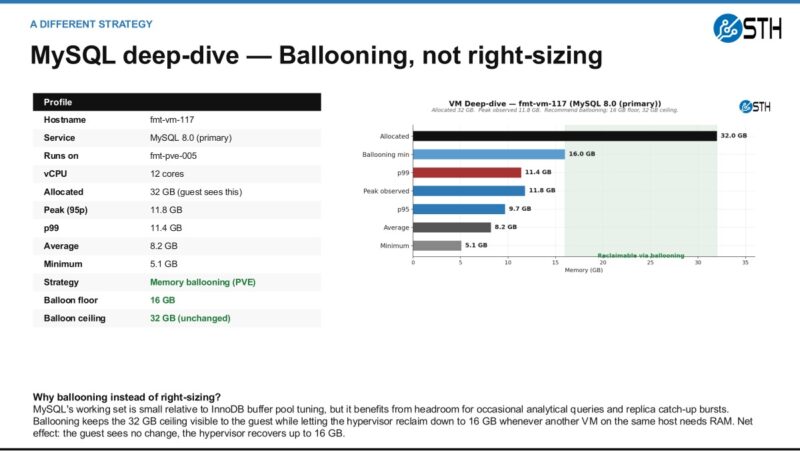
The database example is different. In that case, the better answer may be ballooning or another reversible policy instead of simply cutting the VM down and declaring victory.
At the fleet level, the goal is to turn those individual decisions into a memory recovery plan. The important part is not only reclaiming capacity. It is reclaiming it with enough process that the team trusts the result.
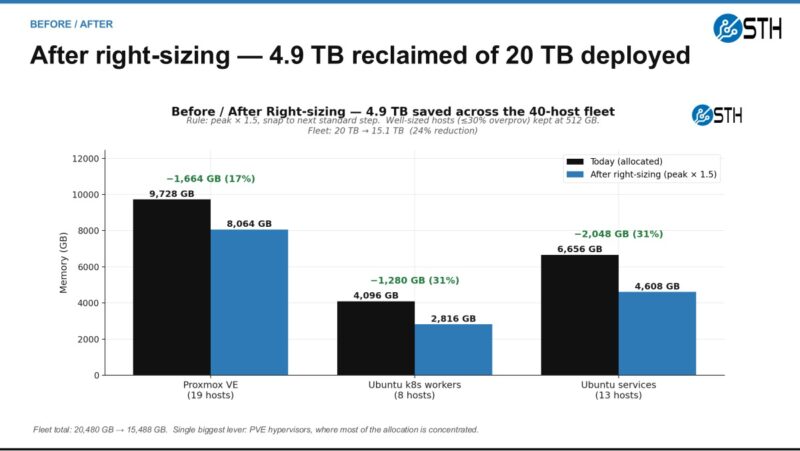
The uncomfortable bit was that we probably overdeployed memory by 25% or so, just because of how inexpensive memory was. In the before times, that was not a big deal, and it was nice to have extra headroom. These days, that can mean the difference between buying several servers for the fleet. Also, before AI, spending the time and resources to do this analysis might have been close to just saying, “deploy a bit extra, it will be fine.” Nowadays, the cost of analyzing data across many systems, VMs, and containers has dropped dramatically, as you can get AI to build Python scripts to analyze it. Again, sanity check results.
With an idea of how much memory we were actually using, the next step was to determine whether we could also optimize how we materialized memory into the systems. Let us get to that next.


This is a really top-tier idea. I’ll say we deployed a firewall with ddr4 instead of ddr5 generation because of the memory
That’s such neat data. Intel and AMD they’ve got similar foils but I’m elated to see there’s some other data for this. We’re using 512G per cpu because we don’t need the extra ram
Good article! But a small criticism, about the conclusion: “For folks running memory-bandwidth benchmarks, HPC codes, in-memory databases, or large analytics pipelines, buy the memory subsystem your workload demands.”
Did someone cut/paste that from your AI output?? I do not see “memory-bandwidth benchmarks” as a common workload, and if you’re doing that, you will obviously be using all the different memory subsystems…
I’m here for page 2
Will this have any effect on my ram stonks?
justsomeguy – I am not a huge fan of STREAM being used for saying how fast one CPU generation is versus another, so that is my little nod to that.
Patrick- Fair point, but I don’t think that text gets it across well (or at all).
Of course, as with every other benchmark, it really depends on what your application is. If it’s heavily dependent on memory bandwidth then STREAM is exactly what you want to use. But I think this topic is really orthogonal to this article, and probably widely agreed on, anyway.
@Patrick Imagine you have benchmark data that also include STREAM, for a plethora of configurations . Then you could throw your AI on the task of finding out which workload (as represented by a particular benchmark) correlates to STREAM performance, and maybe other micro benchmarks, like memory latency (or combination thereof). Then you can categorize workloads as compute bound, bandwidth bound, latency bound, etc. emprically and not just on a hunch. Would be interesting to see.
Or shall I propose that to Phoronix ;)
Nikolay Mihaylov – We have all of that in the more detailed data set. Actually, the AgentSTH is broken down by throughput bound, memory bound, and etc categories. It also runs lmbench on configurations. We had to do that profiling so that way we did not end up with an odd mix and weighting. The ultimate goal is to get something more like Geekbench that folks can run and get a composite score, and then see breakdowns of each.
All good if you want to propose it to Michael. I always enjoy getting a beer with him and we text often.
Skimming the wall of text and I still have no idea what to buy :)
I found this very interesting. Those users of large-scale servers probably found this very helpful and probably intuitive, but it’s really nice to have empirical data to back up what we “think” is the right architecture. For the small workstation user this is less helpful, but still good to know from a $ investment perspective.
Well done, thanks