

SPEC CPU 2026 vs SPEC CPU 2017
We also wanted to provide a quick look at how SPEC CPU 2026 compares to SPEC CPU 2017. There is a lot of data out on SPEC CPU 2017, so we thought it would be interesting to just run the systems across the two back-to-back and check for deltas. It should be noted that the scores from the two benchmark suites are not directly comparable, and there is no official “scaling factor” or between the 2026 and 2017 scores. With that said, this is useful for highlighting how the relative positioning of each system changes between SPEC CPU 2017 and SPEC CPU 2026.
Starting with a single copy of SPECrate, here are our 1T results.
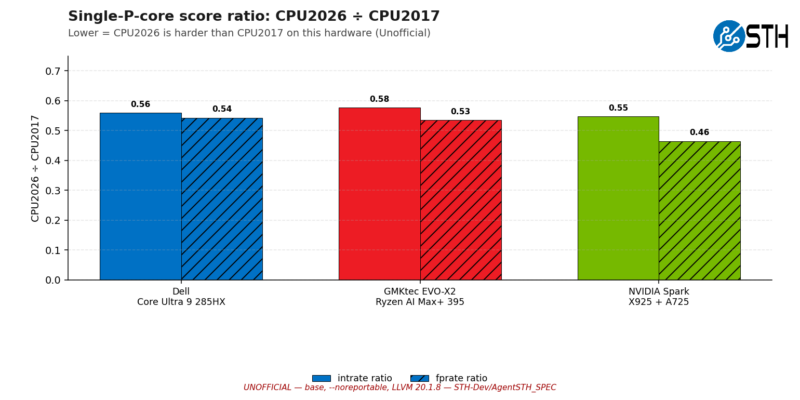
For integer workloads, the performance ratios are all rather similar. That is, under SPEC CPU 2026, all three systems achieve scores between 55% and 58% of their 2017 scores. The drop-off in floating-point performance is more pronounced, however. Not only is there a bit more of a drop-off, the Intel system hits just 54% of its 2017 score, and it drops from there. The NVIDIA Arm system takes a more significant hit, with a 2026 score that is just 46% of its 2017 score. In practice, this means the NVIDIA system has lost some ground to AMD and Intel in SPEC CPU 2026 compared with where it stood under SPEC CPU 2017. (This despite the fact that it delivered the best 1T performance overall in 2026)
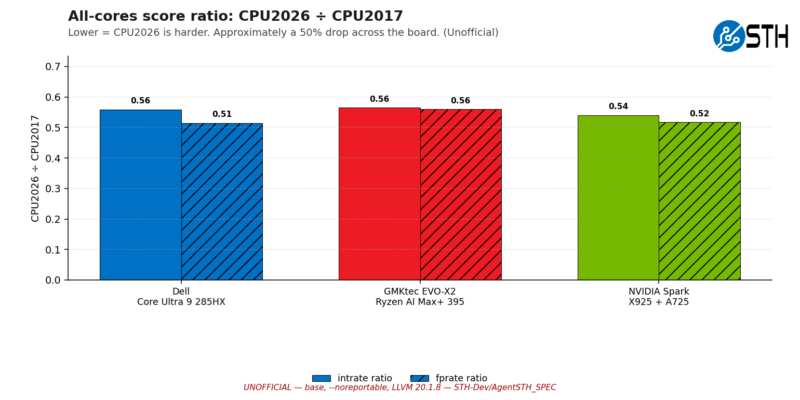
Meanwhile, the ratios for running multiple copies of SPECrate are a bit more consistent. Everything here is still in the 50% range, indicating that SPEC CPU 2026 is stressing multi-core throughput to a similar degree as it did single-core throughput. Also, nothing here loses ground by more than 51%. Even the NVIDIA Arm system hits 52% of its 2017 fprate performance in 2026 fprate.
Ultimately, these numbers will vary with system architectures and configurations, so this should not be taken as a rule of thumb for other systems. It goes to show that across these Arrow Lake, Strix Halo, and GB10 chips, all three systems largely retain their relative positioning. In short, while SPEC CPU 2026 significantly modernizes the benchmark suite’s underlying workloads, so far, we are not seeing it change how contemporary CPUs compare to each other.
Final Words
While the term “bigger and better” is undoubtedly overused in this industry, in the case of SPEC CPU 2026, that is about as apt a description for the benchmark suite as one can possibly give it. With 52 modern benchmarks encompassing over twice as many lines of code, and with workloads intended to scale with the capabilities and memory capacities of recent processors, SPEC CPU 2026 is both bigger than before and a better representation of modern computing workloads.
Looking at our initial benchmark results, at first blush, the latest CPU benchmark suite does not appear to be a massive departure from the previous version. While the bulk of the suite’s individual benchmarks are completely new, the overall geomean scores are pretty consistently around 50% of SPEC CPU 2017, and that holds for both integer and floating-point workloads.
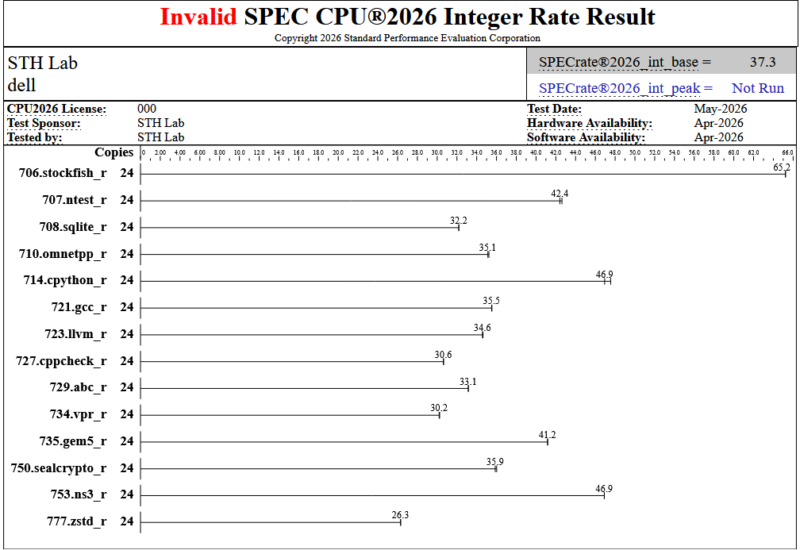
With the caveat that this kind of scaling is not guaranteed with different CPU architectures and systems, the high-level takeaway is that while SPEC CPU 2026 is more intensive overall, it has not significantly shifted the relative positioning of the Intel, AMD, and NVIDIA chips we benchmarked for this article. Which is to say that while SPEC CPU 2026 gives us additional (and very valuable) data points on how these chips compare, it is not currently changing the established pecking order among desktop chips. Also, we must note that since we are using LLVM here, we would expect companies to enter with compiler optimizations that go beyond what we are seeing. This was just LLVM20, but LLVM22 is slightly different, and some companies have more optimized compilers.
Even if SPEC CPU 2026 does not bring any wild swings to the current world of CPU benchmarking, after nine years since the release of the previous version of the industry’s top benchmark suite, it is nice to have an updated version with more contemporary workloads. Especially as the industry moves on to designing and evaluating the next decade of CPUs.



If I understand the “Scaling, fprate” chart correctly, the “ideal Nx” line is nonsense for the Intel and nVidia systems. The *actual* ideals for those systems is variously 8x, 16x, or 10x for their different core types. And by adding the aggregates from both P and E cores, you have a good number for total system performance, but an utterly useless number for measuring scaling for a particular core type, which is what a first glance at that chart suggests (incorrectly) it’s about. Which is too bad, because there is an interesting idea there.
I mean, really, in what way is it useful to know that 8P+16E cores can achieve 6.68x the performance of a single E core? It would be much more interesting to know how 16 E cores measure up against 1 E core.
Hey, justsomeguy – I had a similar thought. We have updated charts, but they did not make it into this before it went live because it was a bit of a reflection that led to the thought. Hopefully, it makes it into the next set of content. Here is the idea:
Really, the ideal for heterogeneous processors is the maximum performance of each type multiplied by the number of cores in that type, and summing those. That is still not perfect, but it is closer to what you are thinking.
One other one to call out is that on the AMD side, you have 1c/1t and then multiply it by the number of threads, so 16 cores, but 32 threads. I do not think anyone expects SMT to be the same performance as a physical core, so saying 32 times that 1c/1t result is also a bit odd for “ideal” if you start going down a weighted ideal for heterogeneous cores. Is the base then the 1c/2t number? Is it then 1c/2t minus 1c/1t for an ideal SMT thread and calling that a “core” for our weighting?
All good thoughts and feedback. Another very valid point is that we are running these at lower compiler optimization levels than in the official runs. That is actually by design, but there is always a fair question of whether we should do more optimization.
Patrick – My first message originally had some thoughts about threads vs. cores but I removed them before posting as I wanted my main point to be clear and unelaborated. But since you bring it up…
I like your notion of 1c2t-1c1t as a base, but I think that you need to take a step back first and ask, what are you actually trying to do? Do you want to understand an architecture and maybe learn something about whether the choices made in it were good ones? Or do you want to build as good a picture as you reasonably can of what a machine’s performance profile is? These are two not entirely compatible goals, though there is clearly a lot of overlap. Once you decide, that answers some of these questions, or at least narrows down the answers.
In particular, in the second case, it really doesn’t matter what those computations come out to. All that really matters is what you actually measure.
Hey justsomeguy and Patrick, I think in the end what matters is what performance one should expect from a processor and also what one expects from a certain architecture. And here one should add with really bold letters – at what price and at what power level. Considering the last remark, the scores depicted here should also account for the fact that you tested thermally constrained systems – you didn’t test open air systems with an unrestricted thermal solution. Therefore you also test the capabilities of an overall system manufacturing and its cooling solution. To go back to the conversation of the performance expectations, one should also consider why we have p and e cores and of course multithreading. The concept of heterogeneity is to better handle some aspects indirectly related to performance – it is all about efficiency. If you take efficiency (perf/watt) out of the scope, then I find the expected scaling basically wrong. If you take a workload that has the characteristics mostly suited for a p-core and then use it in multiple cores, it does not make real sense to me to consider the scaling beyond the maximum of p-cores – what you may gain from a number of e-cores running alongside is just an added bonus (which may also not be ideal in certain use cases). In the same context, multithreading is used to exploit certain characteristics of the workloads to use the same underutilised resources for multiple processes/threads. In that context, I would consider the 1c/1t as the baseline, the theoritical maximum to be the number of cores and if a workload manages to achieve performance above that level, then this is to be a welcome bonus. Anyway, since you provide the raw data, anyone can make his/her own readings and take your analysis as one aspect that he/she may accept or not. In the end, taking out the dell laptop from the equation, I find that the other two platforms are generally not…. general purpose. So one may focus on the exact applications that they are intended for and not look at the overall results to make what the numbers mean. For example, I would not expect anyone to buy an nVidia Spark system to run gem5 or use it as a database server, although I would expect that the performance of Python and AI related stuff are very important.