SPEC CPU 2026 Performance
For our initial look at SPEC CPU 2026 performance, we did a quick sweep of systems that we had still on Ubuntu 24.04-based OSes, that were available immediately, and that were similar-ish. We knew that the initial passes would take days to run, and only had a few days until today’s embargo lift. We have included the following machines based on a “walking around and seeing what is available for the project” methodology:
- Dell Pro Max 16 Plus – Intel Core 9 Ultra 285HX (Lion Cove + Skymont)
- GMKtec EVO-X2 – AMD Ryzen AI Max+ 395 (Zen 5)
- NVIDIA DGX Spark – NVIDIA GB10 (Cortex-X925 + Cortex-A725)
All three systems include 128GB of RAM, ensuring they have enough memory to run the benchmark suite and putting them on roughly equal footing in terms of memory capacity. The Dell Pro Max 16 Plus has Qualcomm’s AI accelerators onboard (review coming), so actually, these might be a useful comparison set on the AI side.
In terms of performance, we have attempted to select a system as similar as possible, but at the end of the day, the Dell is a laptop system, whereas the other two systems are small form factor desktops. So this should not be taken as an entirely apples-to-apples (or Apple-to-apples) comparison. Still, it gives us a look at roughly similar x86 systems, as well as a rather high-performance Arm system. Importantly, here, we also wanted to test on the P and E cores of the architectures. We had an AmpereOne 192-core system running, but because we were actually running a 2×2 test matrix of LLVM20 and LLVM2022 compiling and running CPU2017 and CPU2026. Starting that test matrix only late last week, it was not completed in time for the embargo lift today.
Please note that these are unofficial scores, and per the SPEC run rules, should be considered estimates only. All of this testing was conducted under Ubuntu 24.04, using the most recent stable build of the LLVM compiler, 20.1.8. We are testing the base performance rates, not the peak rates. We will leave the LLVM22 data for another day.
First up, let us take a look at SPEC CPU 2026 SPECrate scores with a single instance (1T) running. We have run these benchmarks on both the P cores and E cores of their respective architectures when the latter are available.
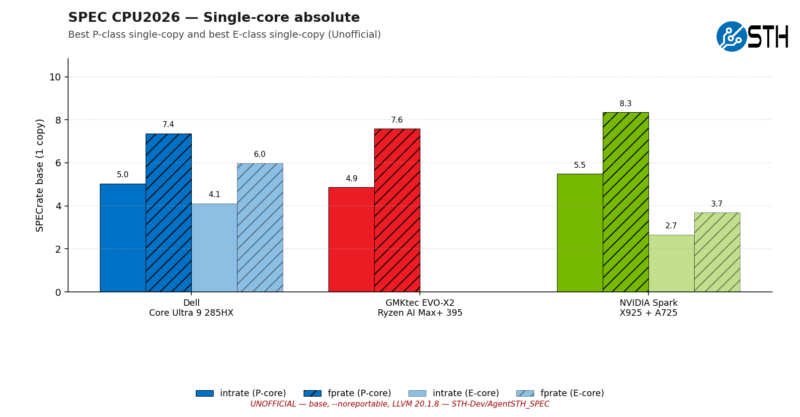
Off the bat, with a new benchmark suite and a new reference machine, scores are much lower. In intrate 2026, the fastest CPU core for this single-threaded workload among our trio is the Arm Cortex-X925 in the NVIDIA GB10 processor. Even then, that is just 5.5x the performance of the circa-2018 reference machine.
On the whole, when comparing P cores, the NVIDIA box delivers the best performance in both integer and floating-point workloads, outscoring the next-fastest box, the Ryzen AI Max+ 395-powered Evo, by about 10%. Otherwise, it is notable how neck-and-neck the two x86 systems are here, with Intel and AMD trading the lead in integer and FP performance, respectively.
As for the E cores, this data also handily illustrates how Intel and NVIDIA have very different performance profiles for their respective E cores. While the Skymont E cores in the 285HX chip perform reasonably close to the full-fat Lion Cove P cores, coming within about 80% of the big core’s performance, the gap on the NVIDIA side is much larger. Here, the Cortex-A725 cores only deliver about 45-50% of the Cortex-X925’s performance.
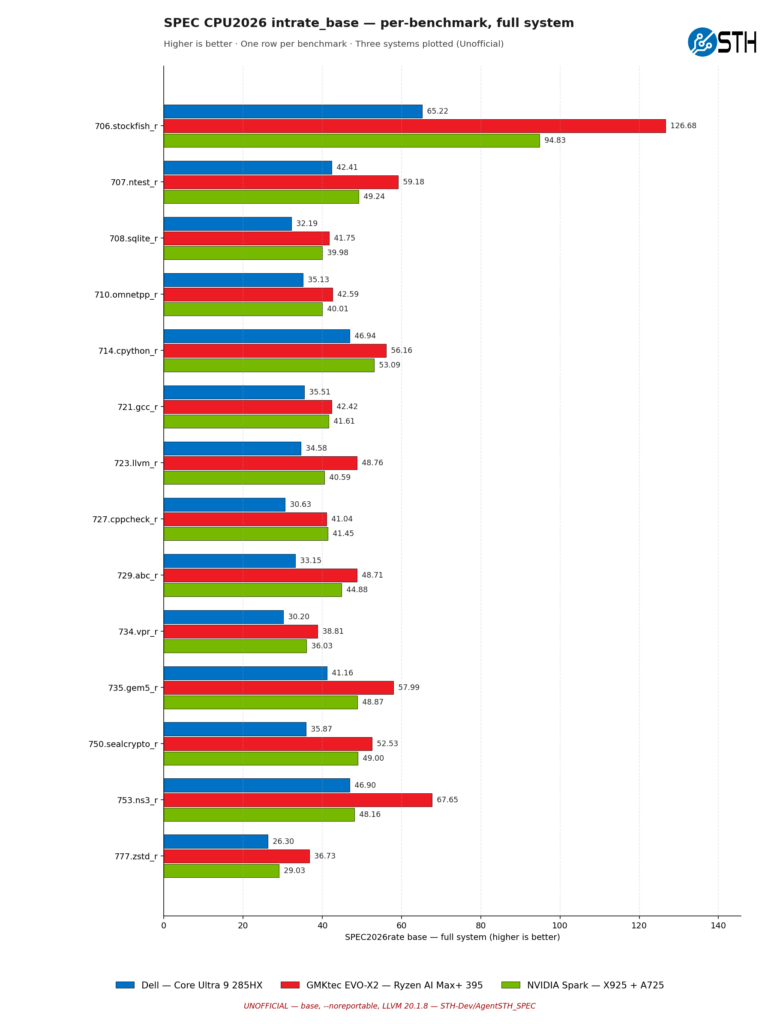
For a bit more analysis, let us dive into the individual benchmark scores, starting with intrate.
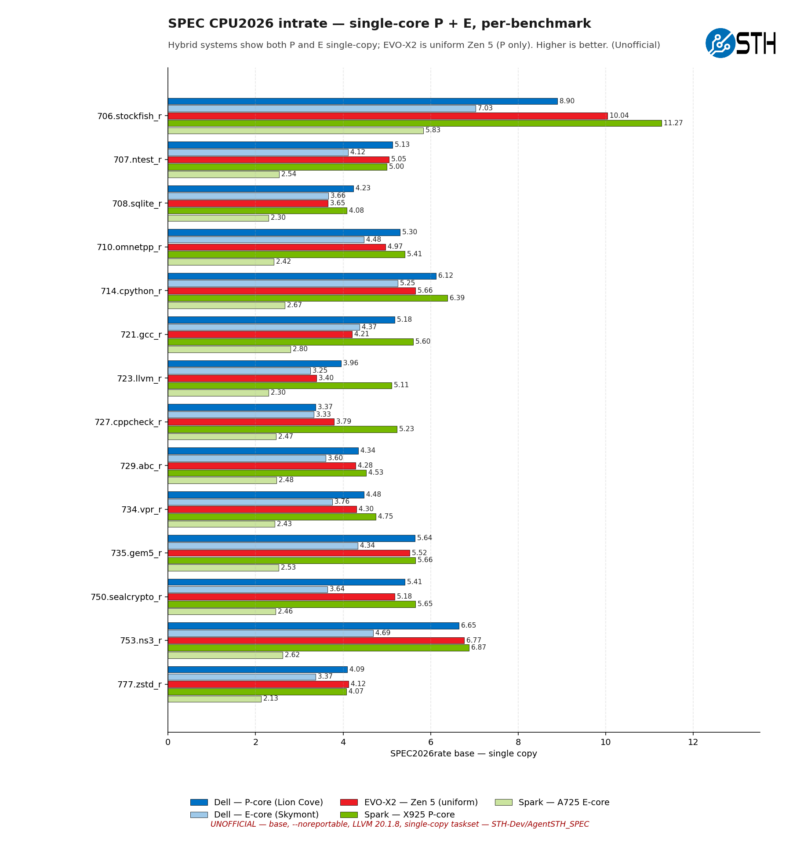
While the Coretex-X925 achieved the highest average score, the results per test are a bit more nuanced. The Arm core inside NVIDIA’s chip does not win in all of the benchmarks, falling behind the Intel and AMD chips on occasion. But only on occasion. It is notable that there are no integer workloads in which the NVIDIA chip loses by a significant margin, whereas there are a couple of tests in which it wins by a significant margin.
Meanwhile, the AMD and Intel chips are generally quite close even at the single benchmark level, though the Intel chip does eke out a couple of wins, particularly in compile benchmarks.
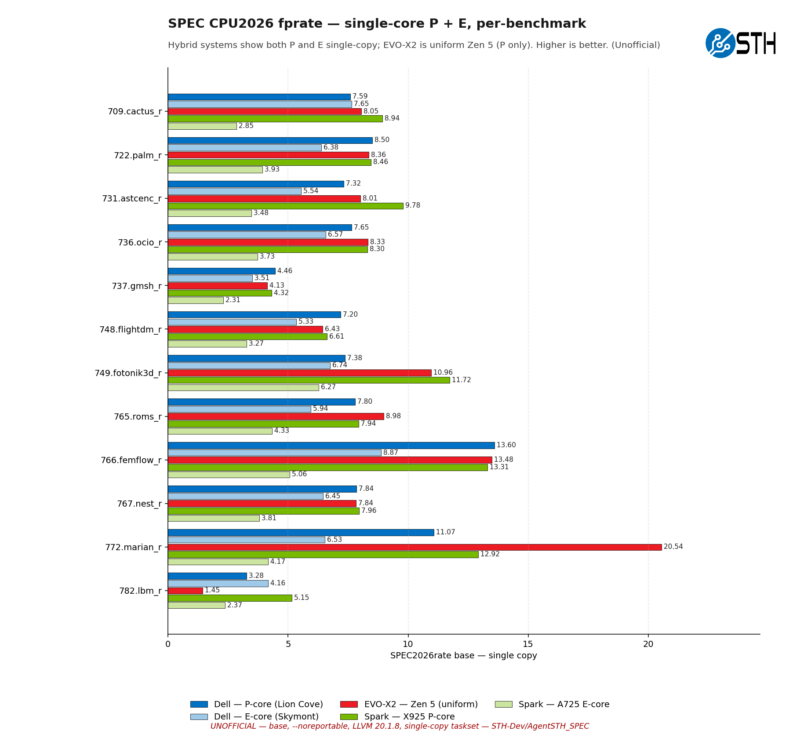
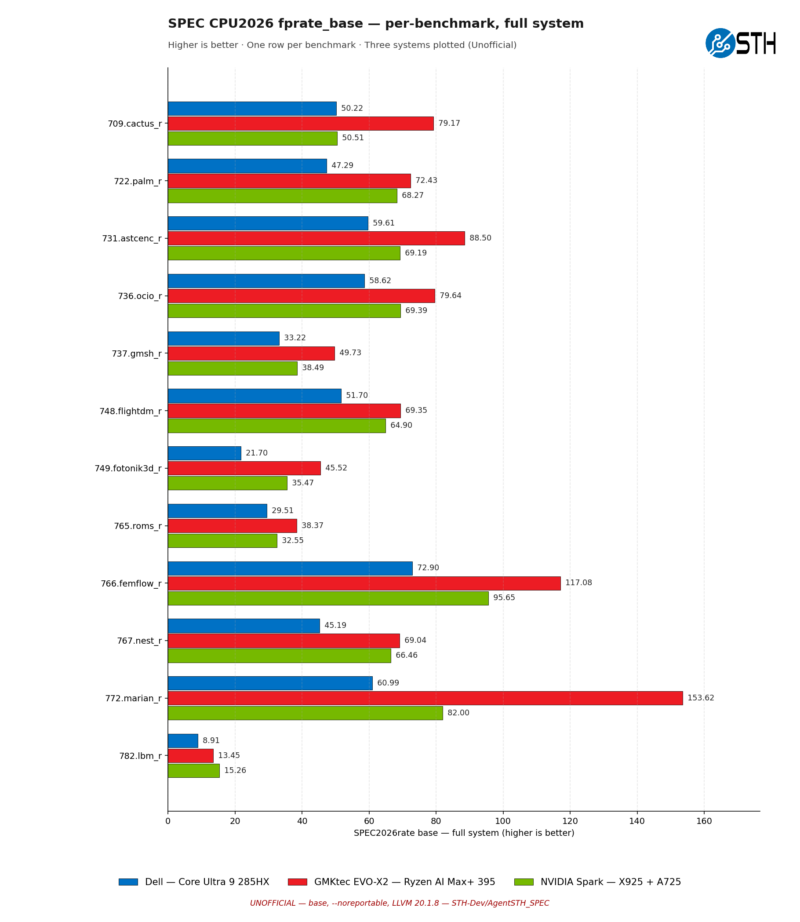
As for floating point workloads, we have a pretty wide field. The Cortex-X925 is not nearly as advantaged here, most notably losing to AMD’s chip in 772.marian_r (a neural machine translation benchmark) by a large margin. Though it is quite interesting that the AMD chip is also well ahead of Intel here, it is a uniquely big win for the Zen 5 chip, counterbalancing the hard dive it takes in the very next benchmark, 782.lbm_r.
Now, let us take a look at CPU performance and total throughput when these CPUs are maxed out, running as many copies of SPECrate as they have CPU cores/SMT slots.
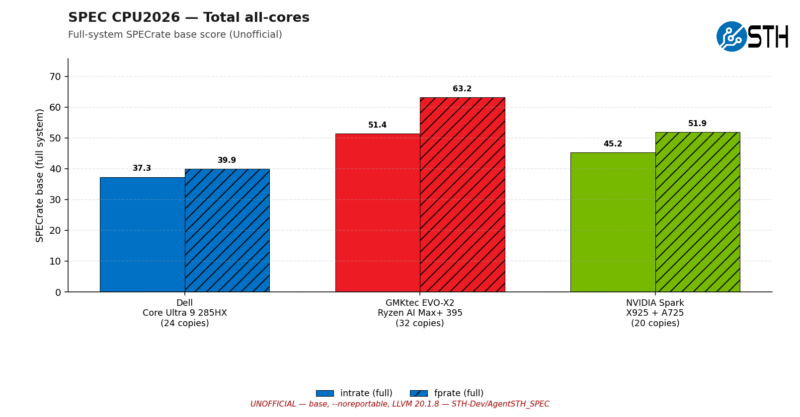
Going with multiple instances of SPECrate and filling up the respective CPUs changes the picture immensely. Saturating the CPUs, the AMD Zen 5 system pulls ahead of both the Intel and NVIDIA/Arm systems for both integer and floating point tests. This is despite the fact that the AMD system technically has the fewest CPU cores at 16, compared to Intel’s 24 and NVIDIA’s 20. The flip side, however, is that the AMD chip is a homogeneous design with 16 P cores, whereas both the Intel and NVIDIA chips achieve their respective core counts with a mix of P and E cores.
Overall, the higher floating-point scores we saw in single-threaded testing have diminished here as these systems have become fully loaded and there is much more contention for cache and other memory resources (not to mention power and thermal budgets).
Looking at the individual score breakouts once more, we now find that the AMD system is winning all but one of the integer tests, and it is basically tied on that last one. The specific outcome varies with the test, but the AMD system is always at parity, or in a couple of instances, well ahead of the other chips.
This outcome is even more lopsided in the floating-point benchmarks, as the overall geomean score hinted at. The AMD chip still falls behind at one test here, 782.lbm_r (which it also struggled at with just 1 copy of SPECrate), but it is often well ahead of the other chips here. It should be reiterated that these are not entirely identical machines, but it certainly makes AMD look good.
Visualized another way, here is how well each respective chip scaled versus its single-instance score.
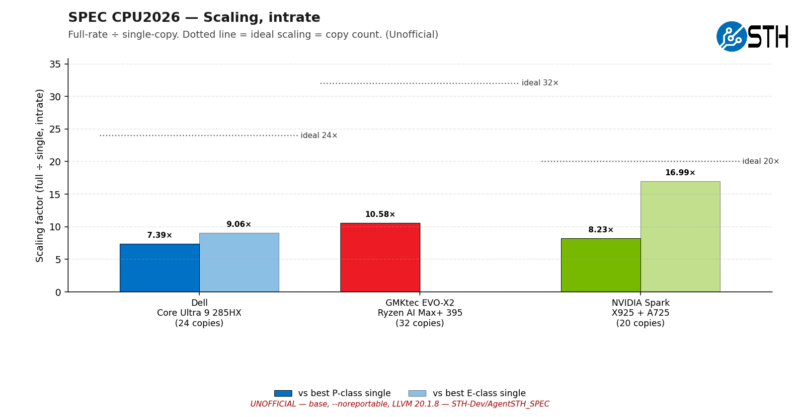
Here we once again see the AMD chip scaling the most, no doubt in part due to its exclusive use of P cores.
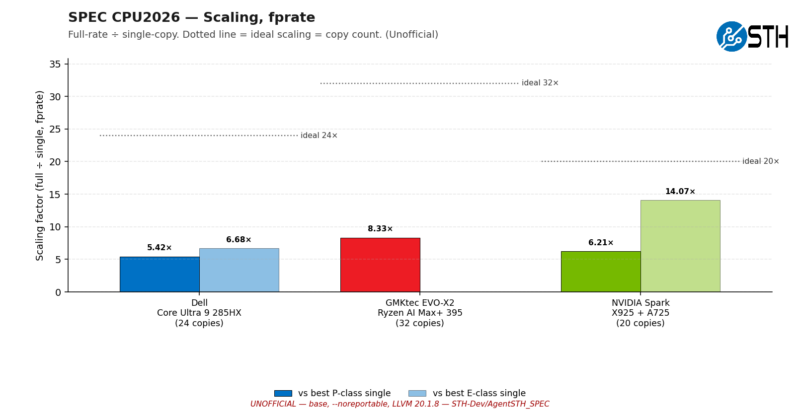
Meanwhile, for floating-point performance, multi-core scaling is weaker overall. All three systems show less performance scaling from a single instance of SPECrate, strongly hinting that floating-point workloads place greater stress on shared resources such as caches, memory, and bus bandwidth.
Since this is a new generation of benchmark, let us next look at a comparison to SPEC CPU 2017.


If I understand the “Scaling, fprate” chart correctly, the “ideal Nx” line is nonsense for the Intel and nVidia systems. The *actual* ideals for those systems is variously 8x, 16x, or 10x for their different core types. And by adding the aggregates from both P and E cores, you have a good number for total system performance, but an utterly useless number for measuring scaling for a particular core type, which is what a first glance at that chart suggests (incorrectly) it’s about. Which is too bad, because there is an interesting idea there.
I mean, really, in what way is it useful to know that 8P+16E cores can achieve 6.68x the performance of a single E core? It would be much more interesting to know how 16 E cores measure up against 1 E core.
Hey, justsomeguy – I had a similar thought. We have updated charts, but they did not make it into this before it went live because it was a bit of a reflection that led to the thought. Hopefully, it makes it into the next set of content. Here is the idea:
Really, the ideal for heterogeneous processors is the maximum performance of each type multiplied by the number of cores in that type, and summing those. That is still not perfect, but it is closer to what you are thinking.
One other one to call out is that on the AMD side, you have 1c/1t and then multiply it by the number of threads, so 16 cores, but 32 threads. I do not think anyone expects SMT to be the same performance as a physical core, so saying 32 times that 1c/1t result is also a bit odd for “ideal” if you start going down a weighted ideal for heterogeneous cores. Is the base then the 1c/2t number? Is it then 1c/2t minus 1c/1t for an ideal SMT thread and calling that a “core” for our weighting?
All good thoughts and feedback. Another very valid point is that we are running these at lower compiler optimization levels than in the official runs. That is actually by design, but there is always a fair question of whether we should do more optimization.
Patrick – My first message originally had some thoughts about threads vs. cores but I removed them before posting as I wanted my main point to be clear and unelaborated. But since you bring it up…
I like your notion of 1c2t-1c1t as a base, but I think that you need to take a step back first and ask, what are you actually trying to do? Do you want to understand an architecture and maybe learn something about whether the choices made in it were good ones? Or do you want to build as good a picture as you reasonably can of what a machine’s performance profile is? These are two not entirely compatible goals, though there is clearly a lot of overlap. Once you decide, that answers some of these questions, or at least narrows down the answers.
In particular, in the second case, it really doesn’t matter what those computations come out to. All that really matters is what you actually measure.
Hey justsomeguy and Patrick, I think in the end what matters is what performance one should expect from a processor and also what one expects from a certain architecture. And here one should add with really bold letters – at what price and at what power level. Considering the last remark, the scores depicted here should also account for the fact that you tested thermally constrained systems – you didn’t test open air systems with an unrestricted thermal solution. Therefore you also test the capabilities of an overall system manufacturing and its cooling solution. To go back to the conversation of the performance expectations, one should also consider why we have p and e cores and of course multithreading. The concept of heterogeneity is to better handle some aspects indirectly related to performance – it is all about efficiency. If you take efficiency (perf/watt) out of the scope, then I find the expected scaling basically wrong. If you take a workload that has the characteristics mostly suited for a p-core and then use it in multiple cores, it does not make real sense to me to consider the scaling beyond the maximum of p-cores – what you may gain from a number of e-cores running alongside is just an added bonus (which may also not be ideal in certain use cases). In the same context, multithreading is used to exploit certain characteristics of the workloads to use the same underutilised resources for multiple processes/threads. In that context, I would consider the 1c/1t as the baseline, the theoritical maximum to be the number of cores and if a workload manages to achieve performance above that level, then this is to be a welcome bonus. Anyway, since you provide the raw data, anyone can make his/her own readings and take your analysis as one aspect that he/she may accept or not. In the end, taking out the dell laptop from the equation, I find that the other two platforms are generally not…. general purpose. So one may focus on the exact applications that they are intended for and not look at the overall results to make what the numbers mean. For example, I would not expect anyone to buy an nVidia Spark system to run gem5 or use it as a database server, although I would expect that the performance of Python and AI related stuff are very important.