SPECworkstation 3.0.2 Storage Benchmark
SPECworkstation benchmark is an excellent benchmark to test systems using workstation-type workloads. In this test, we only ran the Storage component, which is fifteen separate tests.
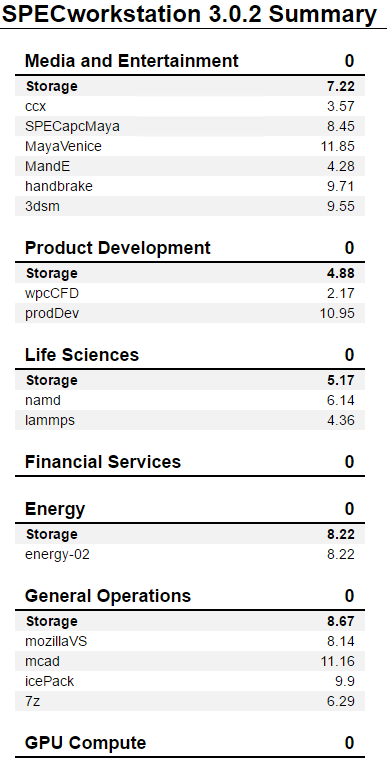
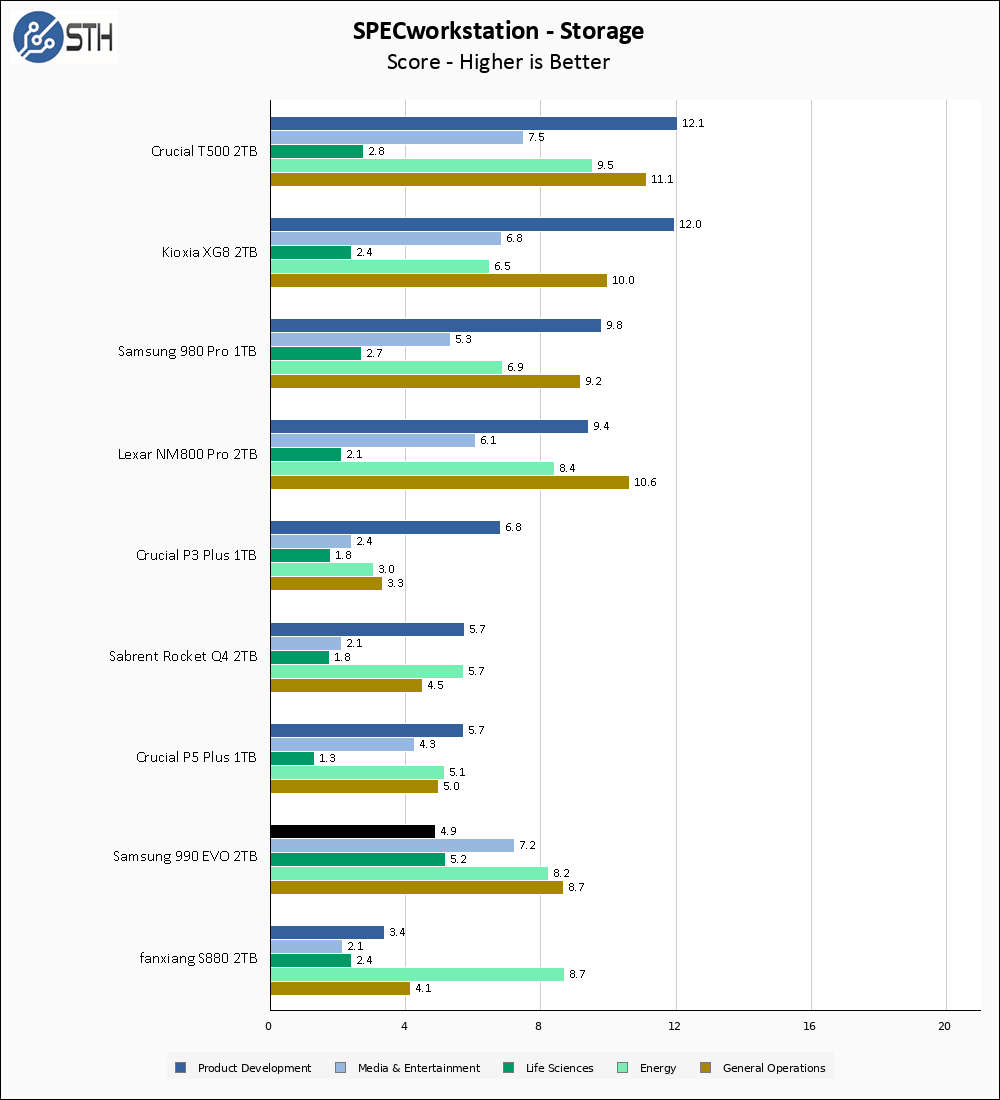
SPECworkstation results for the 990 EVO are a bit odd. The 990 EVO has the highest Life Sciences result I have ever tested, aside from the result achieved by the Optane P5800X. The Media score is the 4th highest I have ever tested as well, and the results for Energy and General Operations are no slouches either. With that said, the Product Development score is a bit more dismal. Overall, the 990 EVO puts on a bit of a show in SPECworkstation.
Sustained Write Performance
This is not necessarily a benchmark so much as trying to catch the post-cache write speed of the drive. While I am filling the drive with data to the 85% mark with ten simultaneous write threads, I monitor the drive for the write performance to dip to the lowest steady point and grab a screenshot.
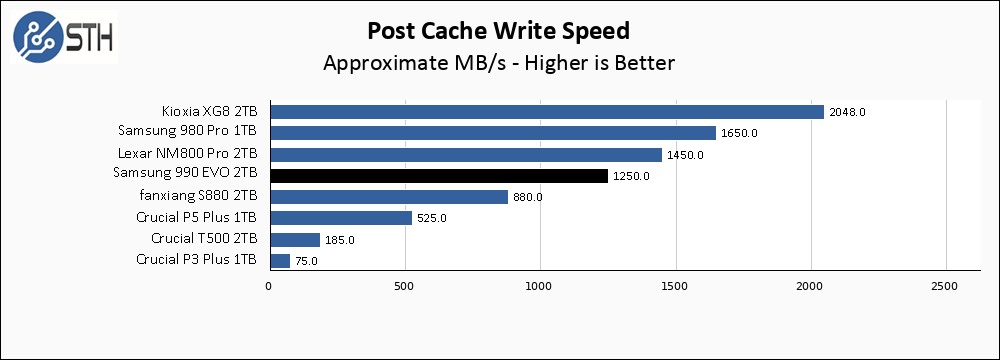
Sustained write speed on the 990 EVO 2TB comes in at a speedy 1250 MB/s. This isn’t the fastest result I have ever seen, but it is plenty quick for almost any user.
Gen 5 vs Gen 4
One big question I had is whether there would be a performance advantage to operating in Gen5 x2 versus Gen4 x4. So, I ran my entire benchmark suite in both modes.
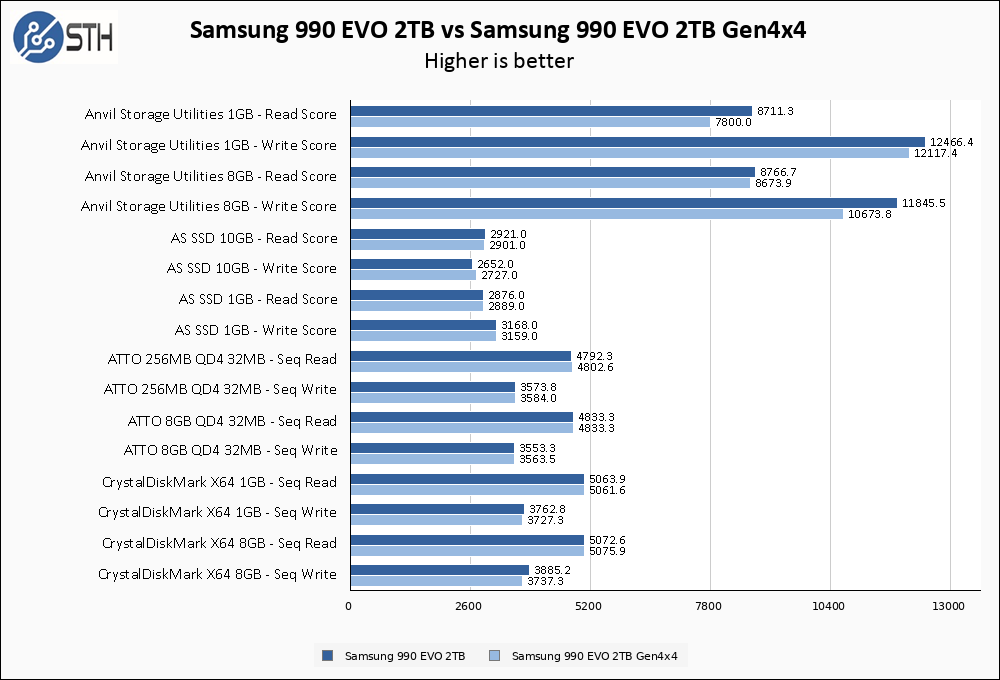
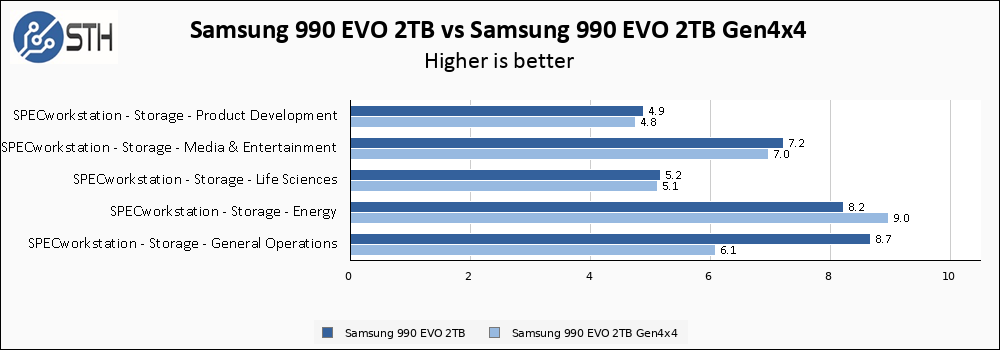
Operating in Gen5 offers a small performance advantage over Gen4, though it is very small and should be imperceptible. Given the theoretical bandwidth limits of both interfaces, this is exactly the result I was hoping to see.
Temperatures
We monitored the idle and maximum temperature during testing with HWMonitor to get some idea of the thermal performance and requirements of the drive.
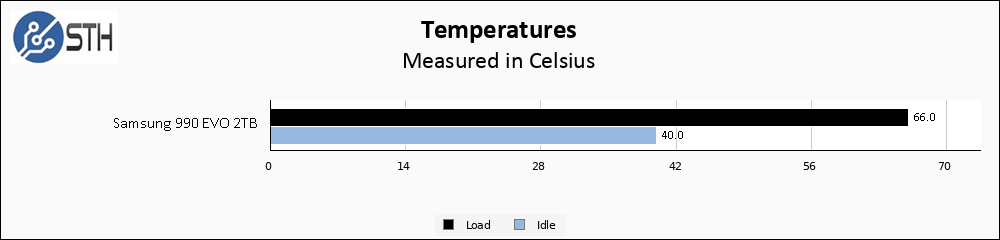
The Samsung 990 EVO 2TB runs pretty cool in my testing, only peaking at 66C.
Final Words
The Samsung 990 EVO 2TB is $159 on Amazon, and that price is not going to do it many favors. Samsung’s 980 PRO is only $5 more, and the WD SN850X is $155. Both of those drives target 7 GB/s, versus the 5 GB/s on the 990 EVO. That pricing is going to make the value proposition difficult.
I love the idea behind the 990 EVO. I want Gen5 x2 slots on my motherboard so that I can have twice as many drives in my system as I could with x4 slots. The 990 EVO is an objective performance upgrade over the 970 EVO and the 980, which is a good thing. With that said, the pricing is a sore point. Most M.2 slots on consumer motherboards are x4 and not x2, and if you’ve got an x4 slot then there are faster drives for less money available than the 990 EVO. In summary, I love the concept, if not the exact execution, of the 990 EVO, and I hope to see more like it in the future.
Where to Buy
You can find the drive on Amazon here (affiliate link.)
Note: We participate in various affiliate programs and may earn a small commission if you use these links.


I predict this ability to work in x2 mode will be useful on space and pcie-lane constricted systems like laptops, mini pc’s, and embedded systems. Of course those types are systems are more likely to use some sort of OEM model installed at the factory.
I’m curious if you see the premature drive wear the same as the 990 Pro’s reported commonly. I’ve only bought Samsung SSD’s with adequate wear-leveling for some time vs other ssd’s that have all failed prematurely, but the 990’s seem plagued by high rates of wear after only a few months, whether a bug in reporting or actual, no one seems to know, but either way I’ve avoided buying ANY 990’s at this point.
Sadly not sure what other vendor *is* properly reliable if not even Samsung anymore…
What’s the performance-adjusted energy usage situation between PCIe 3, 4 and 5 at this point?
Obviously the PCIe 5 stuff is where you find the highest absolute power draws; both because that’s where the gear pushed to the edge and sold to performance enthusiasts is; and because that’s where the highest data rates are; but if you are talking joules/bit how do they stack up in terms of relative efficiency?
I don’t understand what benefit this would have against a normal gen 5 drive which can also run in gen 4 or 2x if needed?
fuzzy,
Unfortunately, essentially all M.2 drives use so little wattage that it is difficult to measure with the basic equipment I have. The 990 EVO is rated at 5.5W power draw peak, regardless of interface, with sub-1W differences between operating modes would be my assumption. Well beyond my ability to measure.
Derp,
Don’t think of it as a Gen5 drive that can run on a slower x2 link, think of it as a Gen4 drive that can run on a faster Gen5-x2 link.
@Will Taillac,
Appreciate the reply. I’m not surprised that the difference wouldn’t show up on (affordable) test equipment in a case like this. I was more curious if anyone knew if anyone who would be in the business of talking up efficiency(whether that be CPU vendors, hyperscalers discussing their design decisions, or silicon IP vendors that do PCIe PHYs like Cadence and Synopsys) has commented on whether PCIe generations are mostly a wash in joules/bit terms, just with newer ones being capable of more bits; whether there’s still a premium to be paid for speed; or whether some combination of design improvements and newer PCIe implementations getting newer fab processes means that the higher speed links are actually more efficient, per bit.
Something along the lines of when AMD was talking advanced packaging and gave picojoule/bit numbers for busses you’d have no hope of measuring in-system without downright absurd test equipment: https://www.servethehome.com/amd-talks-stacking-compute-and-dram-at-isscc-2023/ or similar talks from Intel about how EMIB and Foveros are the new hotness for tying dies together; which also gave pj/bit numbers.
For a lot of applications PCIe5 x4 SSD is overkill and one is better served by having more drives. I daresay it’s a rare PC that can actually PROCESS data at PCIe5 x4 line speed. Processing not just reading to /dev/null or NUL, mind.
I never understood the “This is not necessarily a benchmark” in Sustained Write Performance part of the test.
This is very much a benchmark, and one of the most important ones. Some SSDs are almost unusable in some applications because of terrible Sustained Write Performance
Tom,
I put that disclaimer there because I’m not particularly scientific in the way I come up with that result. The fact you see a literal screenshot of Task Manager and its reported write speed is evidence of that. This result is more of a bonus; it’s just something I record while loading the drive down with data.
There are proper ways of getting SSDs down to a steady state and then evaluating worst case performance, but I don’t do that because it takes a long time (longer than the entire rest of my benchmark suite combined), puts a ton of wear on the drives in question, and isn’t particularly relevant for consumer-class SSDs.
Do I think it’s relevant information? Absolutely, that’s why I include it. Would I bet the farm on the absolute validity and certainty of this particular result? Nope. My testing just isn’t rigorous enough for this particular number to make that claim.
I think it’s a benchmark too. You’re doing the same methodology to all the drives. It’s also useful.
Comments are closed.