Samsung 990 EVO 2TB Performance Testing
We test using both the default smaller test size as well as larger test sets on our benchmarks. This allows us to see the difference between lighter and heavier workloads.
CrystalDiskMark x64
CrystalDiskMark is used as a basic starting point for benchmarks as it is something commonly run by end-users as a sanity check.
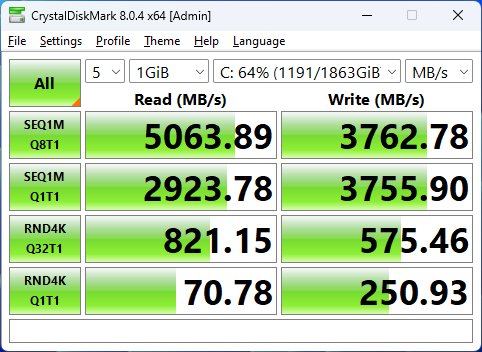
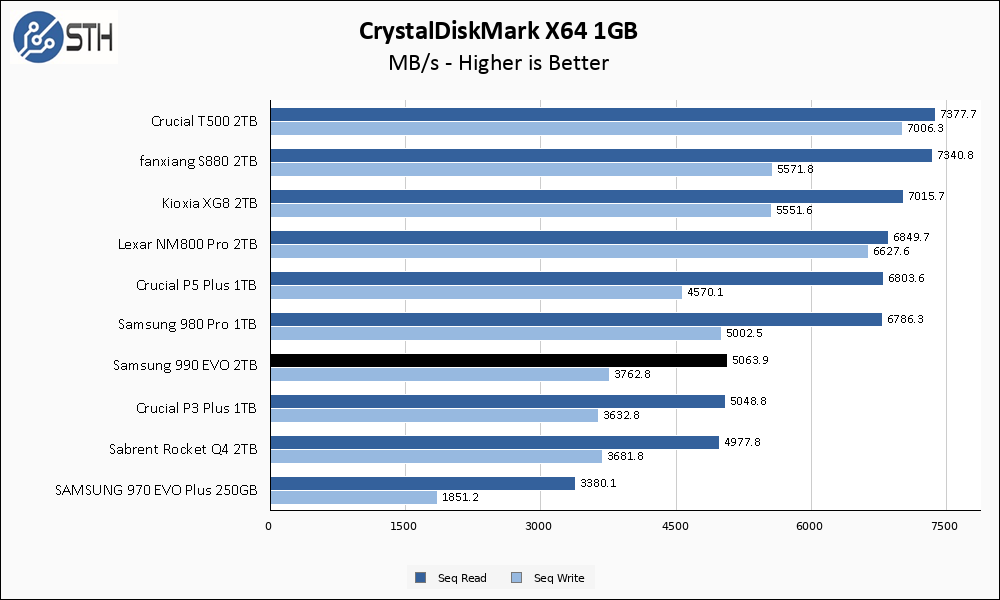
The Samsung 990 EVO 2TB hits its rated 5000 MB/s sequential read mark, but misses its rated 4200 MB/s write speed by a good bit. Compared to other drives on our list, you can see the 990 EVO trailing behind the top-end Gen 4 drives but keeping up with some more budget-oriented models. I only have a 250 GB version of the 970 EVO Plus in my testing database, so the comparison is somewhat unfair, but the 990 EVO does beat the drive by a fair margin.
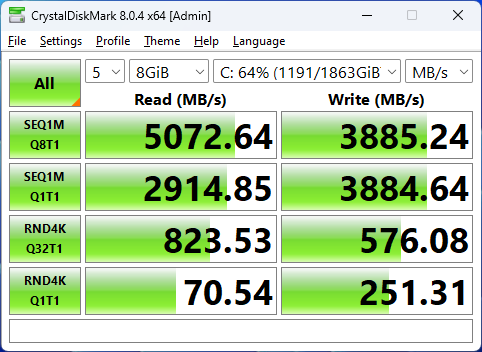
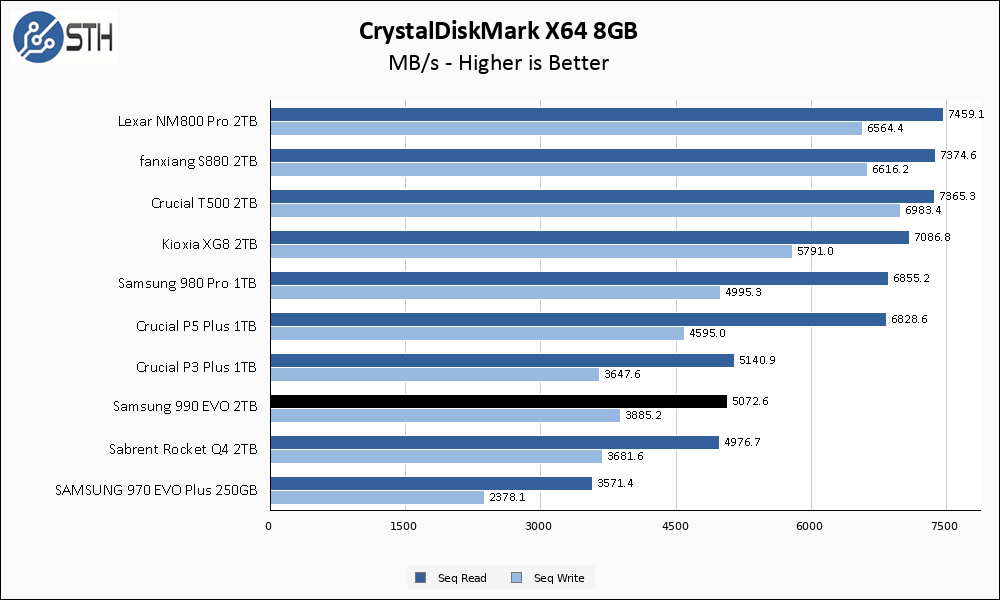
The larger CrystalDiskMark test shows a small improvement in write speed for the 990 EVO 2TB, but it is still off the rated mark by around 400 MB/s. With that said, performance is still generally acceptable here.
ATTO Disk Benchmark
The ATTO Disk Benchmark has been a staple of drive sequential performance testing for years. ATTO was tested at both 256MB and 8GB file sizes.
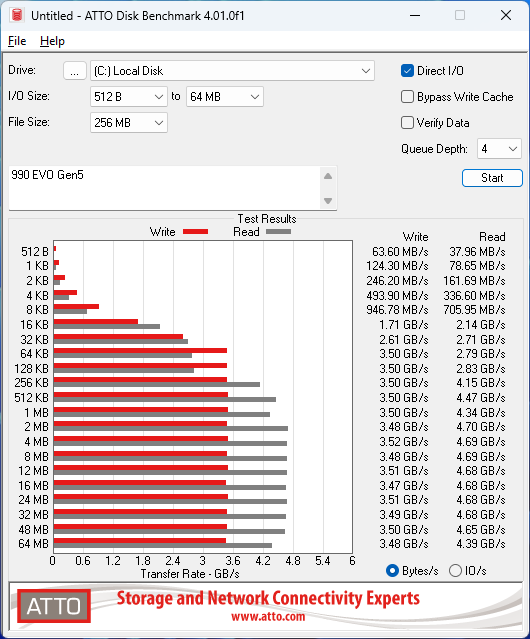
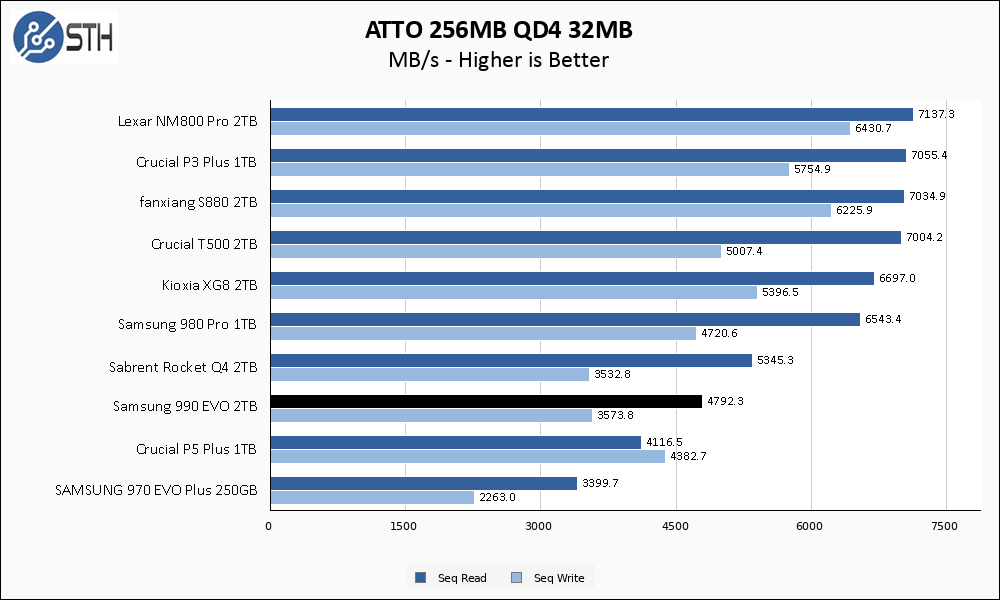
ATTO results commonly come in slightly slower than CrystalDiskMark, and on the 990 EVO that is exactly what we see. Once again, write performance is a bit behind where I would expect given the advertised 4200 MB/s write speed, but not catastrophically far behind.
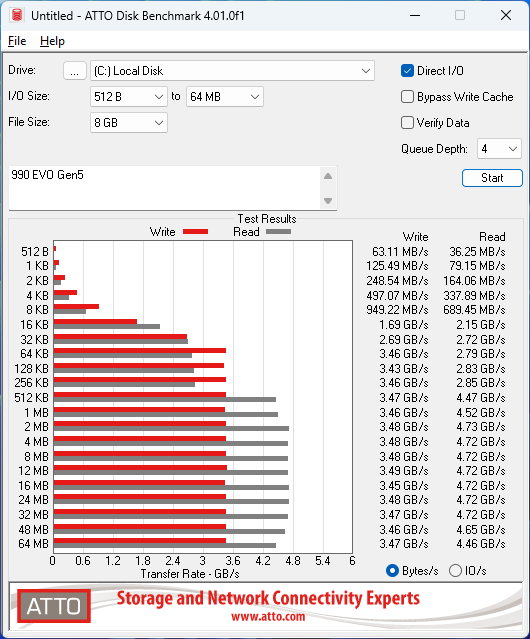
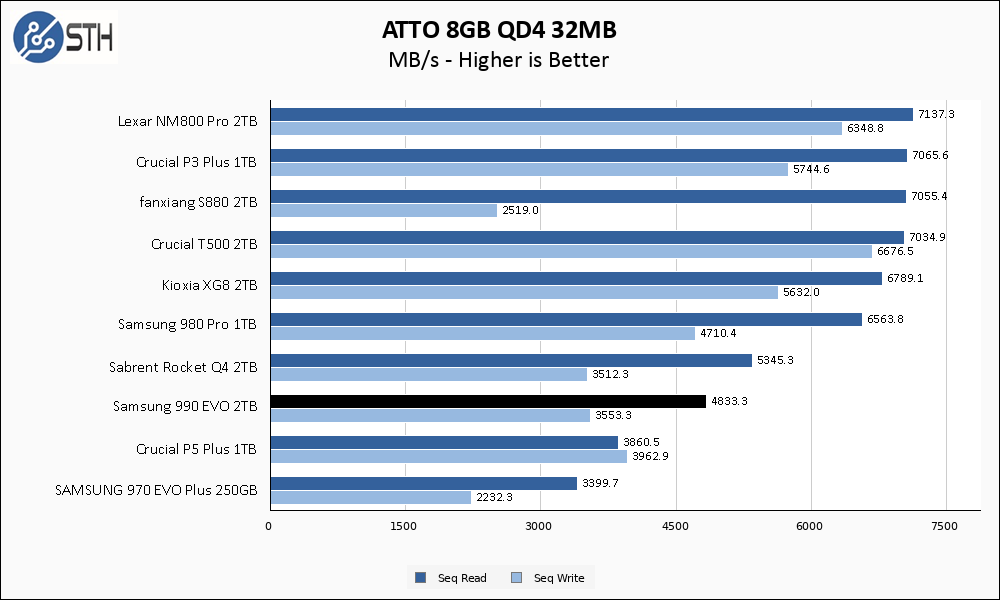
The larger ATTO test is nearly identical to the previous result. One note here: the 990 EVO performance was completely stable across the entirety of the ATTO testing, which is very positive for performance consistency.
Anvil’s Storage Utilities
Anvil’s Storage Utilities is a comprehensive benchmark that gives us a very in-depth look at the performance of the drives tested. This benchmark was run with both a 1GB and 8GB test size.
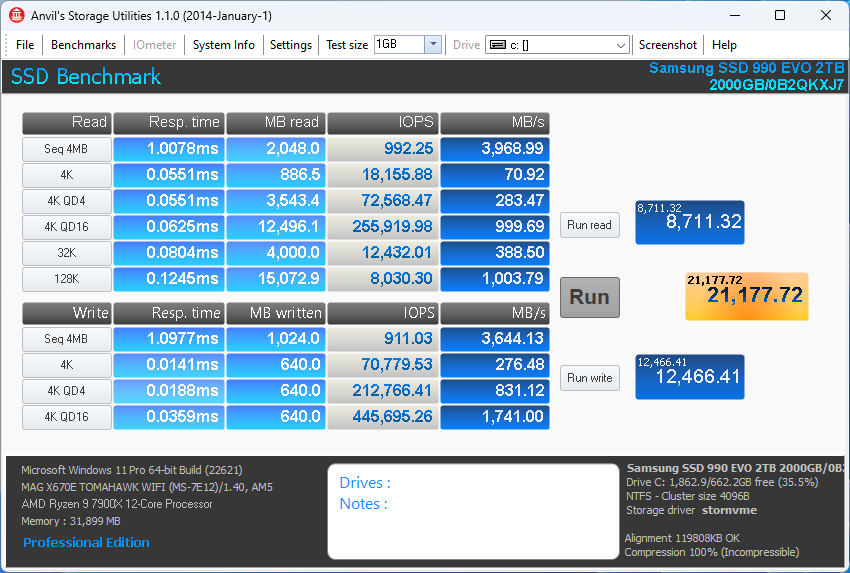
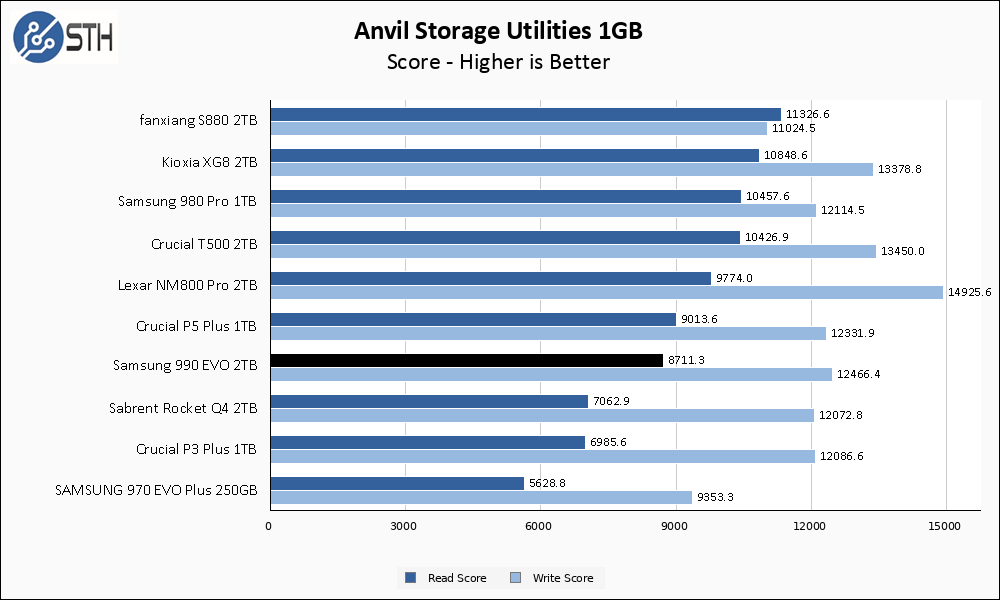
Anvil results show the Samsung 990 EVO beating out older or lower-end Gen 4 drives like the P3 Plus, while still trailing behind the drives that push the Gen 4 envelope.
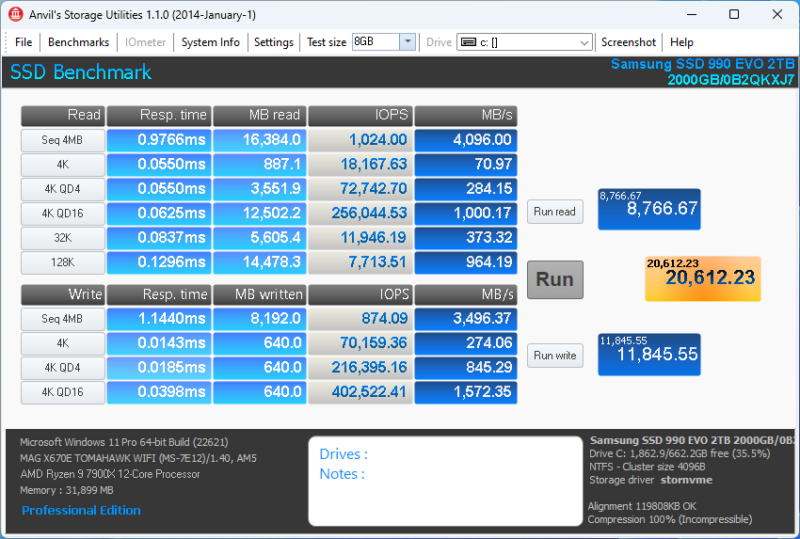
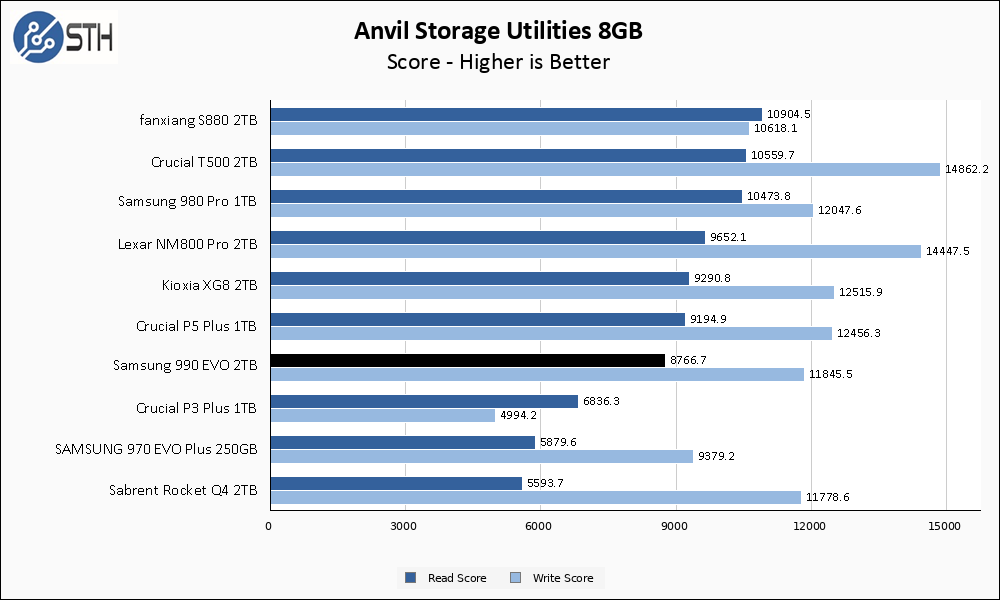
The Samsung 990 EVO 2TB holds its scores very well on the larger Anvil test, dropping only a small step on the write score. The 990 EVO’s positioning on the graph is holding steady.
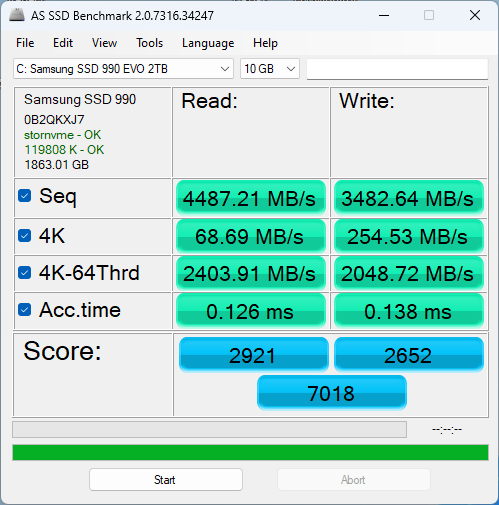
AS SSD Benchmark
AS SSD Benchmark is another good benchmark for testing SSDs. We run all three tests for our series. Like other utilities, it was run with both the default 1GB as well as a larger 10GB test set.

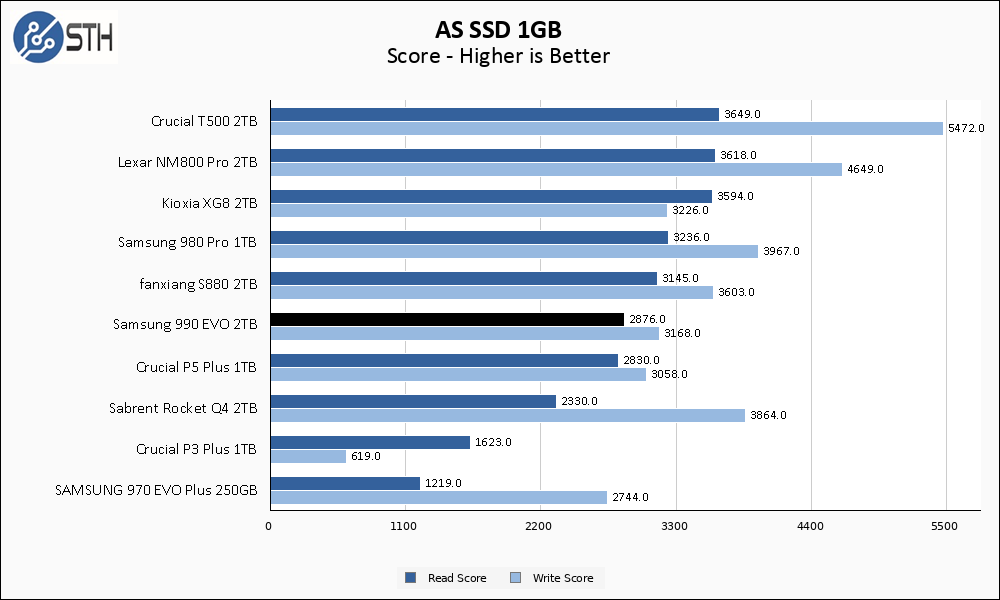
In AS SSD results, the 990 EVO squeaks out a win over the P5 Plus and lands in the middle of the chart. Given the specs, this is expected as the 990 EVO is essentially aiming for middle-of-the-road performance relative to other Gen 4 drives.
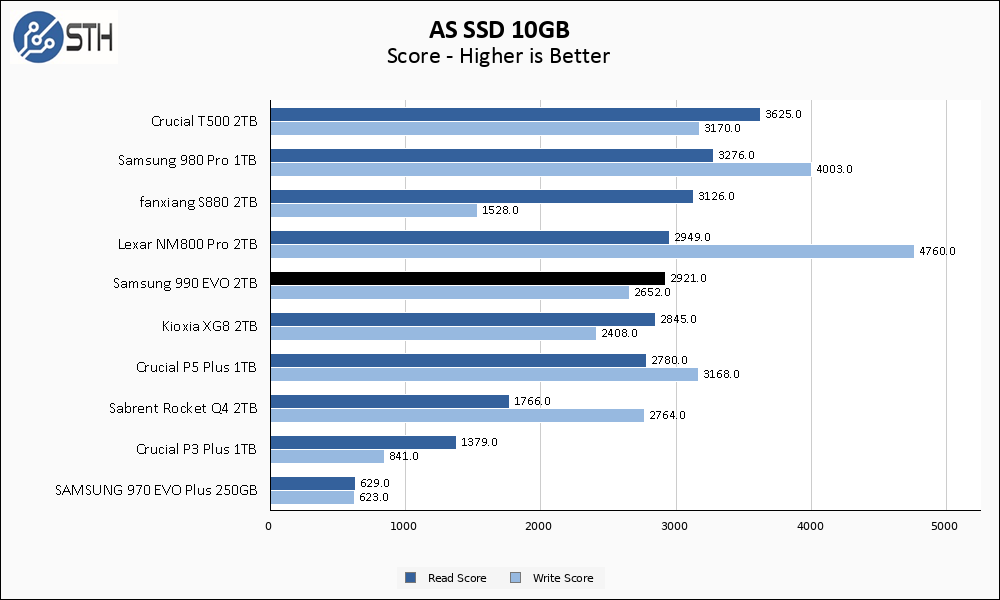
The 990 EVO performance holds out better on the larger AS SSD test than several other drives. I would give the 990 EVO the performance crown over both the Kioxia XG8 and the Fanxiang S880.
SPECworkstation, thermals, and our conclusion are up next.


I predict this ability to work in x2 mode will be useful on space and pcie-lane constricted systems like laptops, mini pc’s, and embedded systems. Of course those types are systems are more likely to use some sort of OEM model installed at the factory.
I’m curious if you see the premature drive wear the same as the 990 Pro’s reported commonly. I’ve only bought Samsung SSD’s with adequate wear-leveling for some time vs other ssd’s that have all failed prematurely, but the 990’s seem plagued by high rates of wear after only a few months, whether a bug in reporting or actual, no one seems to know, but either way I’ve avoided buying ANY 990’s at this point.
Sadly not sure what other vendor *is* properly reliable if not even Samsung anymore…
What’s the performance-adjusted energy usage situation between PCIe 3, 4 and 5 at this point?
Obviously the PCIe 5 stuff is where you find the highest absolute power draws; both because that’s where the gear pushed to the edge and sold to performance enthusiasts is; and because that’s where the highest data rates are; but if you are talking joules/bit how do they stack up in terms of relative efficiency?
I don’t understand what benefit this would have against a normal gen 5 drive which can also run in gen 4 or 2x if needed?
fuzzy,
Unfortunately, essentially all M.2 drives use so little wattage that it is difficult to measure with the basic equipment I have. The 990 EVO is rated at 5.5W power draw peak, regardless of interface, with sub-1W differences between operating modes would be my assumption. Well beyond my ability to measure.
Derp,
Don’t think of it as a Gen5 drive that can run on a slower x2 link, think of it as a Gen4 drive that can run on a faster Gen5-x2 link.
@Will Taillac,
Appreciate the reply. I’m not surprised that the difference wouldn’t show up on (affordable) test equipment in a case like this. I was more curious if anyone knew if anyone who would be in the business of talking up efficiency(whether that be CPU vendors, hyperscalers discussing their design decisions, or silicon IP vendors that do PCIe PHYs like Cadence and Synopsys) has commented on whether PCIe generations are mostly a wash in joules/bit terms, just with newer ones being capable of more bits; whether there’s still a premium to be paid for speed; or whether some combination of design improvements and newer PCIe implementations getting newer fab processes means that the higher speed links are actually more efficient, per bit.
Something along the lines of when AMD was talking advanced packaging and gave picojoule/bit numbers for busses you’d have no hope of measuring in-system without downright absurd test equipment: https://www.servethehome.com/amd-talks-stacking-compute-and-dram-at-isscc-2023/ or similar talks from Intel about how EMIB and Foveros are the new hotness for tying dies together; which also gave pj/bit numbers.
For a lot of applications PCIe5 x4 SSD is overkill and one is better served by having more drives. I daresay it’s a rare PC that can actually PROCESS data at PCIe5 x4 line speed. Processing not just reading to /dev/null or NUL, mind.
I never understood the “This is not necessarily a benchmark” in Sustained Write Performance part of the test.
This is very much a benchmark, and one of the most important ones. Some SSDs are almost unusable in some applications because of terrible Sustained Write Performance
Tom,
I put that disclaimer there because I’m not particularly scientific in the way I come up with that result. The fact you see a literal screenshot of Task Manager and its reported write speed is evidence of that. This result is more of a bonus; it’s just something I record while loading the drive down with data.
There are proper ways of getting SSDs down to a steady state and then evaluating worst case performance, but I don’t do that because it takes a long time (longer than the entire rest of my benchmark suite combined), puts a ton of wear on the drives in question, and isn’t particularly relevant for consumer-class SSDs.
Do I think it’s relevant information? Absolutely, that’s why I include it. Would I bet the farm on the absolute validity and certainty of this particular result? Nope. My testing just isn’t rigorous enough for this particular number to make that claim.
I think it’s a benchmark too. You’re doing the same methodology to all the drives. It’s also useful.
Comments are closed.