Samsung 980 1TB Performance Testing
We are moving towards using larger test sizes on our benchmarks, but on several tests, we also used the smaller default-test sizes. This allows us to see the difference between lighter and heavier workloads.
CrystalDiskMark 7.0.0 x64
CrystalDiskMark is used as a basic starting point for benchmarks as it is something commonly run by end-users as a sanity check.
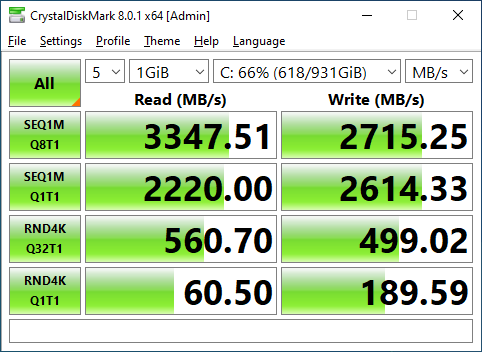
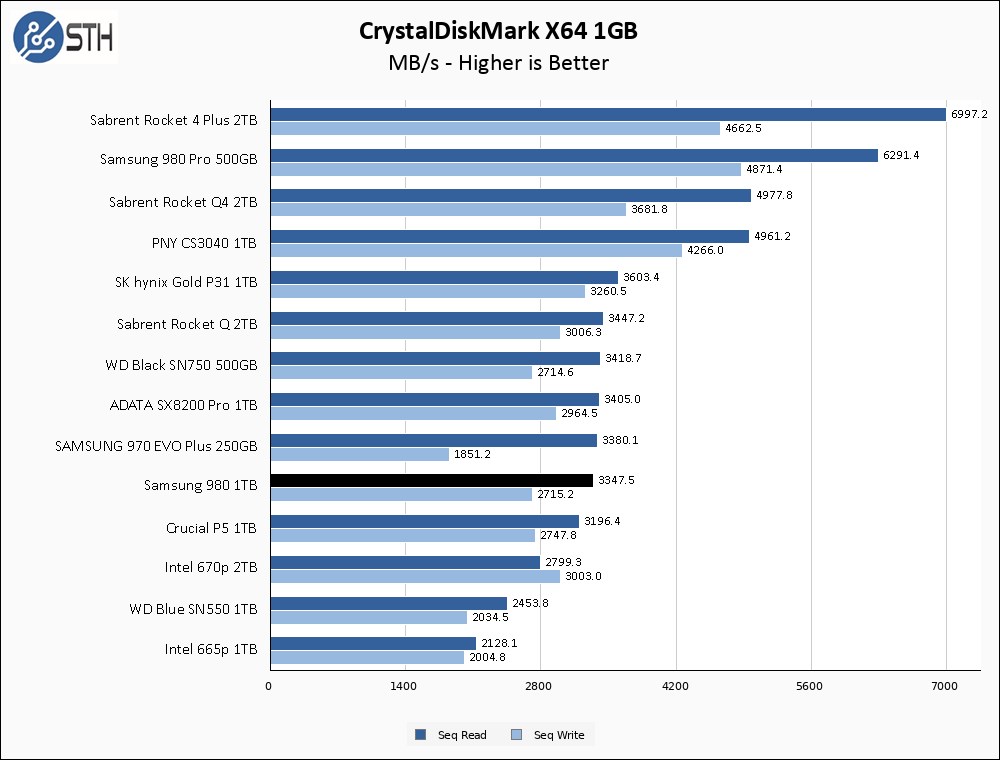
Right off the bat, the sequential performance numbers for the Samsung 980 1TB are just a bit below the advertised rates. Do not get me wrong, the performance here is pretty darn good for a PCIe 3.0 SSD, but it does not quite live up to the advertised 3500MB/s read and 3000MB/s write rates. As far as relative positioning, the 980 1TB arrive right in line with other quality PCIe 3.0 SSDs.
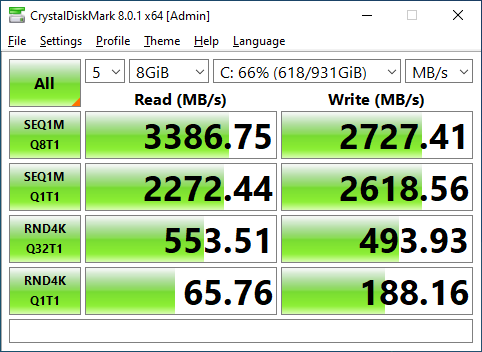
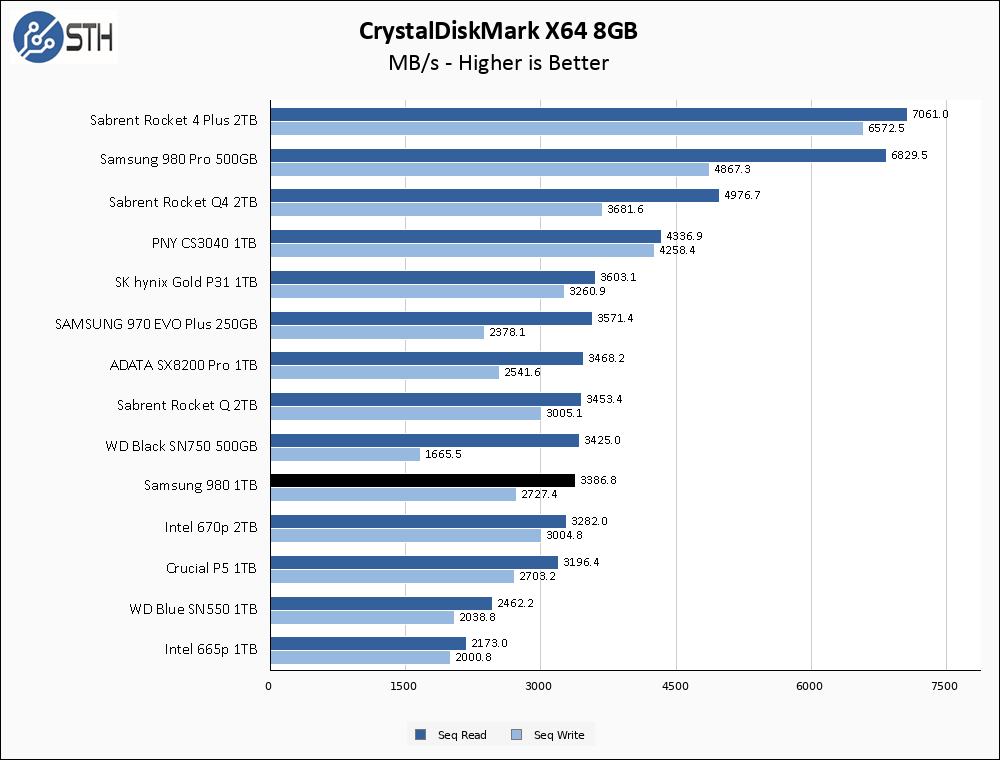
Moving to the larger CrystalDiskMark test has absolutely no effect on the Samsung 980 1TB. Sequential numbers are still just a tick below the advertised rates.
ATTO Disk Benchmark
The ATTO Disk Benchmark has been a staple of drive sequential performance testing for years. ATTO was tested at both 256MB and 8GB file sizes.


Results in ATTO are a mirror of those in CrystalDiskMark; good performance that is just below the advertised rates. Of note here is that the 980 1TB is consistently just a hair behind the older 970 EVO Plus on read speeds.
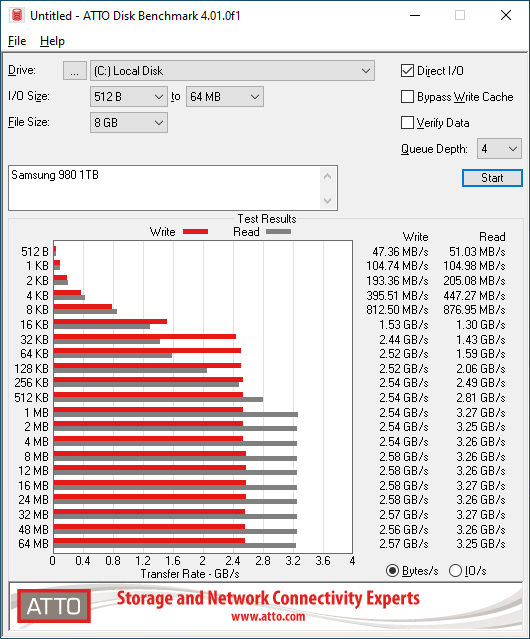

Much like CrystalDiskMark, the larger ATTO test has negligible impact on the 980 1TB’s sequential rates.
Anvil’s Storage Utilities
Anvil’s Storage Utilities is a comprehensive benchmark that gives us a very in-depth look at the performance of drives tested. This benchmark was run with both a 1GB and 8GB test size.
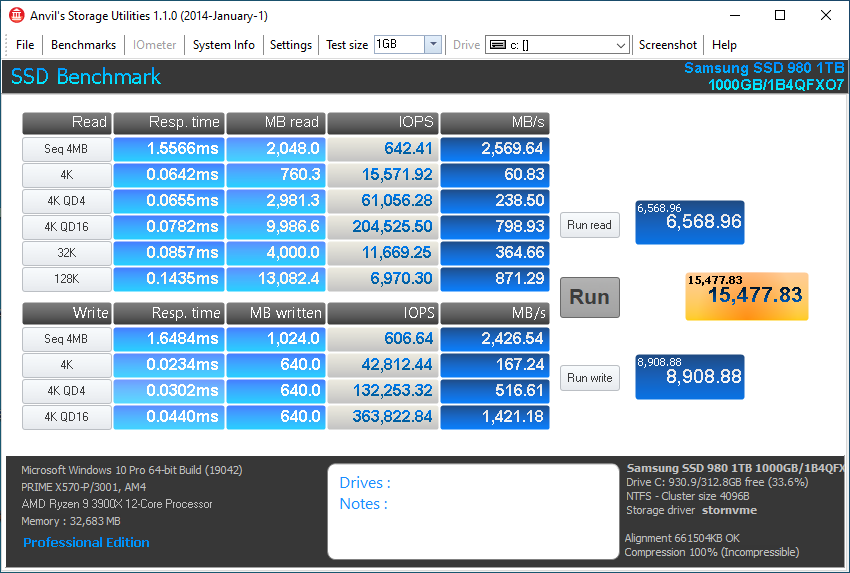
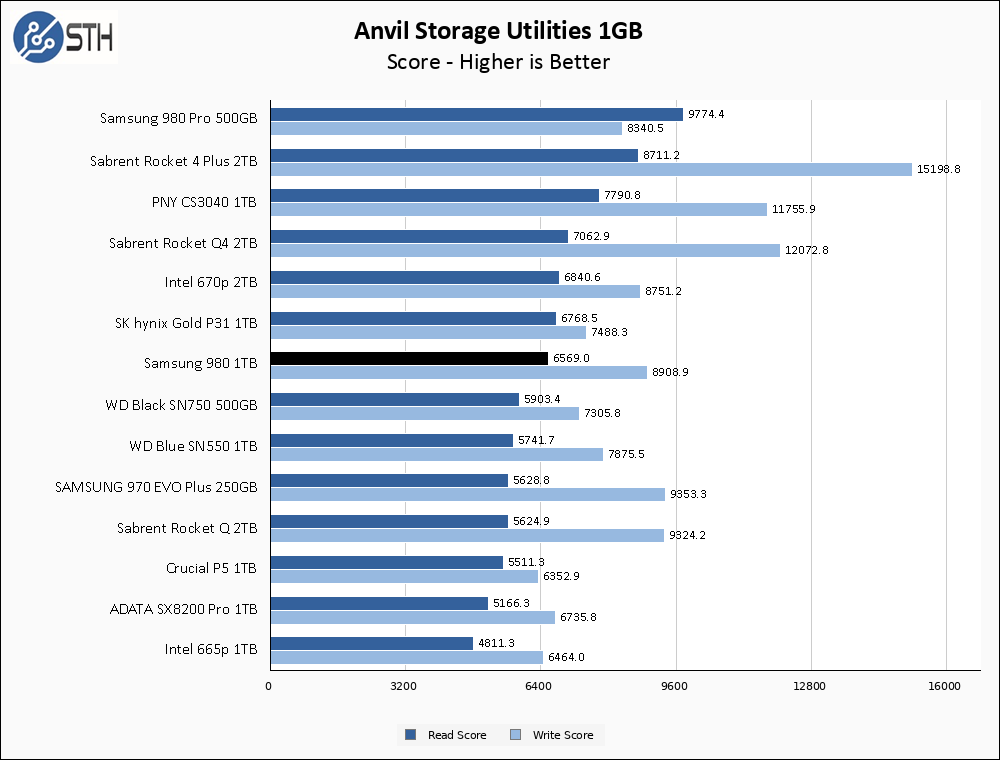
In Anvil, the Samsung 980 1TB lands squarely in the middle of our benchmark pack, though trending towards the upper end of the PCIe 3.0 crowd. Notable here is the write performance, which is especially admirable given the lack of a DRAM cache.

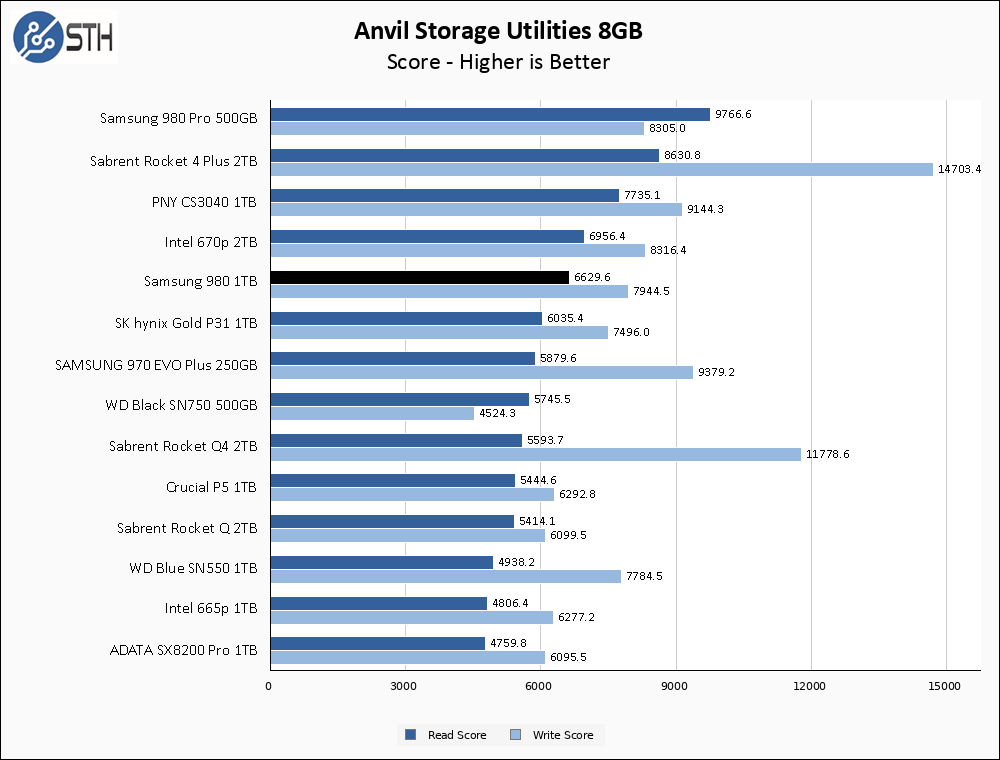
Finally, we have a minor bit of movement from the larger test set, with the 980 1TB losing a bit of ground on the write score relative to the smaller test. Overall though, the drop is minor and does not really affect the relative positioning of the drive on our chart.
AS SSD Benchmark
AS SSD Benchmark is another good benchmark for testing SSDs. We run all three tests for our series. Like other utilities, it was run with both the default 1GB as well as a larger 10GB test set.
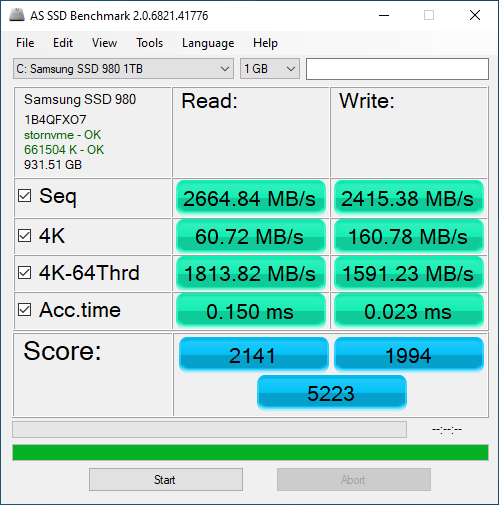
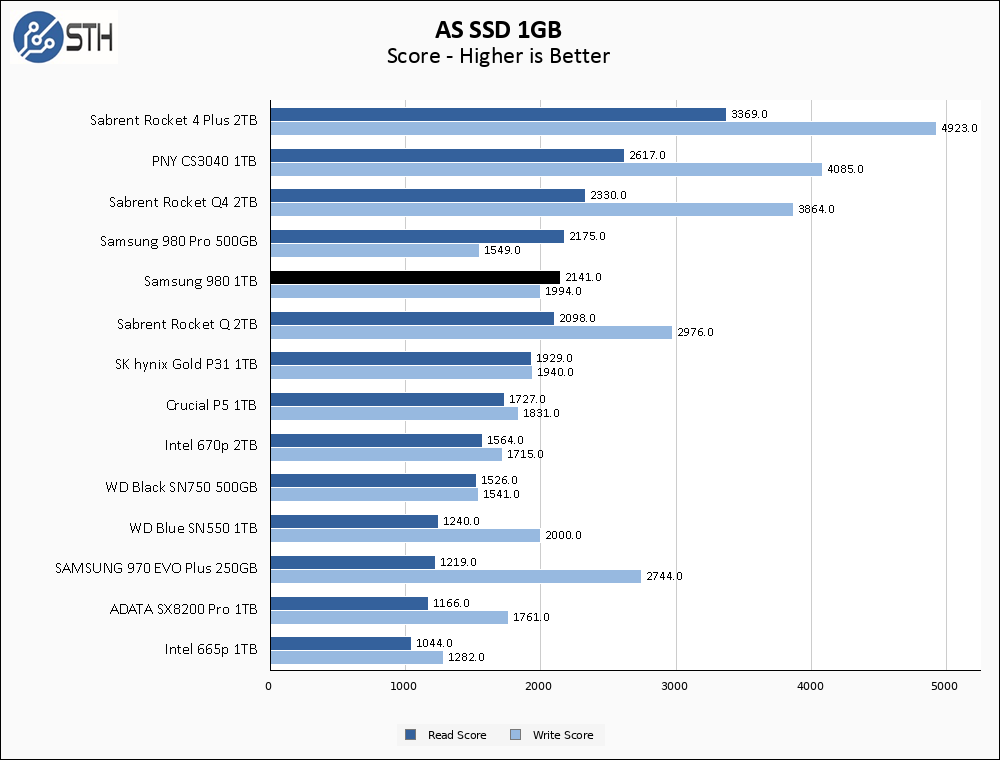
In AS SSD, the Samsung 980 1TB pulls off its first victory among the PCIe 3.0 crowd, narrowly edging out some of the other drives.

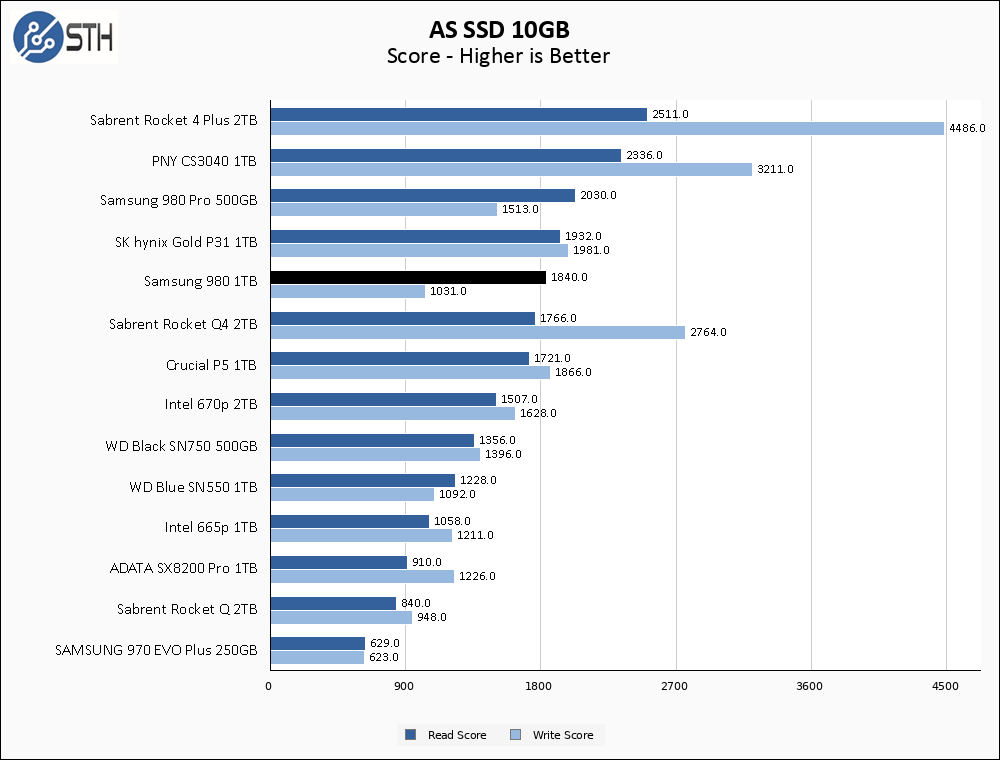
The good fortune is not to last though, as moving to the larger AS SSD test showcases a somewhat precipitous drop in write score for the 980 1TB. The bulk of the loss comes from dramatically slower 4K-64 Thread results.
SPECworkstation, direct comparisons, thermals, and our conclusion are up next.


Will, nice writeup as usual. I enjoy seeing the usual suspect benchmarks I’ve been using for a while. I enjoy the range of storage options presented here at STH. For CrystalDiskInfo, is there a benefit to keeping the default hex values on the drive info screenshot? I realize most of the pertinent info is at the top of the screen, for a new drive especially, but if you’re going to show the full screen, how about using the decimal view for the lower portion? From memory it’s Settings > Advanced Features > Raw Values > 10 DEC, or somewhere in that vicinity. At least for me, decimal is WAY easier to interpret the values there, such as host writes versus NAND writes, max drive temperatures, accrued errors and ECC events, etc.
MOSFET,
Not in particular. I have even had the suggestion to change it before, I’m just a bit forgetful and it isn’t necessarily information I’m looking to see. I’ll try to remember in the future!
Nice write up, I was really enjoying reading it, BUT…
WTF!? You’re comparing apples to oranges here! The 980 looked like it may be a solid performer depending on price, but then I realized you’re comparing a:
1TB 980 vs 500GB SN750 vs 250GB 970 EVO Plus!
If I have to explain WHY this is a problem, then you shouldn’t be posting or reading reviews. A 1TB 970 EVO Plus would probably crush this drive in benchmarks!
Jmcgrath, if you’re too lazy to explain in the first place then you shouldn’t be popping out of your trashcan.
Nice review Will, it actually doesn’t seem a bad drive despite being dramless and a worthy option. It feels like the controllers are getting good enough and the backing nand is also getting good enough to “get away” with not having dram.
JMcGrath,
I can only use comparison points for drives that I’ve benchmarked, and unfortunately I haven’t personally benchmarked a 1TB SN750 or 1TB 970 EVO Plus, which in the 970’s case is something I point out in the comparisons segment of the review. When comparing directly to the only 970 EVO Plus I have benchmarked I literally state “Unfortunately the 970 EVO Plus 250GB is operating at a handicap; the smaller amount of NAND directly translates to fewer populated channels on the 970 EVO Plus’s controller, and had the benchmark been apples to apples with 1TB drives it is entirely possible the 970 EVO Plus could have an even stronger showing. Even when comparing against the baby 970 EVO Plus drive, the 980 1TB cannot claim a clean victory.” As for the SN750, I do not go out of my way to draw comparisons to that drive at any point in the review. I think a more apt comparison point would have been the SK hynix Gold P31 1TB, which is an equivalently priced drive and whose results are included on every benchmark graph.
I’m interested to see if this will be whitelisted for the PS5.
No, it should be a part of benchmarking to test the sustained write for non-MLC SSDs. And I didn’t get, at what point exactly does it drop to raw TLC write speeds? How many gigs is the cache size there?
slc,
“How many gigs is the cache size” is nearly an irrelevant question, since almost all modern drives use an at least partially dynamic cache system, and the amount of available cache will depend on how full the drive is at any given moment in time. This is why I am now measuring and reporting the post-cache write speed, so that readers have knowledge of ‘worst case scenario’ write speed.
I don’t see the point even if you are on pci e why not just get the pro model so you have dram on the nvme and you don’t hit yourself on the life of the drive.
I appreciate the review. BUT, no matter how much you mention in the text, many will only look at the graphs. It’s fine to present “all the drives I’ve tested” as a reference chart, but of more value to purchasers I think would be a chart comparing “only 1TB drives”. IMO far more consumers shop for a particular size than a benchmark number, and that benchmark number really only means something when comparing the various price points for a given capacity.
Useful as ZIL SLOG device? No RAM implies no lost data on power failure?
Comments are closed.