Here we will run the NVIDIA RTX 6000 Ada through Unigine-related benchmarks.
Unigine Superposition
The latest Benchmark from Unigine is Superposition, which measures your graphics cards’ extreme performance and stability.
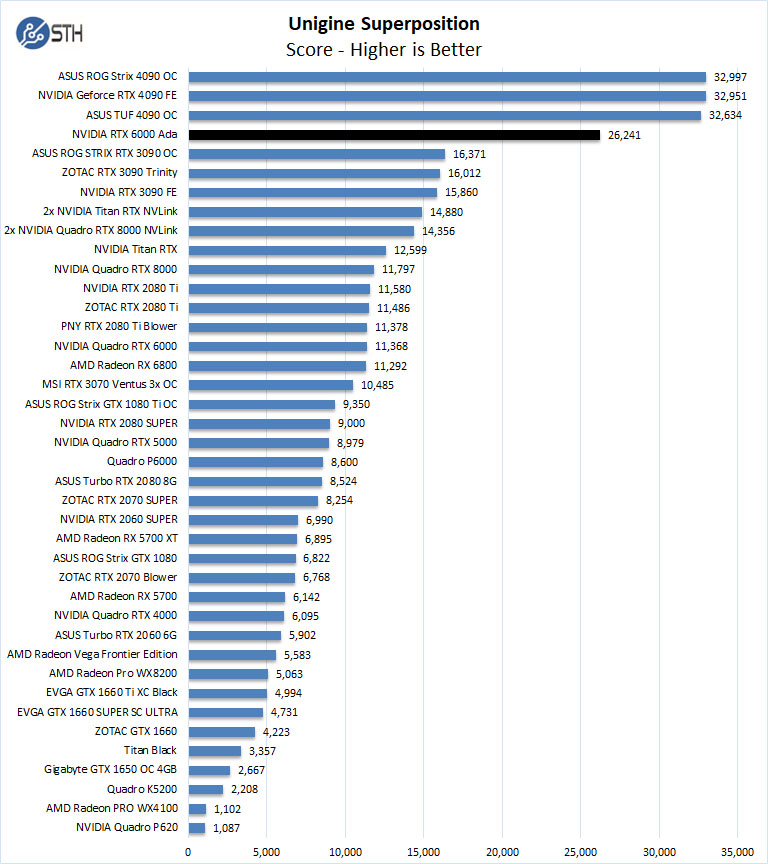
For this Benchmark, we set the resolution to 4K or 3840×2160 to push the graphics card as hard as possible. Here we “only” see a ~2.5x increase over the NVIDIA RTX 8000 generation.
Unigine Heaven
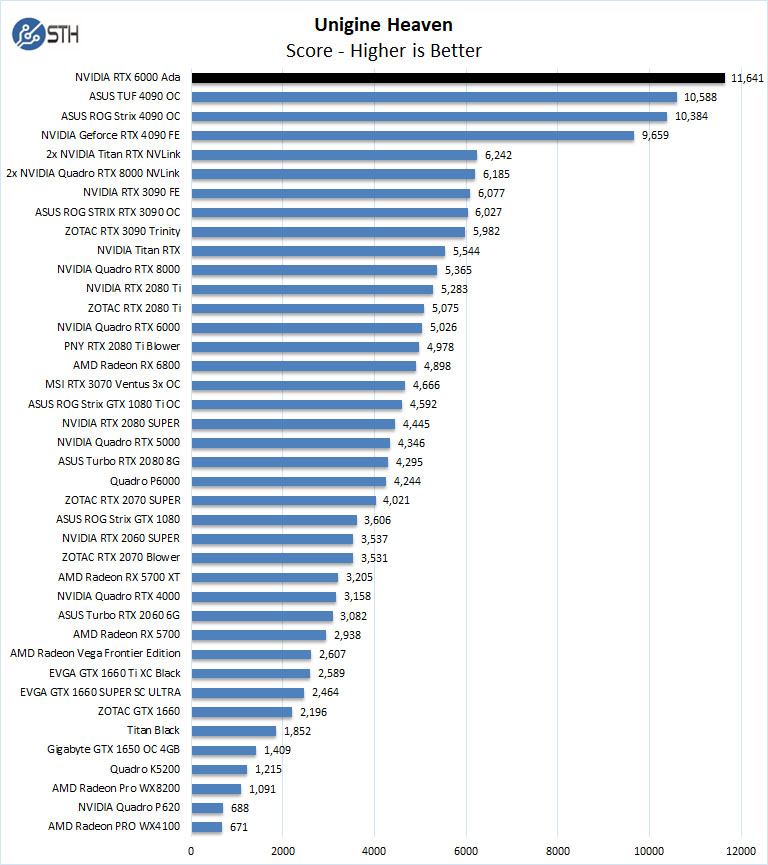
With Unigine Heaven, the NVIDIA RTX 6000 Ada pulls ahead with over 1,000 point difference, while in Superposition, it falls behind but still almost double a 3090 OC.
Here we will run the NVIDIA RTX 6000 Ada through additional 3DMark-related benchmarks.
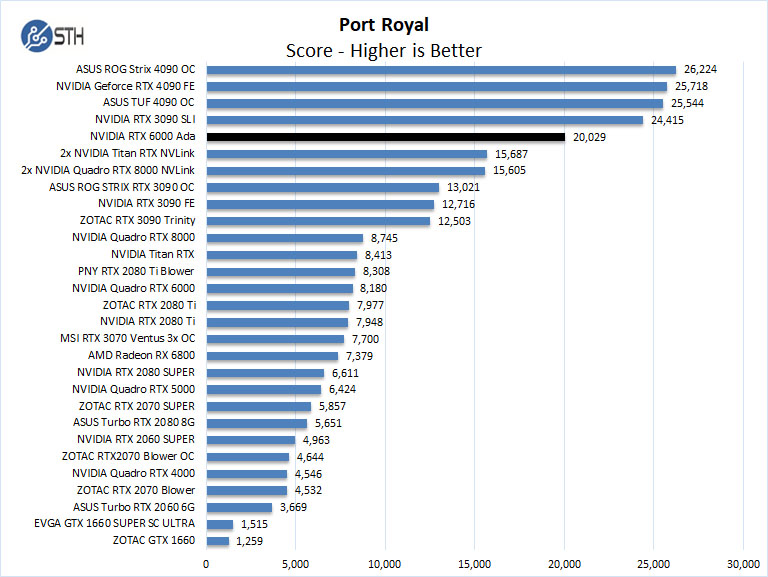
3Dmark – Port Royal
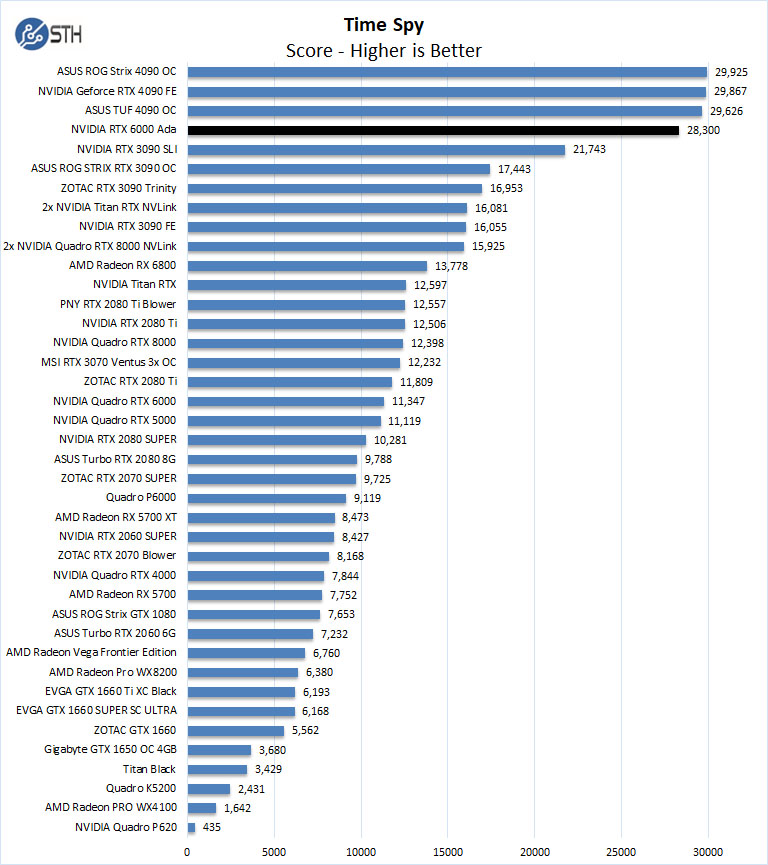
3DMark – Time Spy
This is a well-known Direct 12 Benchmark from Futuremark. It is often used to benchmark high-performance gaming PCs. It is best suited for benchmarking the latest graphics cards.
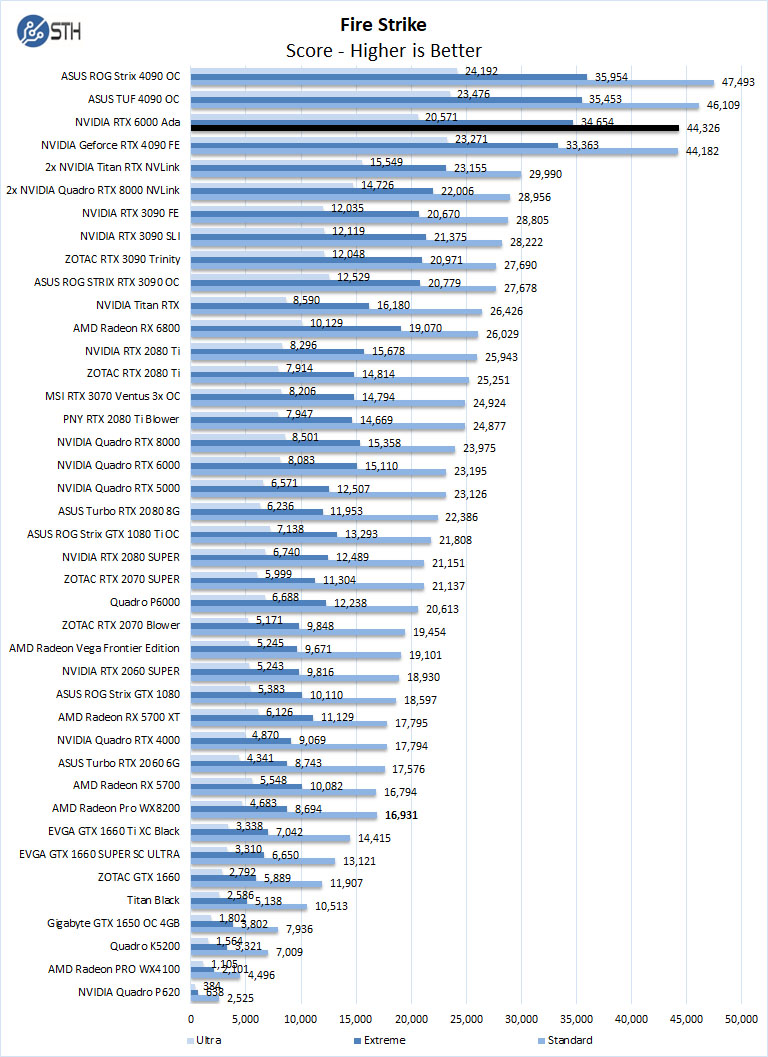
3DMark – Fire Strike
3DMark Fire Strike is a DirectX 11 benchmark designed for today’s high-performance gaming PCs using DirectX 11.
We will run three different Fire Strike Benchmarks:
- Fire Strike – DirectX 11 Benchmark designed to test high-performance PCs.
- Fire Strike Ultra – Testing 4K UHD rendering.
- Fire Strike Extreme – Enhanced version of Fire Strike.
3Dmark – Speedway
This is a new benchmark in the 3Dmark suite.
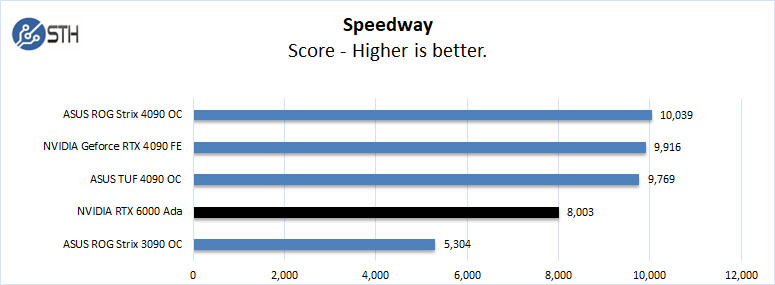
In the UL 3Dmark results the RTX 6000 Ada has a hard time keeping up with the RTX 4090s, but the RTX 6000 Ada is not a gaming card and only has a blower-style cooler so the results are not surprising.
What is more exciting, is that the NVIDIA RTX 6000 Ada is keeping up with the RTX 4090’s given its power consumption and size.
Next, we will look at CFD simulation and some miscellaneous workloads.
FluidX3D CFD Simulation
We last looked at FluidX3D in our H100 hands-on a few months ago. Dr. Moritz, the creator of FluidX3D explains the calculations involved and the benchmark as:
The 3 numbers all are Mega Lattice UPdates per second, or how many million grid points are computed per second. FluidX3D is a lattice Boltzmann method (LBM) fluid solver that computes density and velocity for all points on a cubic grid in every time step. LBM works by copying density distribution functions (DDFs, these are just floating-point numbers) around in memory, and is entirely bandwidth-bound. FluidX3D does all arithmetic in FP32, but has 3 levels of precision for this memory access:
- FP32: Standard FP32
- FP16S: IEEE-754 FP16 with a scaling factor before/after conversion; the conversion is supported in hardware
- FP16C: a custom 16-bit floating-point format with only 4-bit exponent and more accurate 11-bit mantissa. This is a bit more accurate than FP16S in some cases. The conversion is done manually with heavy integer arithmetic and takes ~51 instructions. Since LBM is bandwidth-bound, compressing the DDFs from FP32 to either FP16 format doubles performance. FP16C is heavy on int arithmetic and thus usually not as fast. In most cases, the compression does not affect accuracy at all.
If you want to see the types of simulations this OpenCL lattice Boltzmann CFD software does, you can see an example here with the Space Shuttle simulation:
For some data points here is what we saw in terms of performance.
- FP32: 4995 MLUP/S
- FP16S: 10244 MLUP/S
- FP16C: 10292 MLUP/S
For some reference, it is about half the FP32 and FP16S performance of the NVIDIA H100, but about 74% performance of the FP16C results. These are also 10-20% faster than the NVIDIA RTX A6000 when we tested it.
Next, we will look at the NVIDIA RTX 6000 Ada power and temperature tests and then give our final words.


 GPU is the pinnacle of modern workstation GPUs)
nice review, was wondering why the RTX A6000 wasn’t taken into the comparisons, the “original” RTX A6000 is a generation before that, the A6000 is one generation old
edit: the “original” RTX 6000 (minus the A), and i ment it is 2 generations old,
sorry for the typo
Did you use Nvidia’s “Studio Driver” for the 4090 tests? That driver has optimizations for some professional applications. I’m particularly interested to see if the 4090 gets a performance increase for the specviewperf tests.
junk in price/performance terms. But we don’t have other choice if we want to use +24GB memory over the 3090/4090 memory (for 3x the price – wow sooo expensive extra 24G GDDR-6). The premium price is clearly usage of the monopoly situation of Nvidia.
Comments are closed.