NVIDIA GeForce RTX 3090 FE Compute Related Benchmarks
We are going to compare the GeForce RTX 3090 to our growing data set.
Geekbench 4
Geekbench 4 measures the compute performance of your GPU using image processing to computer vision to number crunching.
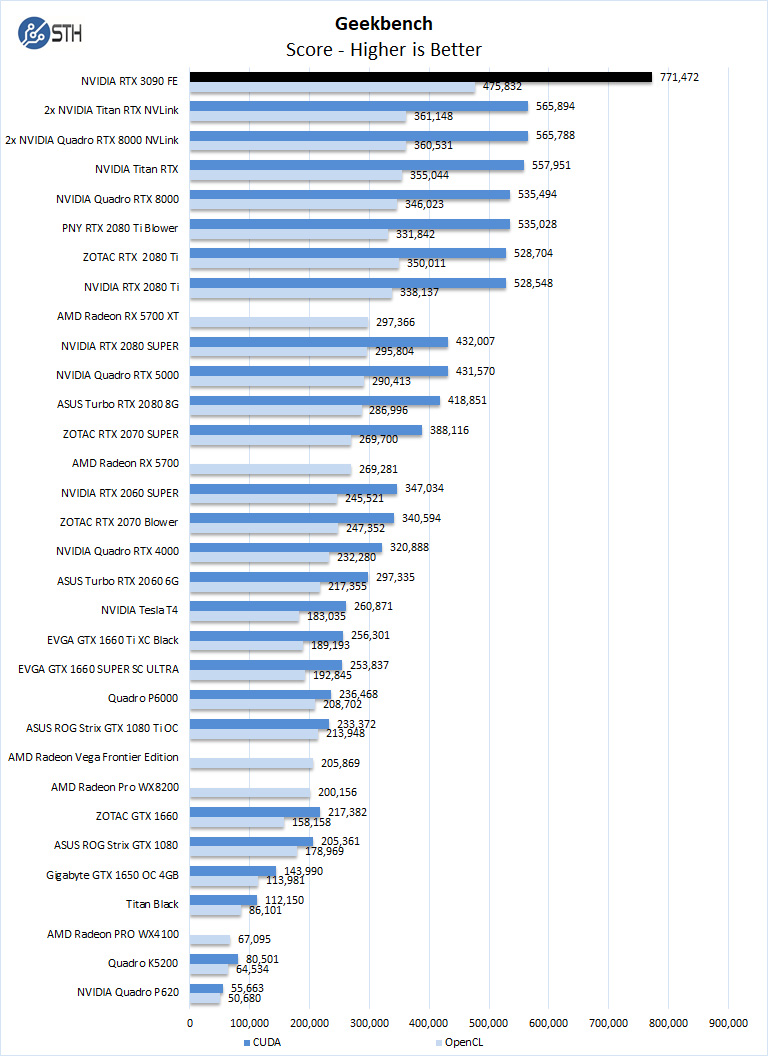
Our first compute benchmark, and we see the RTX 3090, we can see the raw OpenCL and CUDA horsepower in action. The RTX 3090 simply dominates even the past dual Titan RTX and Quadro RTX 8000 in NVLink setups we tested. This is a huge deal where one GPU can outperform NVLink configurations from GPU’s previous generation. That, as you would expect, will not always be the case, but it was interesting that the first benchmark in our review order has that kind of result.
LuxMark
LuxMark is an OpenCL benchmark tool based on LuxRender.
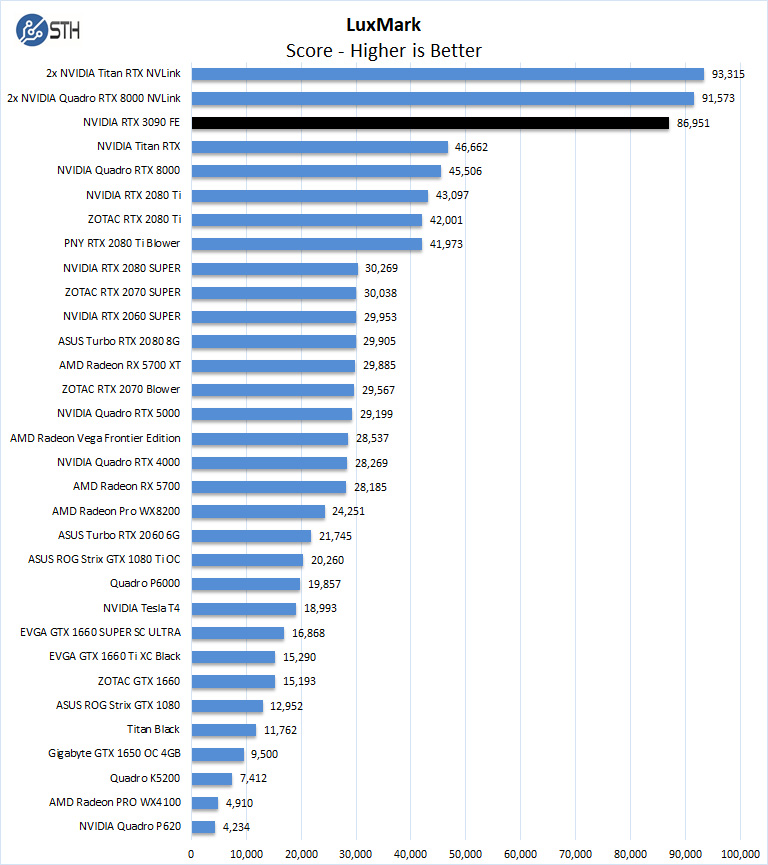
In LuxMark, a single GeForce RTX 3090 can reach near Titan RTX and Quadro RTX 8000 NVLink configurations while using considerably less power and heat, which we will get into later in the review.
AIDA64 GPGPU
These benchmarks are designed to measure GPGPU computing performance via different OpenCL workloads.
- Single-Precision FLOPS: Measures the classic MAD (Multiply-Addition) performance of the GPU, otherwise known as FLOPS (Floating-Point Operations Per Second), with single-precision (32-bit, “float”) floating-point data.
- Double-Precision FLOPS: Measures the classic MAD (Multiply-Addition) performance of the GPU, otherwise known as FLOPS (Floating-Point Operations Per Second), with double-precision (64-bit, “double”) floating-point data.
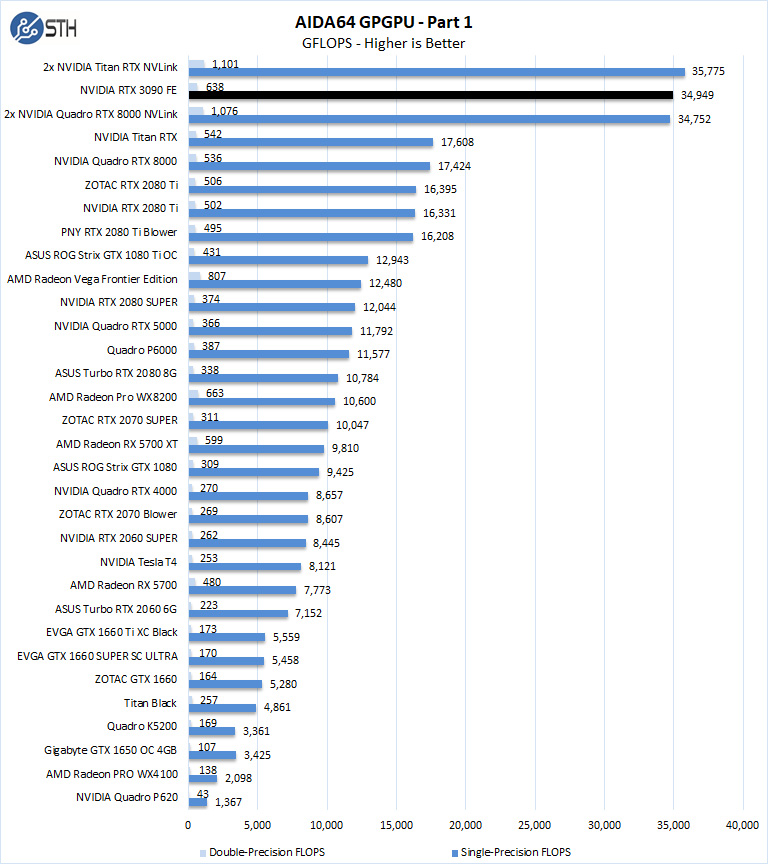
The next set of benchmarks from AIDA64 are:
- 24-bit Integer IOPS: Measures the classic MAD (Multiply-Addition) performance of the GPU, otherwise known as IOPS (Integer Operations Per Second), with 24-bit integer (“int24”) data. This particular data type defined in OpenCL on the basis that many GPUs are capable of executing int24 operations via their floating-point units.
- 32-bit Integer IOPS: Measures the classic MAD (Multiply-Addition) performance of the GPU, otherwise known as IOPS (Integer Operations Per Second), with 32-bit integer (“int”) data.
- 64-bit Integer IOPS: Measures the classic MAD (Multiply-Addition) performance of the GPU, otherwise known as IOPS (Integer Operations Per Second), with 64-bit integer (“long”) data. Most GPUs do not have dedicated execution resources for 64-bit integer operations, so instead, they emulate the 64-bit integer operations via existing 32-bit integer execution units.
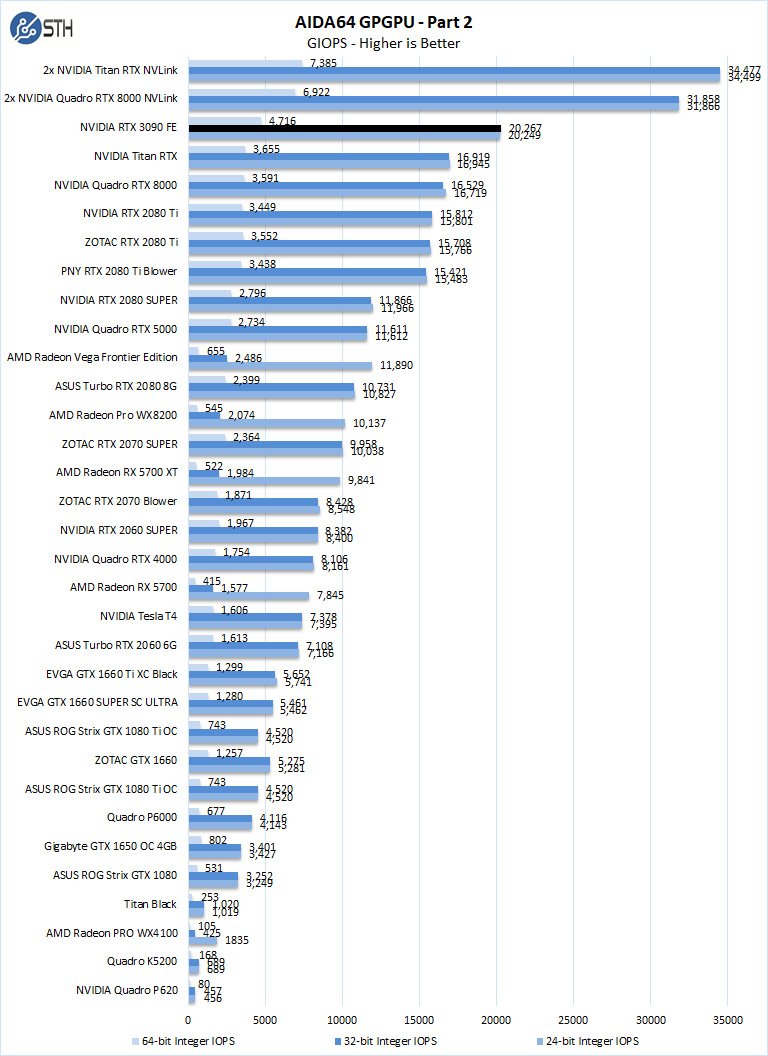
The takeaway here is the GeForce RTX 3090 is the single most potent GPU on our charts so far, outside of the NVLink configurations in this benchmark. We are going to see this trend in later examples.
hashcat64
hashcat64 is a password cracking benchmarks that can run an impressive number of different algorithms. We used the windows version and a simple command of hashcat64 -b. Out of these results, we used five results in the graph. Users who are interested in hashcat can find the download here.
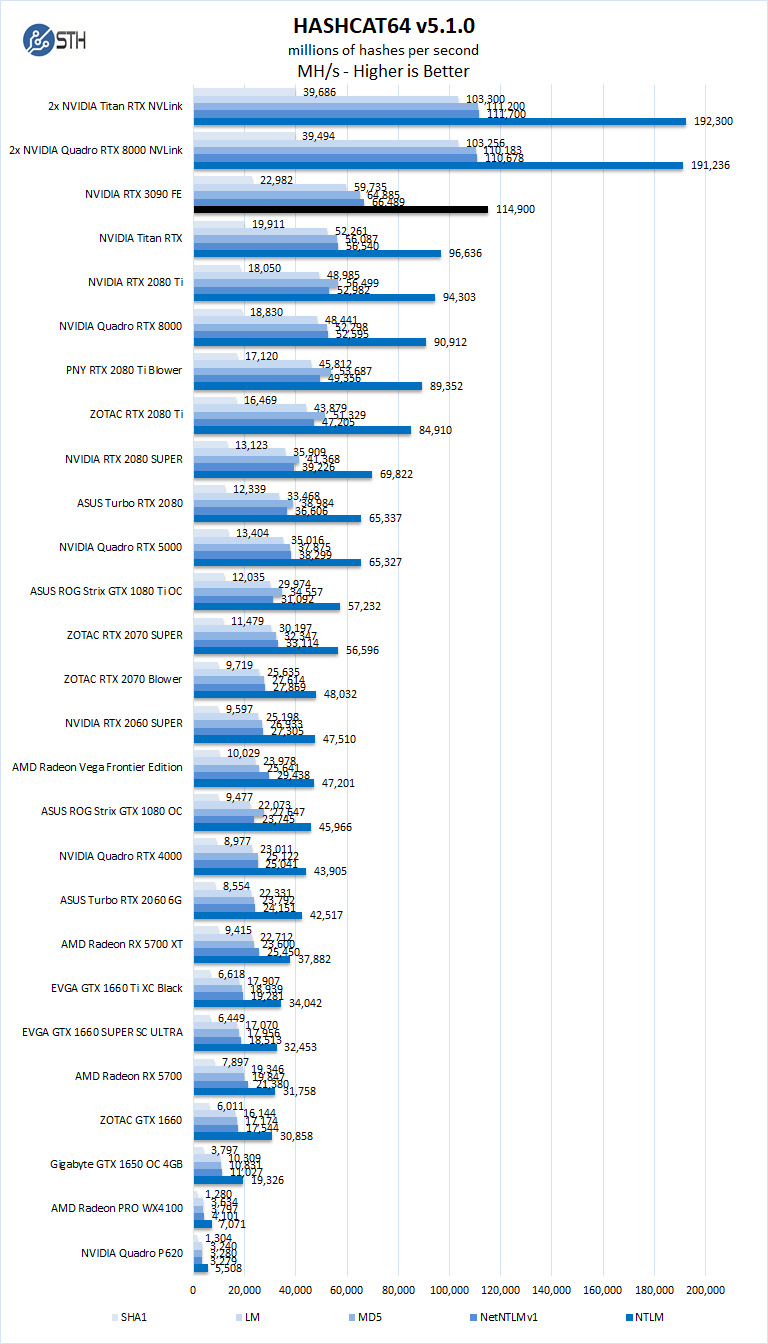
Hashcat can put a heavy load on GPU’s, and here we see the dual-fan graphics cards have the edge in our results. However, with the cooling system used on the GeForce RTX 3090, Hashcat heat loads are easily handled. In the GeForce 1000 series days, we often saw cards get thermally throttled on this benchmark.
SPECviewperf 13
SPECviewperf 13 measures the 3D graphics performance of systems running under the OpenGL and Direct X application programming interfaces.
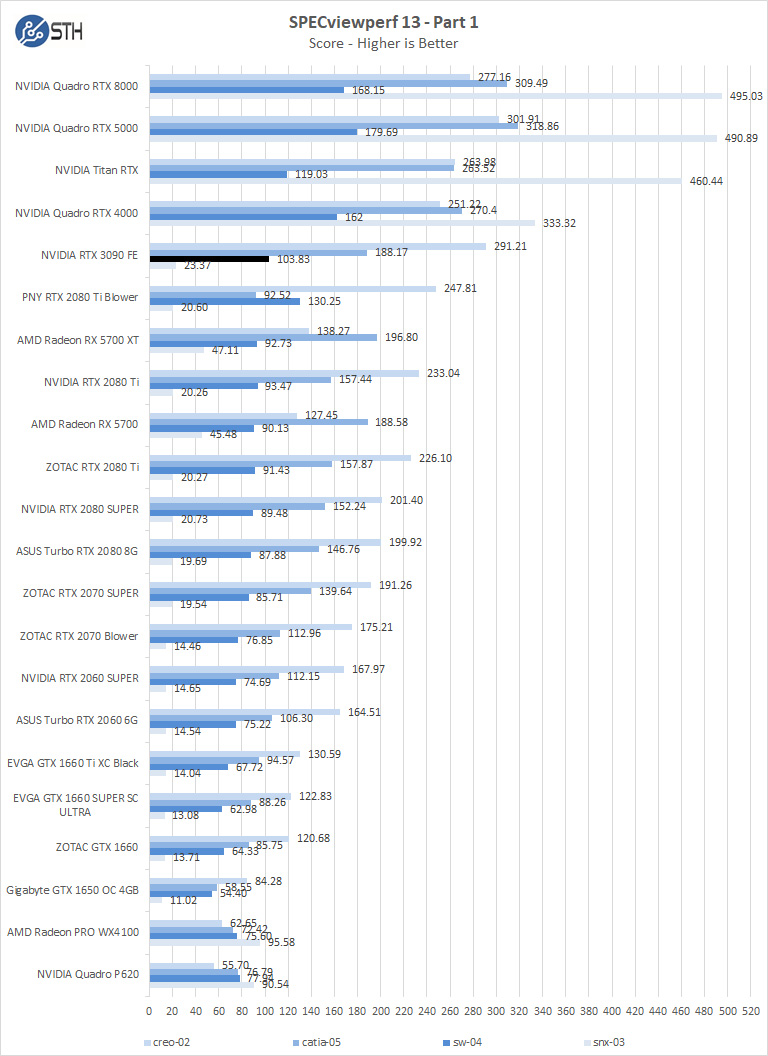
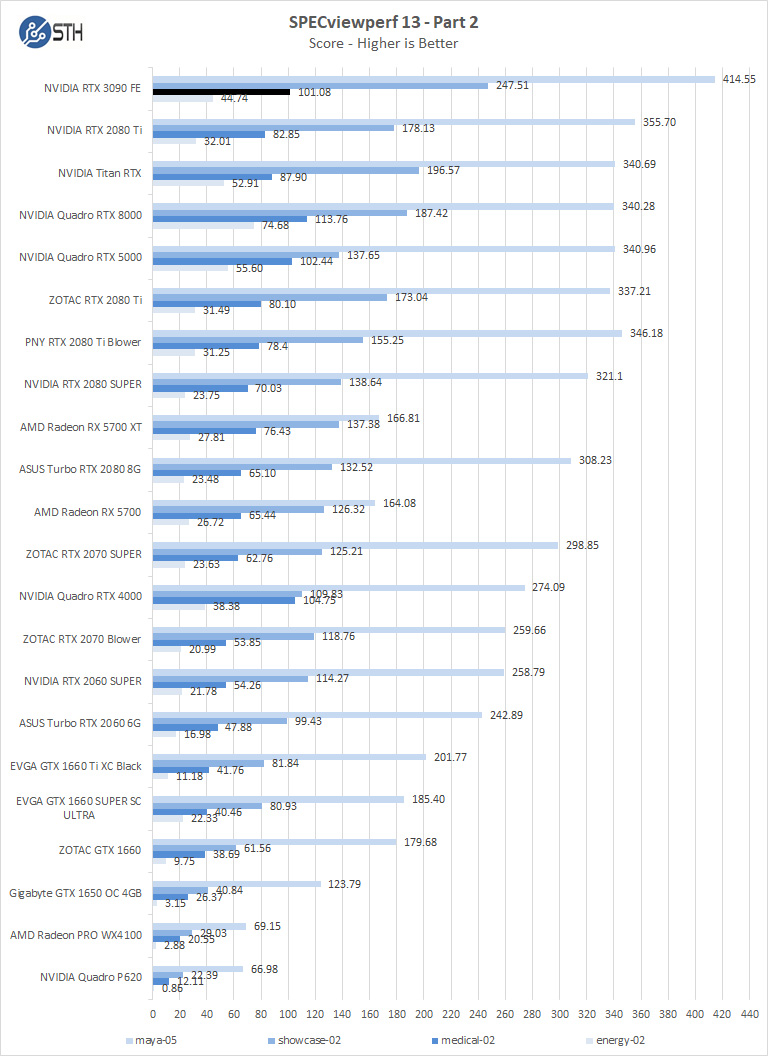
As drivers improve, we should see continued performance increases in this benchmark. In the first chart for SPECviewperf, we find the GeForce RTX 3090 in creo, catia, sw, and snx workloads the 3090 falls behind a Quadro RTX 4000. However, with maya, showcase, medical and energy workloads, the 3090 takes the chart’s top spots.
Let us move on and start our new tests with rendering-related benchmarks.


Are you using the Tensorflow 20.11 container for all the machine learning benchmarks? It contains cuDNN 8.0.4, while the already released cuDNN 8.0.5 delivers significant performance improvements for the RTX 3090.
Great fp64 performance..
It’s not great fp64. The 3090’s AIDA64 GPGPU score of 638 is less than 10% of the 6351 FLOPS my Radeon Pro VII pulls down. https://twitter.com/hubick/status/1324203898949652480
How did the NVlinked, Titan RTXs and Quadro RTX 8000s get better than 100% scaling in OctaneRender 4.0?
Chris Hubick
‘
Misha, as well known AMD shill, is being facetious – and this is a graphics card and not a compute card like the Ampere A100 – which trades the RT cores for FP64…
Would love to see this dataset run on a A100 for comparison, is that review coming as well or are those datasets not public?
Hi,
I LOVE the GeForce and Threadripper compute reviews (especially the youtube video reviews!)
However, for our work load, we really need to know how the hardware performs for double-precision memory-bound algorithms.
The best benchmark that matches our problems (computational physics) is the HPCG benchmark.
Would it be possible to add HPCG results for the reviews? (http://www.hpcg-benchmark.org/)
Also, for some other computational physicists, having the standard LinPack benchmark (for compute-bound algorithms) would be really nice to see as well (https://top500.org/project/linpack/)
– Ron
Comments are closed.