
Kioxia CM9-R Test Setup and Thermal Performance
Testing used fio 3.42 with io_uring direct I/O on an Intel Xeon w9-3495X running Ubuntu 26.04 LTS. Each data point represents 300 seconds of measurement following a 30-second ramp period. Outstanding I/O equals the number of jobs multiplied by per-job queue depth. The CM9-R random ladder reaches an OIO of 2048. We altered the methodology slightly, as older drives topped out at OIO=512, but now we are seeing drives go beyond that. We probably will not get to re-test older drives at the higher OIO levels, so Our test CM9-R capacity is 15.36TB, while comparison drives range from 1.6TB to 7.68TB. During the CM9-R run, the peak composite temperature reached 60.9C against a warning threshold of 76.9C. We have been logging this after seeing another drive thermal throttle in an enclosure we thought should have supported it.
We have been building a new visualization tool after doing it for AgentSTH V7, SPEC CPU2026, Geekbench, and more on the CPU side, so we are not generating these charts in Excel manually each time. Feel free to leave feedback in the comments.
Kioxia CM9-R Conditioning and Consistency
Something that we did with our Kioxia CD9P 7.68TB E3.S NVMe SSD Review was to get into more of the heavy preconditioning performance. It is very valid to say that these workloads are more of a worst case rather than realistic, but we had the data, so we thought we would plot and share it since we can just build a tool to plot the data.
The first chart displays the 128K sequential stage, where the shaded region indicates the final fill after we hit steady state on the first one. Each stage begins with a secure erase followed by two complete 128K sequential fills.
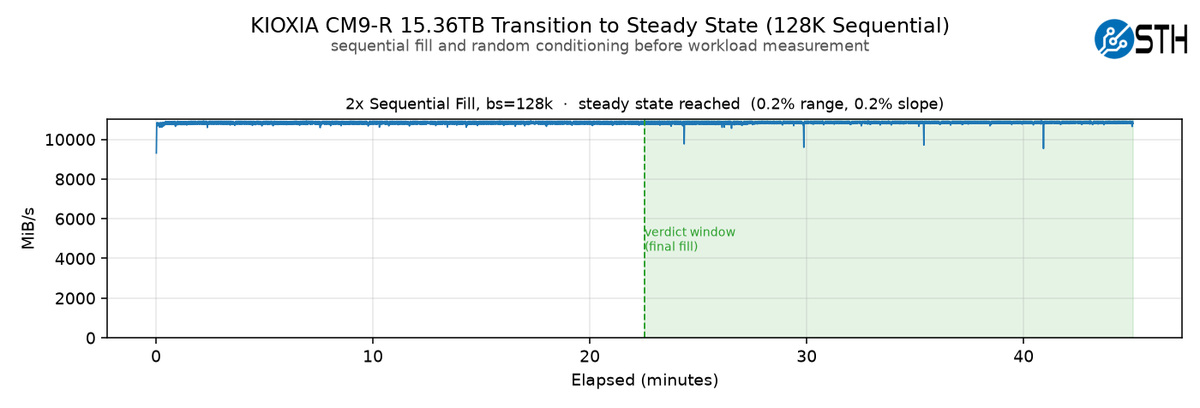
The final-fill steady-state check shows a 0.2% range and 0.2% slope excursion, which is a fairly tight window. This confirms the drive maintains stable sequential performance during preconditioning.
The next chart shows a top chart with two 128K sequential fills and a bottom chart with 4K SPRandom conditioning.
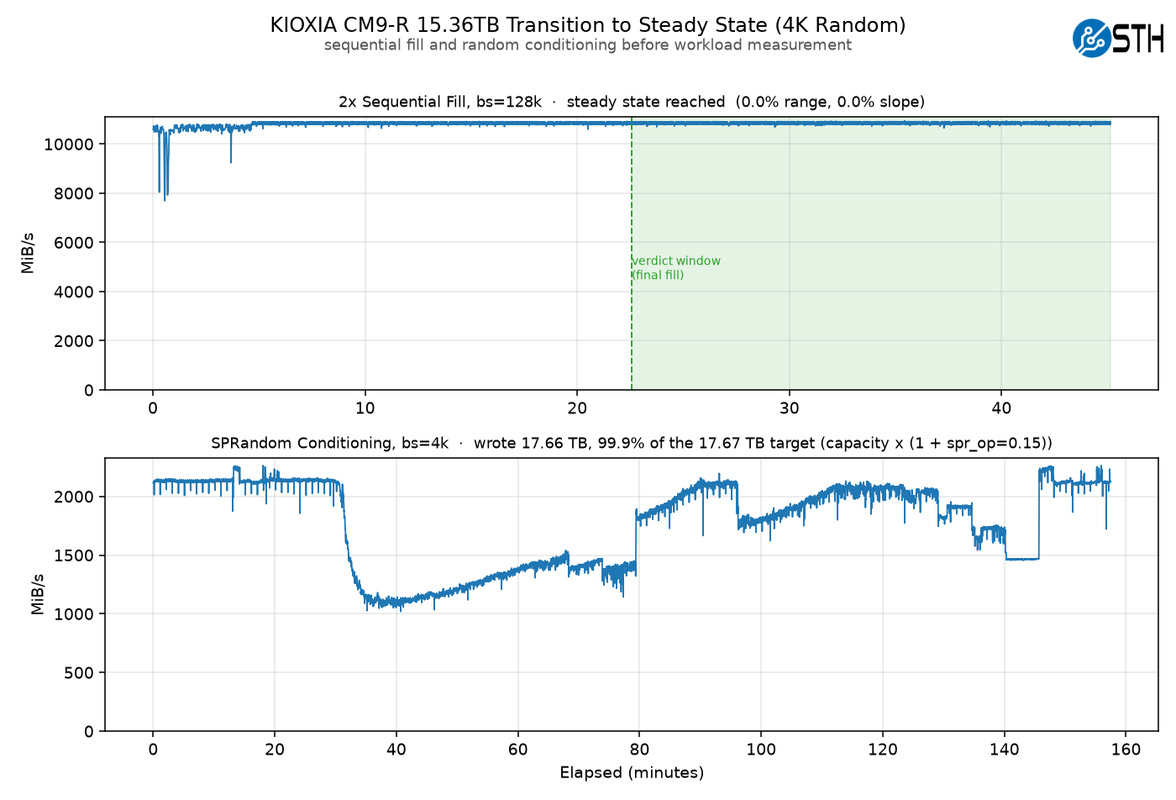
The SPRandom pass varies by design as it writes blocks. The process repeats at an 8K random block size after its own sequential fills, with the top chart showing sequential data and the bottom panel showing random data.
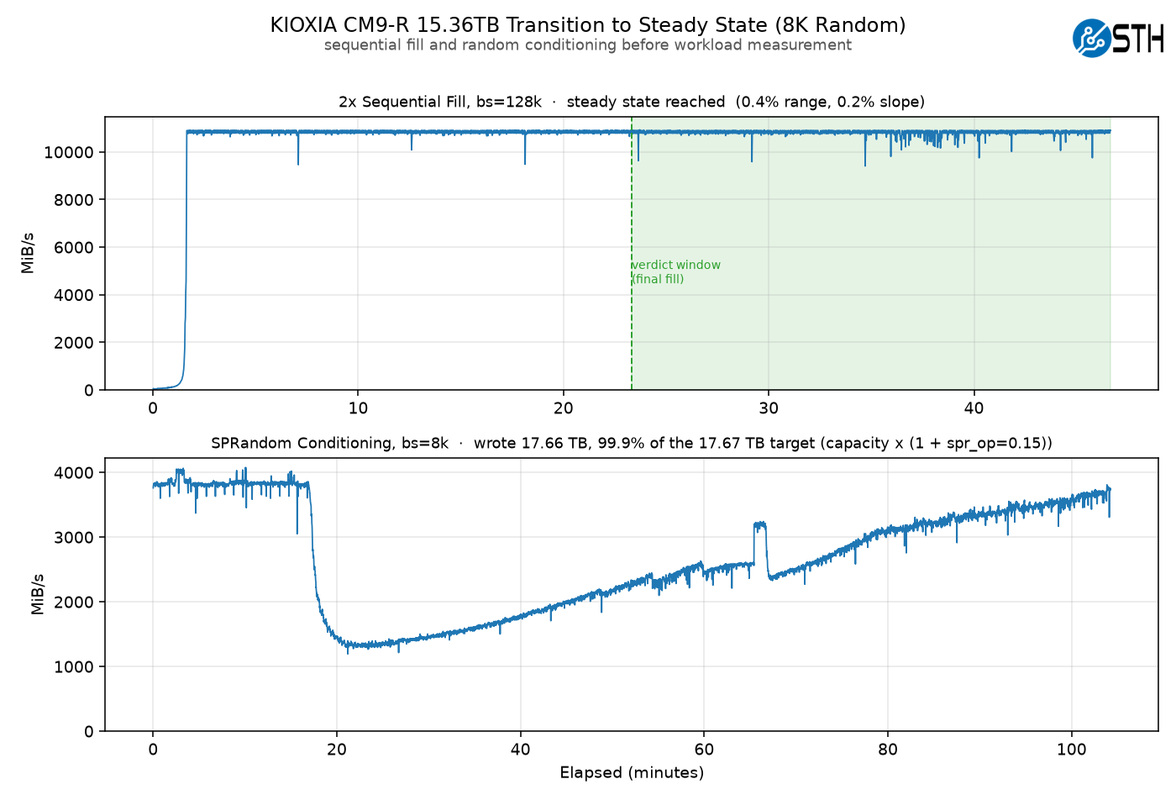
Perhaps the interesting part is that, even if you hit a very rough 15-minute patch of workload, the drive still performs at its top level. These write passes are designed to force a drive to do garbage collection and put the controllers under heavy stress.
Next, we just wanted to show 4K random read IOPS over a 300-second trace at OIO 512. We only use the final 180 seconds, starting 120 seconds into the measurement period, but this gives you more data on what we are seeing on the read side.
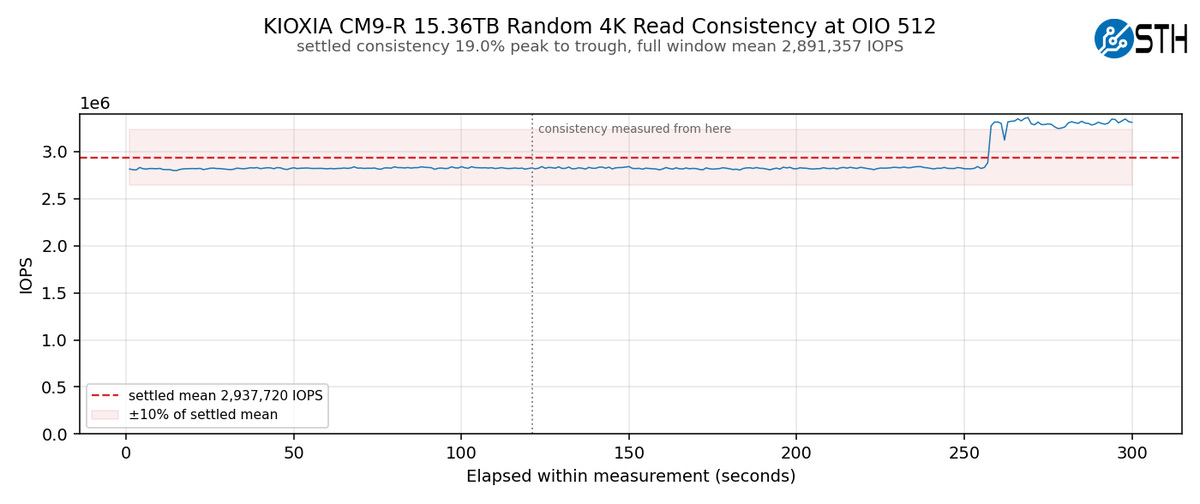
Performance holds near 2.8 million IOPS before increasing to approximately 3.3 million IOPS after 260 seconds. It was interesting to see that, post-conditioning, performance was steady and then jumped.
Here are the 4K random write IOPS over a 300-second trace at OIO 256 with a similar consistency timing setup.
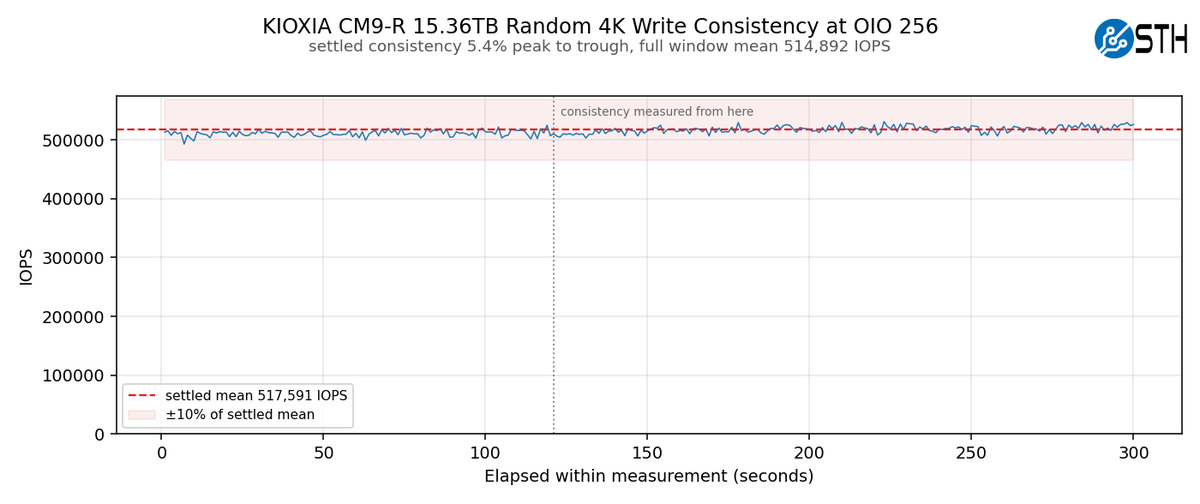
The consistency window mean of 517,591 IOPS shows a tighter 5.4 percent spread compared to the 19.0 percent read spread. It was just something neat we saw with the drives, and we thought it would be interesting to show folks.
Now, let us get into some of the more classic measurements.