
In data centers today, 2U 4-node systems are extremely popular. They give cluster administrators 50% better space efficiency versus traditional 1U form factors. While that number is easy to derive, a much harder number is in terms of power consumption savings. For over six months we have been working on a power consumption testing methodology to allow us to quantify how much power is saved in given 2U 4-node systems versus using separate servers. Today we are going to unveil a methodology that has consumed hundreds of different test configurations and we hope to see the overall industry adopt.
Challenges Testing 2U 4-Node Systems
There are a few good reasons 2U 4-node system power consumption savings are not tested by the general editorial media and are instead based on vendor testing and paid 3rd party whitepapers. Here are a few of the biggest:
- Components – getting an equivalent stack of 1U and 2U systems configured for dual socket servers will generally cost around $20,000 as a starting price for fairly minimal configurations. The “buy-in” is simply too great for most editorial publications. A common way around this is to use one server and multiply its derived figures by four. We noticed around 1.5% difference in power consumption using this method which we found was due to the servers atop and below the test servers heating up the chassis and causing higher fan speeds in the system under test. As a result, we now have “bookends” that run the same workload and provide heat above and below the stack of systems being tested. This ensures that we have real-world power consumption data.
- Environmental – to get accurate server power consumption data, at STH our minimum test run duration is 24-hours. The reason for this is that servers need to heat soak. As servers heat soak, you generally will see 2.5% to 3.5% higher power consumption. During this 24-hour period, you also need constant inlet temperature and humidity. We had to set up monitoring in side-by-side racks not just of each outlet, but also of the inlet temperature and humidity to ensure environmental factors were not increasing fan speeds.
- Workload – one needs to find a realistic workload that will run constantly for 24+ hours. Many benchmarks (e.g. linpack) do a decent job at this but push the CPUs to the top end of their power consumption. Realistically, you do not want to run servers at 100% CPU utilization as that causes performance issues. It took us months to develop a workload that stressed all of a system’s cores and consistently yielded numbers in the 75-80% of maximum power consumption range.
- Electrical – most editorial test facilities cannot handle 2kW+ loads that modern 2U 4-node systems are capable of generating. Furthermore, running a 2U 4-node dual Xeon E5 systems alongside four 1U or 2U systems for two weeks, even using inexpensive data center power, costs upwards of $300 just for electricity and requires having 4kW+ of power available.
The environmental point we wanted to show graphically using our test server, affectionately called “e5v3lowpower” which was a 1U test machine we have been running for 6 months just to validate the need for constant environmental testing and 24-hour runs.
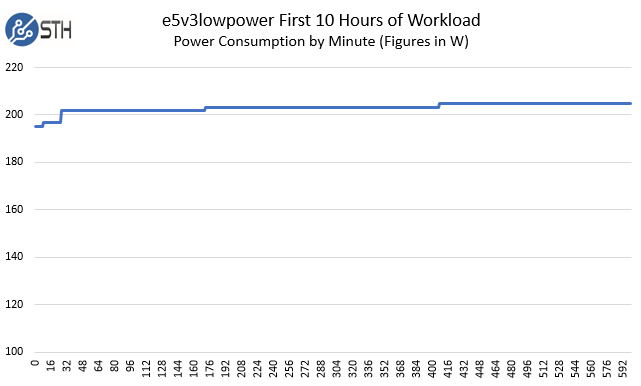
We started the x-axis to make this slightly clearer but as you can see, even at six hours the machine did not hit a fully steady state. On this particular run the racks were constant at 19.5C and 41% relative humidity yet the fans spun up slightly after many hours of use. We did change the x-axis of that run to show the small steps later in the run.
Our Industry-Leading Approach
Starting in September 2015 we rolled out our STH/ DemoEval data center lab which we built to give STH authors as well as our readers and other review sites access to a reliable testing lab. We utilize 208V 30A circuits and now have four APC per-outlet metered PDUs that we are using based on their ability to stay within 1% tolerance on all ports as compared to our calibrated Extech TrueRMS power meters we use for workstation testing. The net result was we kept less than a quarter of the $1k+ PDUs we bought and rejected due to metering tolerances. We also take temperature and humidity monitoring seriously and we log both for the duration of test runs. It took some time to setup, however, once it is in place we were able to drive a better provides for testing servers, especially 2U 4-node servers.
The Components: Intel Xeon E5-2600 V3/ V4 Generation
Our standard for testing 1U/ 2U server stacks starts with what we call the “swappable components.” These components are moved into our systems under test to ensure that our processors are the same. All Intel CPUs have a small but noticeable variance with the amount of power each chip will draw so you cannot use two different sets of CPUs and get a detailed measurement in terms of power.
- CPUs Pairs: Intel Xeon E5-2699 V4, Intel Xeon E5-2650 V4, Intel Xeon E5-2698 V3, Intel Xeon E5-2670 V3
- RAM: 8x 16GB SK.Hynix DDR4-2400 RDIMMs per server
- NICs: Mellanox ConnectX-3 EN Pro dual port 40GbE adapters – we do switch full-height and low profile brackets as required by the system being tested.
- SSDs: 4x 64GB SATA DOM -OR- 4x Intel S3710 400GB SATA (*noted in reviews which configuration was used.)
On the chip side, we tried to find a good mix of different V3/ V4 chips that we could use for this project. The SSD side was an issue because with the change to NVMe, many servers were unable to accommodate 2.5″ SATA SSDs. We have SATA DOMs that worked in all of our test systems that we are able to use if the 2.5″ SATA SSDs can not be tested.
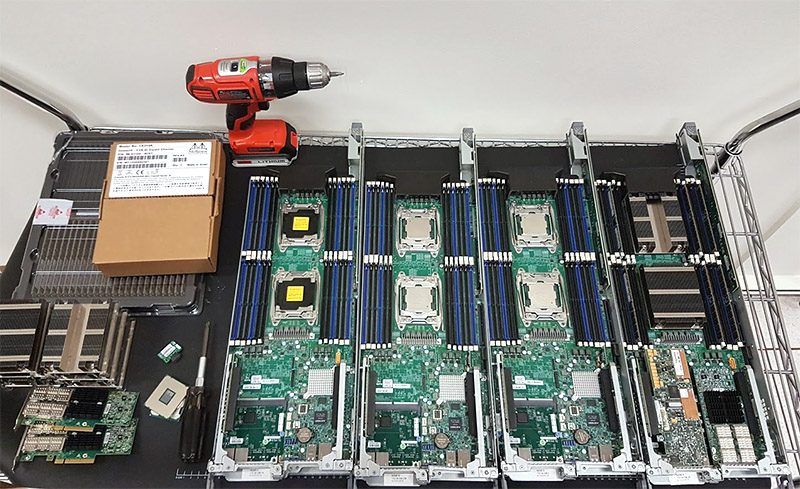
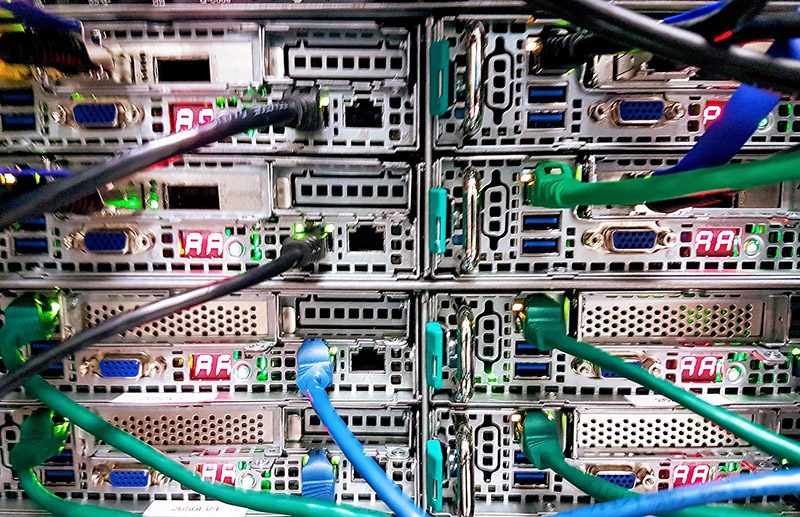
We also tested with Seagate/ LSI WarpDrive Nytro cards as you can see in the picture above, but we decided against using them for the time being due to fit issues in some 2U 4-node platforms.
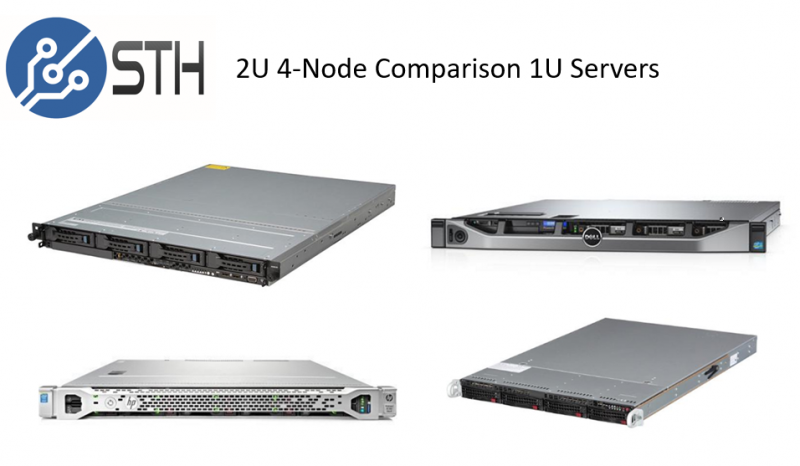
The Servers: 1U Stack for Comparison Data Generation
We use a stack of four servers for the 1U comparison servers. We did not want our 2U 4-node results to turn into a brand-specific comparison which is why we used four different vendors.
- HPE DL160 Gen9
- Supermicro SYS-6018R
- Dell PowerEdge R430
- ASUS RS500-E8-PS4
We purchased these servers as absolute barebones since we had the rest of the CPUs, DDR4 RDIMMs, SSDs and interface cards we wanted to use for these tests. They spent months in slightly different temperature and humidity environemnts so we could collect data. Interestingly enough, the four servers prove to be relatively close in power consumption when we take them down to use single power supplies instead of redundant units, that changes when we use redundant power supplies. We will likely do an update based on next-generation Skylake-EP servers since it is getting later in the E5 V3/ V4 cycle.
Sandwiching and Rack Positioning
Our test methodology circa-2014 when we used lower power 15A/20A 120V racks found an interesting environmental interaction. In lower power racks we often had more space than power. As a result, servers ran at slightly lower power consumption than when they had running systems above and below. We also saw in our own hosting clusters at two different data centers that our 1U systems with air fed from floor or ceiling vents would have different power consumption, running the same constant workloads over time. We did experimentation actually shuffling the order of systems and found that the trends were dictated more by location than the physical system. These were small variances but we wanted to capture them which lead us toward using four separate machines instead of multiplying the power consumption of one system by four. Here is a graphical representation of the two stacks in relation to where airflow comes from in our lab (floor tile vents.)
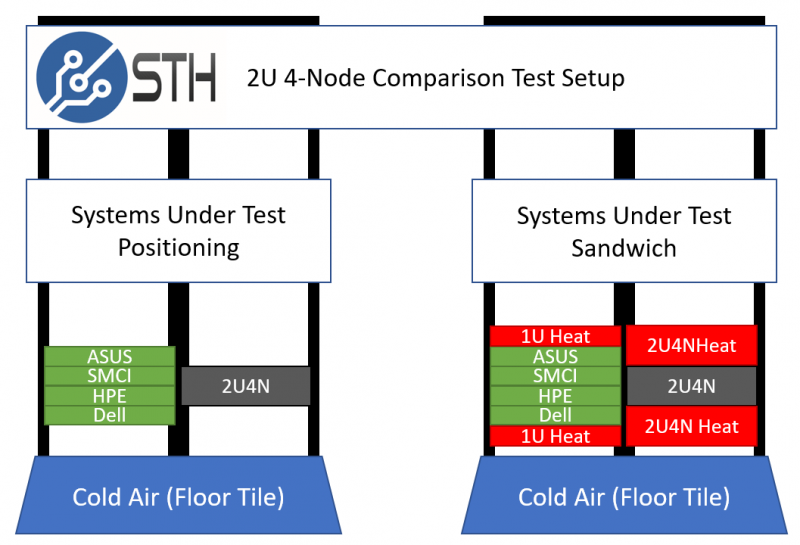
We then layered on the next level of complexity: sandwiching. In a real-world deployment of four nodes, there is a rack full of servers. Since we were trying to compare 2U 4-node systems to four separate systems, we needed four additional chassis to heat up the top and bottom of the systems we are testing. For our 1U systems, we use a pair of 1U servers equipped with E5-2650L V3 CPUs that generate 200-203W of power consumption above and below the systems under test. We then use two ASUS 2U 4-node chassis each with 96 cores/ 192 threads worth of Intel Xeon E5 V4 power to heat the top and bottom of the 2U 4-node systems under test. We call this the “sandwich.”
And here is an example shot with the upcoming ASUS RS720Q-E8-RS8-P that will be reviewed with its 40GbE adapters and the first heat generation 2U below it (apologies, did not have a lot of lighting for this shot):
As you may imagine, firing up a total of 12x dual Intel Xeon E5 nodes requires over 4kW of power to perform a test run, not including any other equipment in the rack (e.g. switches.)
Final Words
At STH we are building industry leading editorial capabilities. While most reviews elsewhere of enterprise equipment are done in homes, we are building real-world test scenarios equipment must go through. It is extremely resource intensive. We have been able to develop these capabilities due to our DemoEval side where we can create customized demos for companies in our Silicon Valley data center. Over the past two years, some reviews you may have read of enterprise equipment have also leveraged our infrastructure. Our aim is to be able to create the best data sets and the best experience for anyone interested in server hardware.


