Rendering Related Benchmarks
Next, we wanted to test the rendering performance of the card.
Arion v2.5
Arion Benchmark is a standalone render benchmark based on the commercially available Arion render software from RandomControl. The benchmark is GPU-accelerated using NVIDIA CUDA. However, it is unique in that it can run on both NVIDIA GPUs and CPUs.

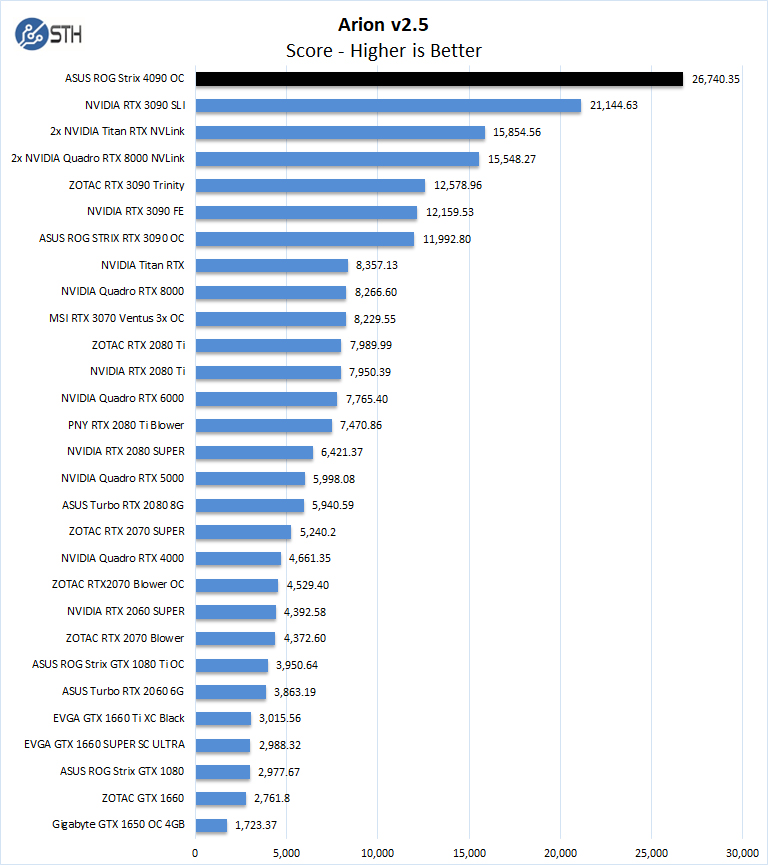
Like our first set of benchmarks, the ASUS ROG Strix 4090 OC shows impressive single GPU results.
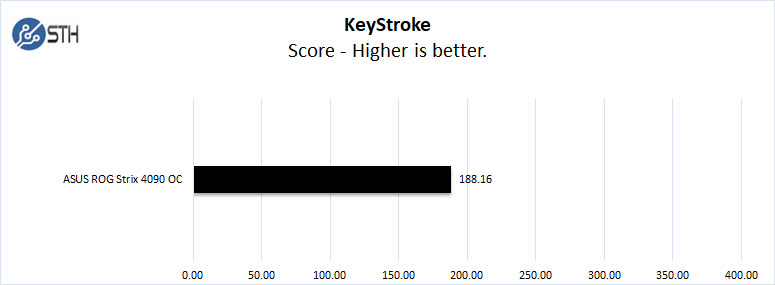
KeyShot
KeyShot Viewer is a free found, stand-alone application for sharing KeyShot scenes for others to view and interact with your visuals, and the KeyShot Benchmark is a simple yet powerful tool to test your CPU and/or GPU and evaluate their performance. It can be found here.
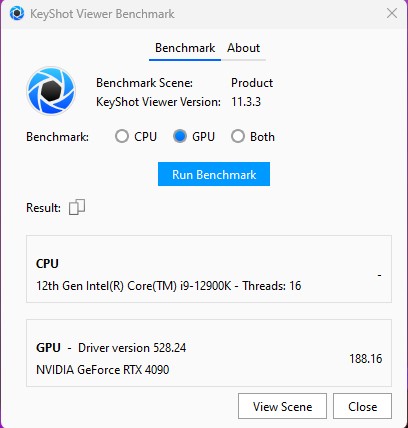
The results are multiples based on render time. Higher scores are better and scores higher than 1.0 are better than the reference system. The reference system is an Intel Core i7-6900K CPU @3.20GHz, 2601 Mhz, 8 Core(s). A score of 1.0 matches the speed of the reference system. A score of 2.0 would be double the speed of the reference system.
As we can see a score of 188.16 is almost double the speed of the reference system. We only used the ASUS ROG Strix 4090 OC in this test. Our Intel Core i9-12900K (8x Performance Cores / 8x Efficient Cores – 16x Threads) generated a score of 2.46. For a total score of 190.62.
OctaneBench
This benchmark has a new version, and we only have one entry at this time. This will be one that we update with future GPUs as we add them to the data set.
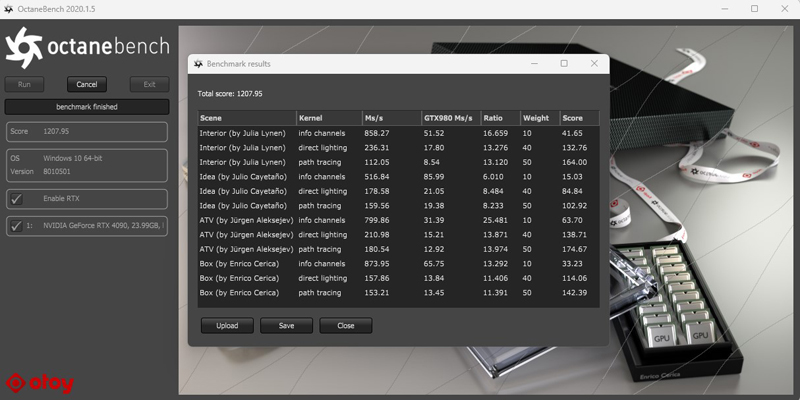
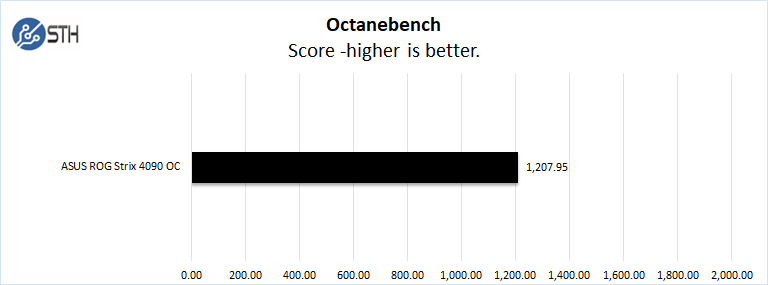
In this benchmark, the ASUS ROG Strix 4090 OC generated a score of 1207.95, while an RTX 3090 came in at 677.12.
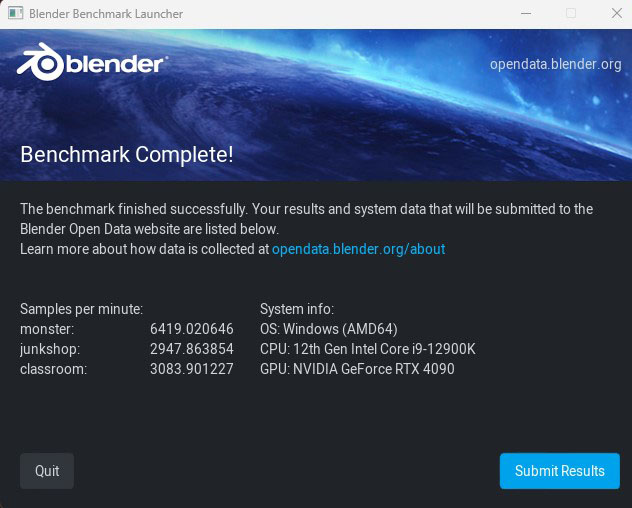
Blender
You can download the Open Data Benchmark from the opendata.blender.org homepage with versions for Windows, Linux and macOS. You can then select any number of the 7 benchmarks (details listed below) to run on your choice of Blender version and render device (CPU / GPU). The benchmark will also gather non-identifiable data on your system setup, details of which can be found below. Once the benchmark is complete you can share your results on Blender Open Data publicly.
Blender Benckmark
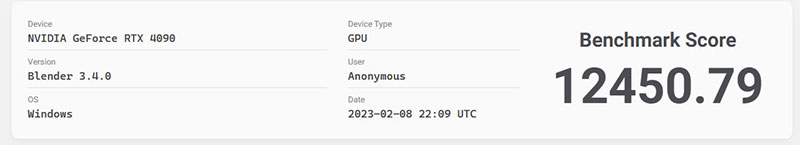
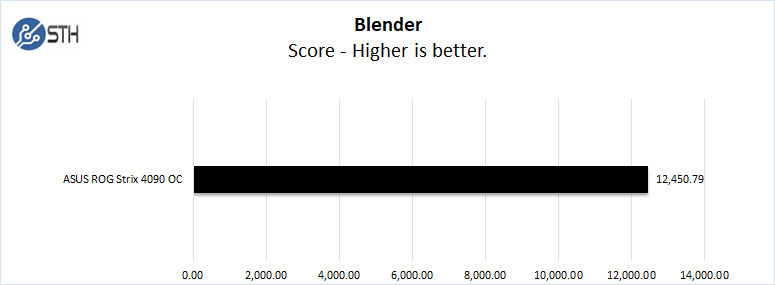
The ASUS ROG Strix 4090 OC showed excellent results and topped the chart with its 12,450 point score vs. the highest recorded at Blender – Open Data at 12,167.93.
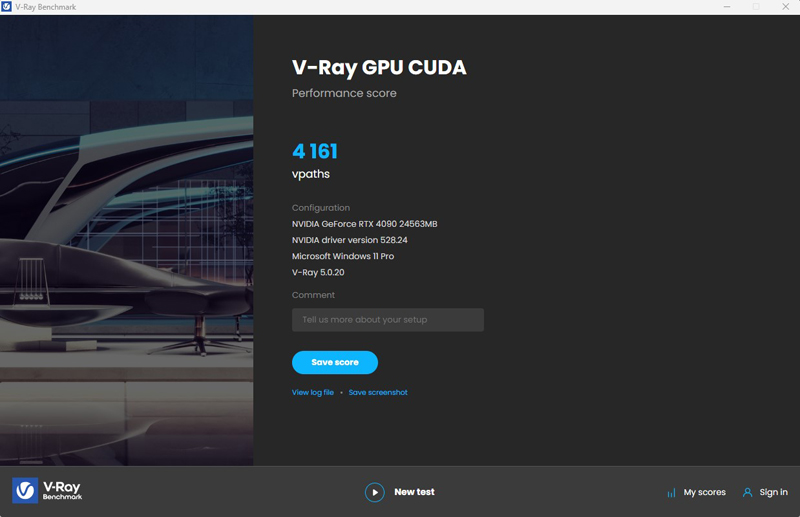
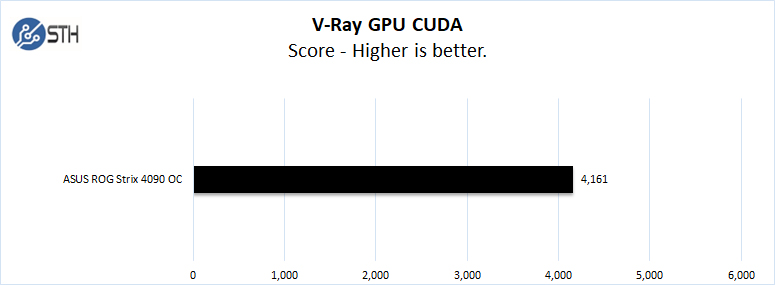
V-Ray
V-Ray does Photorealistic rendering and real-time visualization using CUDA and RTX benchmarks.
V-Ray GPU CUDA
V-Ray GPU RTX
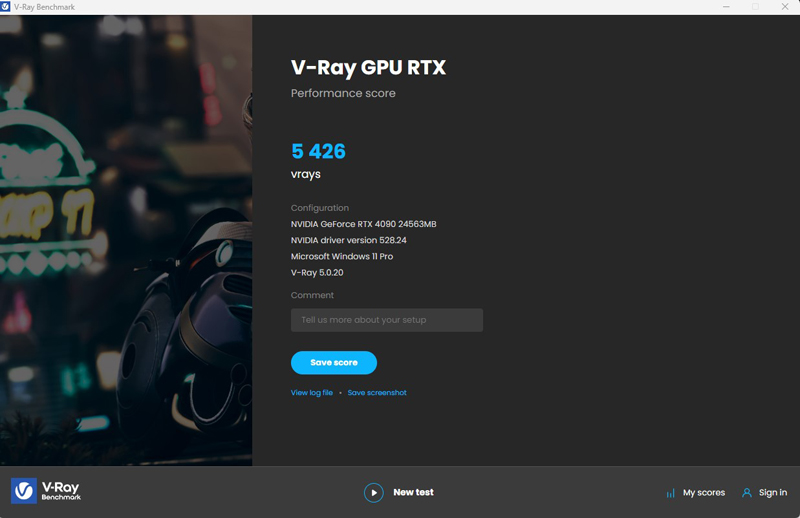
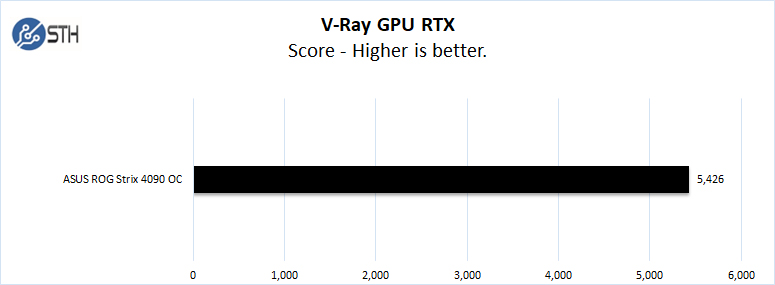
At this time, we only have one GPU to show results for. We do see respectable results, however. This will be added to future reviews.
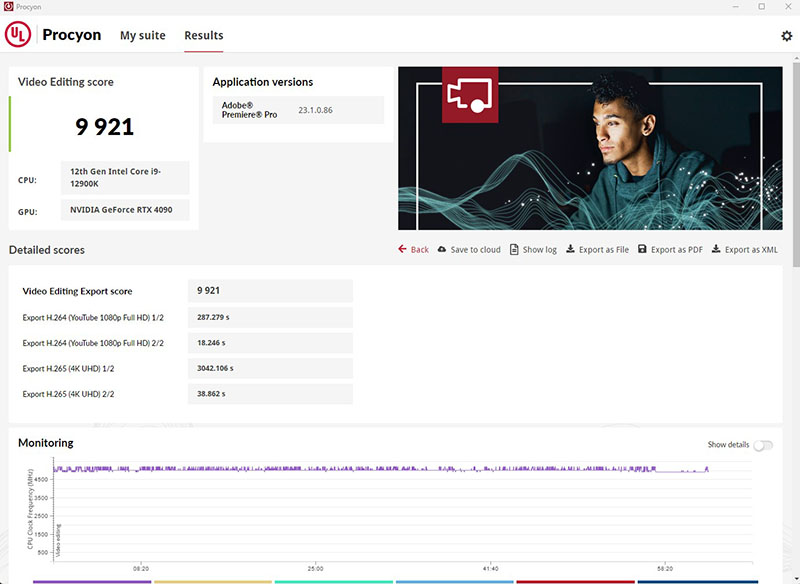
UL Procyon
UL Procyon—benchmarks for professional users. Procyon is a new benchmark suite from UL that we’re creating specifically for professional users in industry, enterprise, government, and retail.
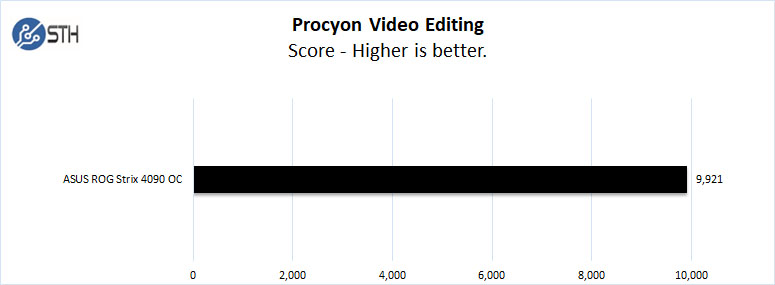
UL Procyon Video Editing
This benchmark compares the video-editing performance of Windows PCs aimed at creators, enthusiasts, and creative professionals. This test is based on the typical workflow when creating content for online video-sharing platforms.
The benchmark uses Adobe Premiere Pro to export video project files to common formats. Each video project includes various edits, adjustments, and effects. The benchmark score is based on the time taken to export the videos.
UL Procyon Photo Editing
This benchmarks PC performance against the demands of a typical photo-editing workflow. This benchmark measures the performance of Windows PCs designed for creators, enthusiasts, and creative professionals.
The benchmark uses Adobe Lightroom to import, process, and modify a selection of images. In the second part of the test, multiple edits and layer effects are applied to a photograph in Adobe® Photoshop.
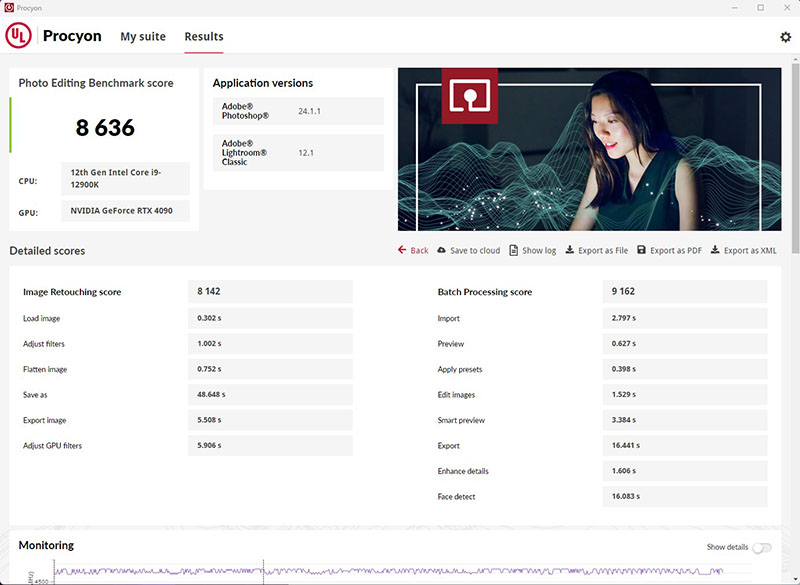
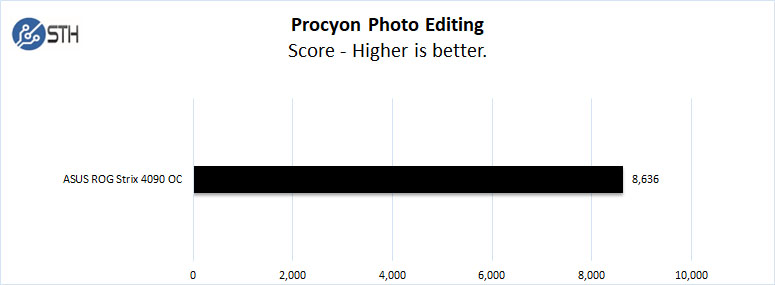
This is the first set of tests for these two benchmarks. We plan on using these going forward. Overall these scores are very high, and the 4090 chews through these with ease. They are long-running benchmarks, so they give the 4090 a very good workout.
Next, we will have Unigine and 3Dmark-related Benchmarks before moving on to power consumption, thermals, and our final thoughts.


Well Done Perfect Review!
Im for sure getting the 4090oc
Thank you
Eric
Comments are closed.