
ASRock Creator Radeon AI Pro R9700 AI Performance
Since the ASRock Creator Radeon AI Pro R9700 is promoted first and foremost as an AI inference card, we will start with a look at the performance of a couple of different Qwen models.
Qwen3.8-27B
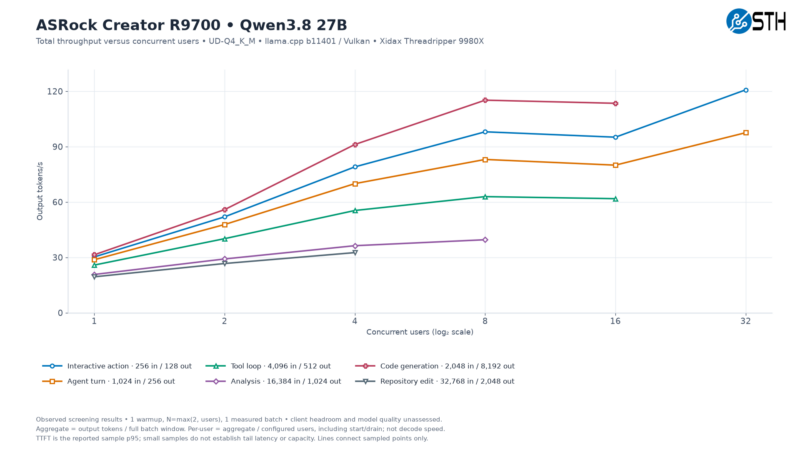
Starting with throughput versus concurrent users, we have several workloads (phases) with Qwen3.8-27B quantized to 4-bit precision. All six of the workloads start at around 20 to 30 tokens/second, which, if nothing else, goes to show how heavy a workload Qwen3.8 is. But like most inference workloads, we do see performance improve as the number of concurrent users is ramped up and more of the workload is shifted to decode.
Code generation is the greatest beneficiary, going to over 113 tokens per second by the time we hit 16 concurrent users, a 3.6x improvement in total throughput. The other workloads do not scale up by quite as much, with the agent turn phase topping out at 97 tokens per second at 32 users. But on the flip side, even the relatively slow tool loop phase has already cracked 50 tokens per second by the time we hit 4 users.
By far the slowest phase is the repository edit task. While it starts off the lowest as well at just 19 tokens per second, ramping it up to 4 users only gets us as far as 33 tokens, a 74% increase.
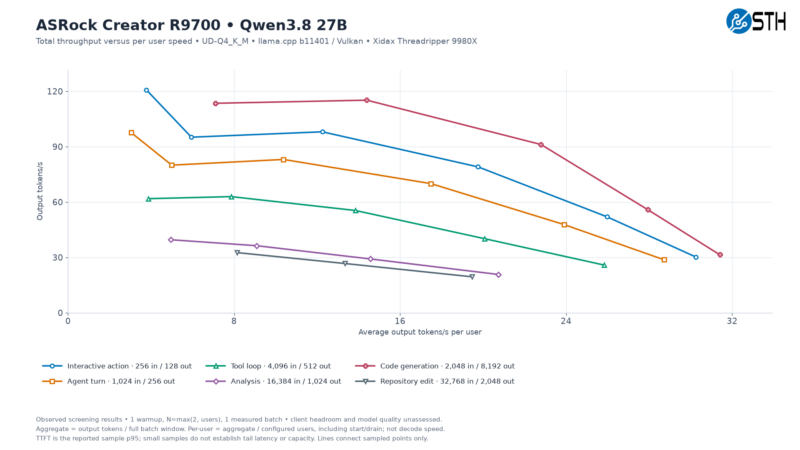
The trade-off to that, of course, is that while the overall token throughput generally increases, it is not fast enough to keep up with the increase in users, resulting in a drop in tokens generated per second on a per-user basis. Looking at the p50 (median) throughput on a per-user basis, keeping the lighter workloads above 60 tokens per second concurrently means loading up enough users that each user is getting less than 8 tokens per second.
The exact relationship is pretty much the inverse of our first chart. The more a phase benefits from concurrency of users, the bigger the drop-off from funneling those resources into fewer users.
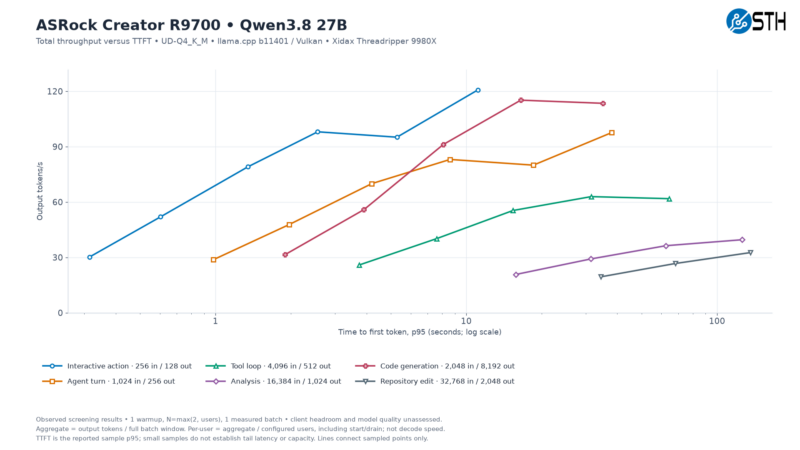
Similarly, we see a similar set of tradeoffs between throughput and time to first token. Though this is highly workload-dependent, and it is not as simple as the fastest phase (e.g., code generation) having the fastest time to first token. All of the phases show significant TTFT increases when ramping up the overall performance, though this might just be the most interesting graph since it is the only time that any of the curves cross each other, in this case, code generation and the agent turn.
Regardless, by the time we are at 32 users, the TTFT for every phase is over 10 seconds, with the most intensive phases, analysis and repository editing, surpassing 100 seconds to get their first token. With these performance results there is no way to get TTFT down to sub-10 second levels for every phase, but 4 users seems to be the closest thing to a sweet spot before more than half the phases cross the 10 second mark.
Qwen3.6-35B
Meanwhile, we also have the slightly older (but still very useful) Qwen3.6-35B-A3B. Here we are using the 35 billion parameter mixture-of-experts model that has been quantized down to 4 bits, and further changes things up by only having 3 billion active parameters at a time.
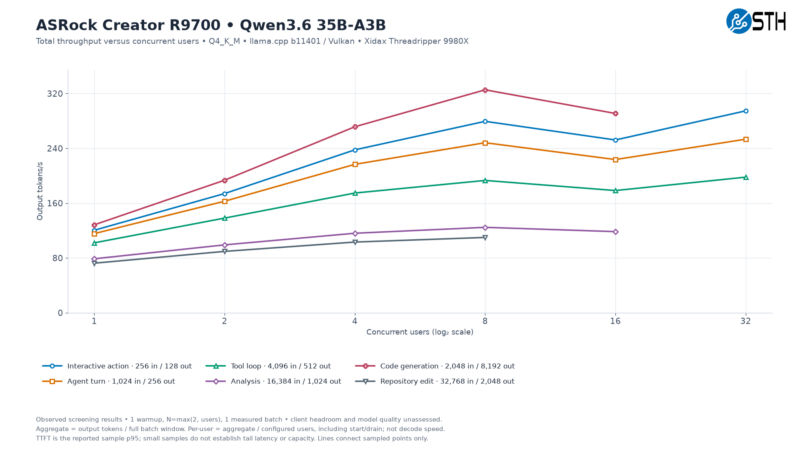
The smaller number of active parameters that need to be processed provides for some immediate gains in performance. Here, every phase starts with a token output rate of at least 75 tokens/second, with code generation starting at a blistering 128 tokens/second. Scaling up the number of concurrent users, in turn, pushes performance even higher, though not by an extensive degree. By the time we are at 4 concurrent users, the analysis phase is generating about 105 tokens/second, while the total loop is a bit past 155 tokens/second; an increase of around 36% and 50%, respectively.
There is a bit of an interesting regression around the 16 user mark, though. All of the phases tested at that level lose at least some performance, with the fastest phases naturally losing the most. Things do pick up at the 32-user mark, but the overall throughput gains are quite limited relative to the throughput at 8 users. In Qwen3.6 35B, at least, 8 users is as high as we need to go on the R9700 to extract the bulk of the card’s performance.
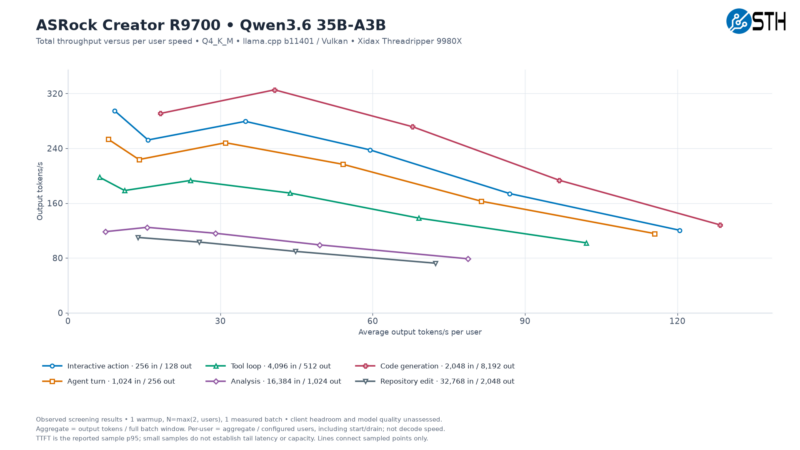
We also see the familiar performance-degradation curve when looking at performance on a per-user basis. The median total token rates drop by upwards of 35% as we shift the emphasis to higher token rates for each individual user. Conversely, the 8-user mark is fast enough to give every user a comfortable rate above 30 tokens per second per user.
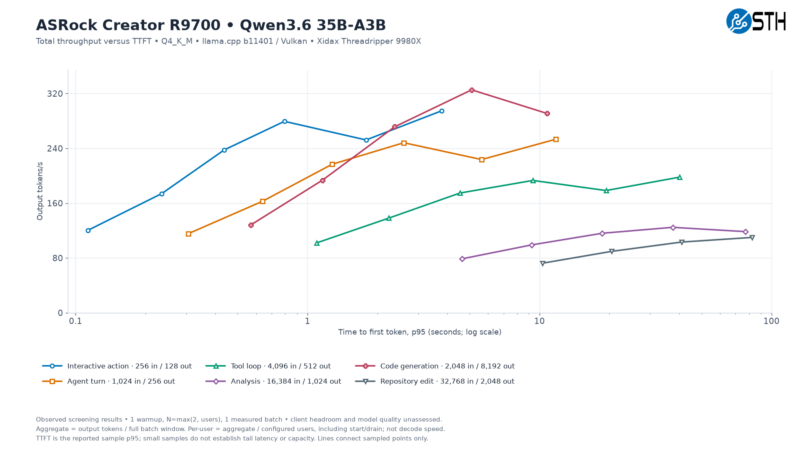
Finally, here is a look at TTFT with Qwen3.6. Allowing for longer TTFTs affords us quite a bit more total throughput. But even on this faster model, going to 32 users pushes TTFT above 10 seconds for almost all phases. The one exception here is the interactive action phase, which tops out at 4 seconds. Otherwise, the 8-user mark sees everything other than the analysis and repository edit phases (which are once again the most intensive) stay under the 10-second mark. With a single user, it is possible to get everything except for those workloads and the total loop TTFT under 1 second. This is still almost four times faster than what we saw for TTFT in the same scenario with Qwen3.8-27B.
Performance Comparison: GeForce RTX 5090
As we have been building out our database of video card/AI accelerator LLM performance results, we have also had a chance to run NVIDIA’s GeForce RTX 5090, the company’s flagship video card.
This is not an especially fair comparison here, as the RTX 5090 is several times the price of ASRock’s Creator Radeon AI Pro R9700 (and if rumors are to be believed, the card has been discontinued). Nonetheless, it provides a relevant piece of context for seeing how the R9700’s performance compares to some of the other hardware on the market.
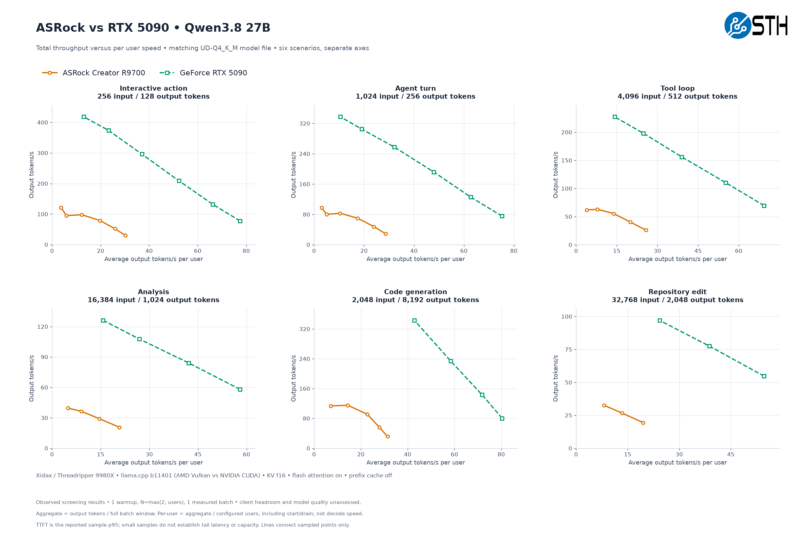
Our graphs for Qwen3.8-27B comparing total throughput to per-user token speeds are the most useful visualization here. At peak throughputs, RTX 5090 is almost four times faster than the R9700, and sometimes more. In terms of absolute per-user rates, even the most analysis phase is over 15 tokens per second per user with 8 users. The RTX 5090 starts much higher and can sustain more users before per-user performance drops too far.
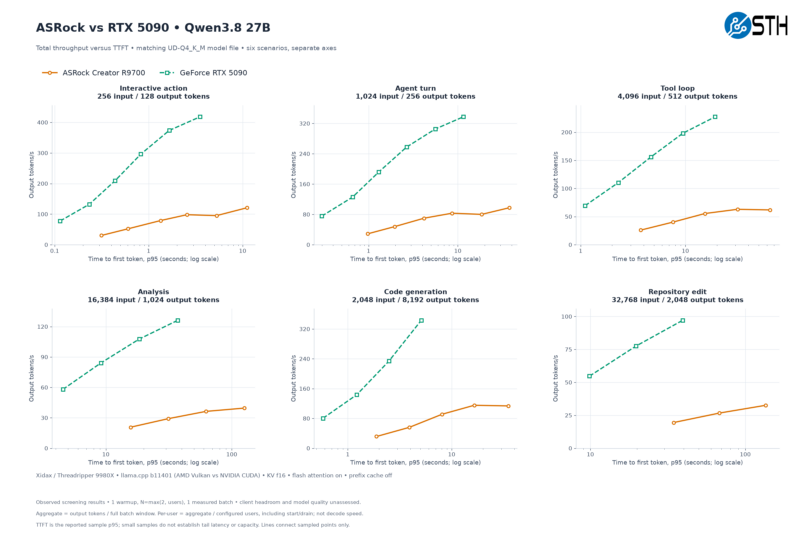
Times to first token a bit closer, however. The RTX 5090 has fewer instances where TTFT exceeds 10 seconds under high user counts. The analysis phase remains the most performance-draining, with the RTX 5090 still needing just under 5 seconds to spit out the first token even with a single user.
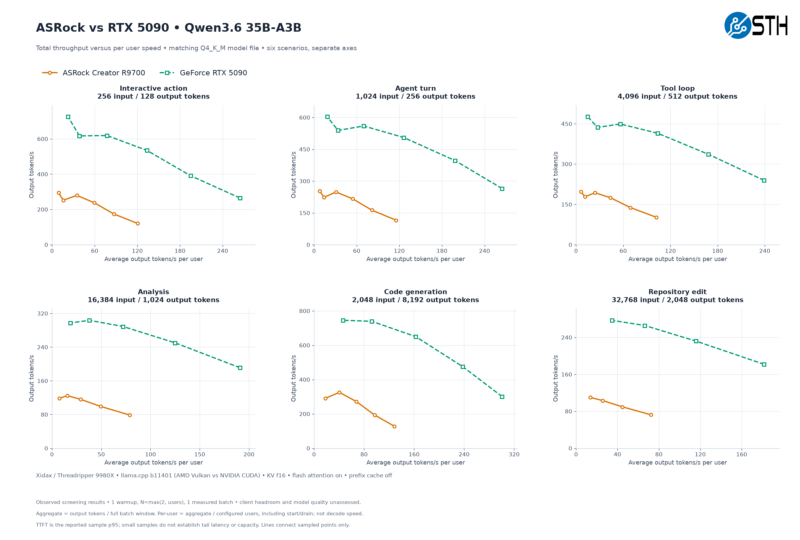
For our final LLM performance graph, here is the total throughput versus per-user speeds for Qwen3.6-35B. The R9700 still significantly trails the RTX 5090 here. But the overall rates are closer. The performance gap is closer to 3-to-1 in favor of the NVIDIA card with high user counts, while at low user counts this can drop to as low as 2-to-1, such as in the code generation phase.
This hints that the R9700 may be a particularly good value for low user concurrency workloads. Though as models are changing all the time (and even Qwen 3.6 will quickly become dated), this is definitely something that large buyers should test first before making any major purchasing decisions.