2nd Gen Intel Xeon to 5th Gen Intel Xeon Performance
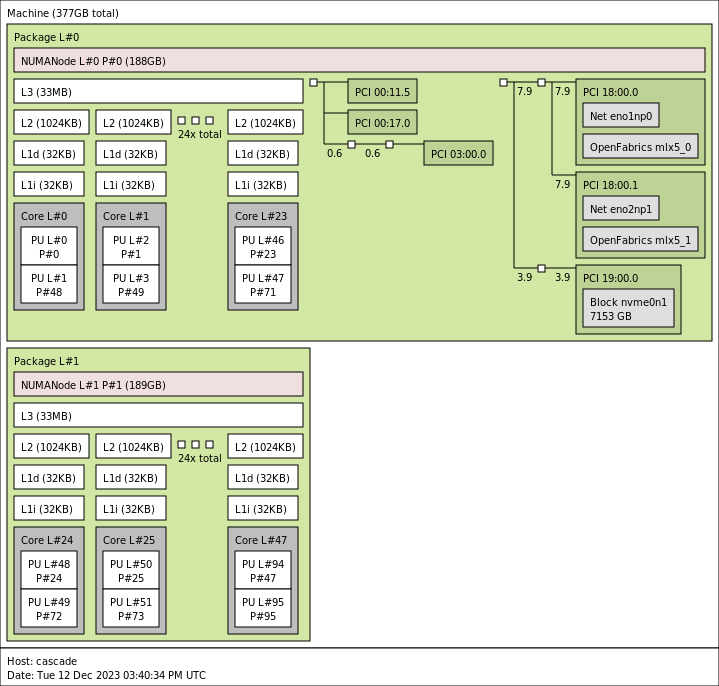
To look at performance, I wanted to focus on something other than the top end. That started a process of which SKU we should use. For that, I asked Supermicro what its most popular SKU was for the 2nd Gen Intel Xeon servers. They looked at their internal data, which can be skewed by a few large customers, but it was the best we had. That led us to the Intel Xeon Gold 6252, a 24-core processor.
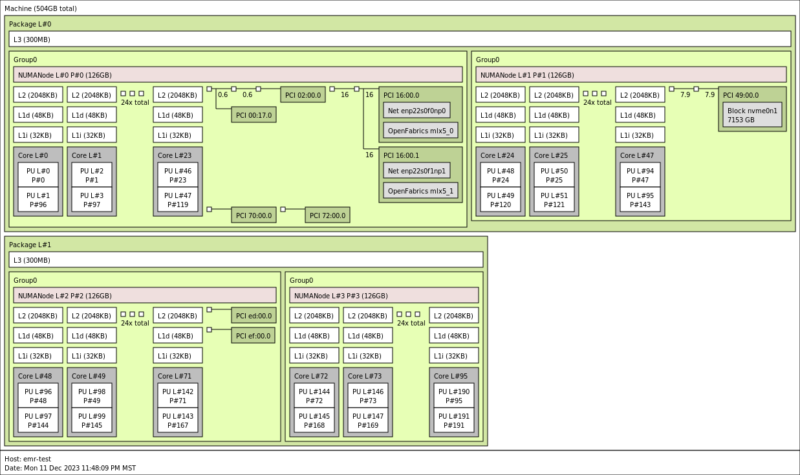
For the 5th Gen, since we have higher core counts, I thought it would make some comparisons easier to have twice as many cores, so we found some Intel Xeon Platinum 8568Y+ parts. Here is what they look like with NPS=2 on each socket so each CPU is split into two logical 24-core segments.
Now, there are many organizations that assign cores to virtual machines and then underutilize the cores. Think of the applications that get 2 vCPU or 4 vCPU VMs and then run at 5% CPU utilization for years. If your organization simply uses core counts, then your consolidation ratio is 2:1 moving from 24 core to 48 core CPUs. The per-core performance is faster, as we will show in this section, but for many organizations, that is how refresh sizing happens.
For those who care about performance, we have some numbers for you.
Python Linux 4.4.2 Kernel Compile Benchmark
This is one of the most requested benchmarks for STH over the past few years. The task was simple: we had a standard configuration file, the Linux 4.4.2 kernel from kernel.org, and made the standard auto-generated configuration utilizing every thread in the system. We are expressing results in terms of compiles per hour to make the results easier to read.
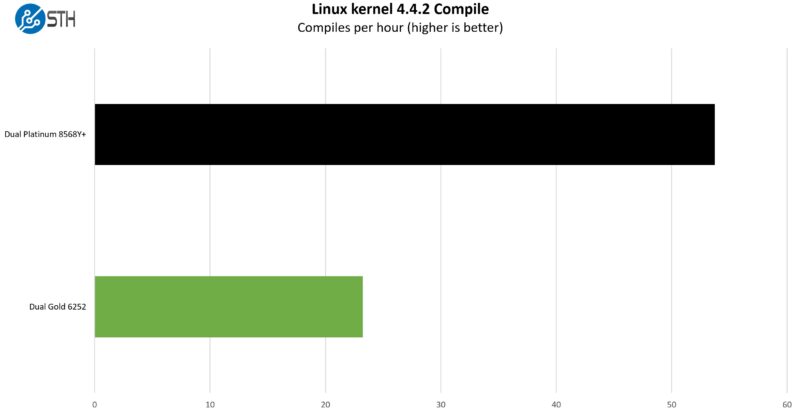
At around 2.3x the performance we are seeing a bigger increase in total performance than just the core count would lead us to.
c-ray 1.1 Performance
We have been using c-ray for our performance testing for years now. It is a ray tracing benchmark that is extremely popular for showing differences in processors under multi-threaded workloads. Here are the 8K results:
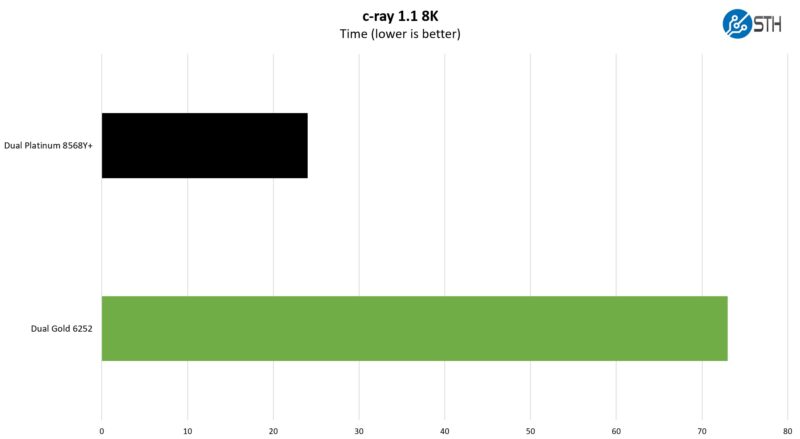
This is one where the new architecture is just doing better at closer to 3x the performance. To be frank, this is one that performs better on some architectures than others.
SPEC CPU2017 Results
SPEC CPU2017 is perhaps the most widely known and used benchmark in server RFPs. We do our own SPEC CPU2017 testing, and our results are usually a few percentage points lower than what OEMs submit as official results. It is a consistent ~5% just because of all of the optimization work OEMs do for these important benchmarks. This is a bit different than a normal launch since OEMs have already published performance numbers, so it feels right to use the official numbers if we are talking about a benchmark.
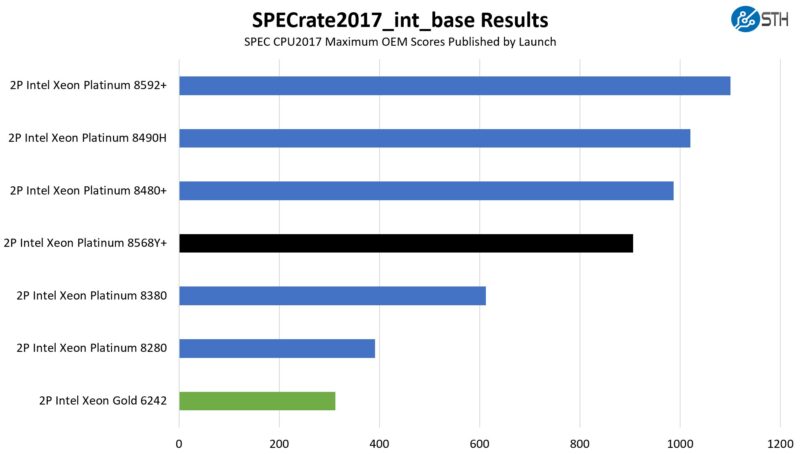
First, we are going to show the most commonly used enterprise and cloud benchmark, SPEC CPU2017’s integer rate performance.
On the floating point side here are the figures:
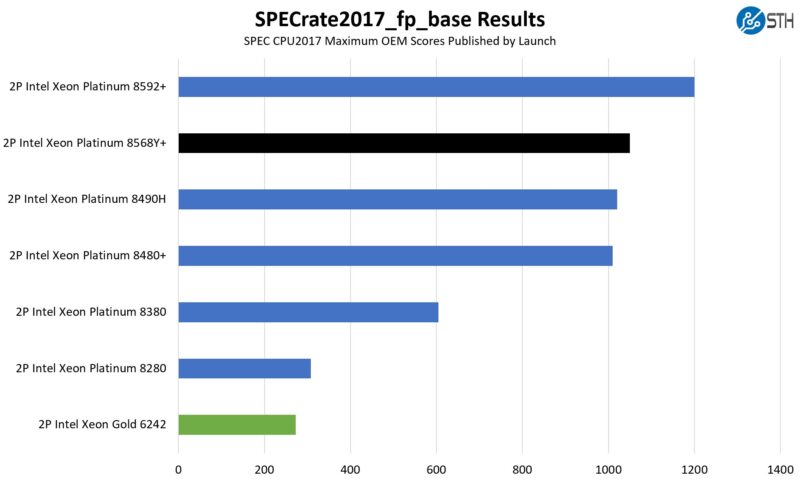
We put some figures for the top-bin parts in each generation as well just to put the numbers in perspective. The two SKUs we have are not the top-end but are in the upper half of SKUs for their generations.
The integer side saw a roughly 2.9x gain, while the floating point side was closer to 3.8x. Those are pretty massive gains for ten quarters.
STH nginx CDN Performance
On the nginx CDN test, we are using an old snapshot and access patterns from the STH website, with DRAM caching disabled, to show what the performance looks like fetching data from disks. This requires low latency nginx operation but an additional step of low-latency I/O access, which makes it interesting at a server level. Here is a quick look at the distribution:
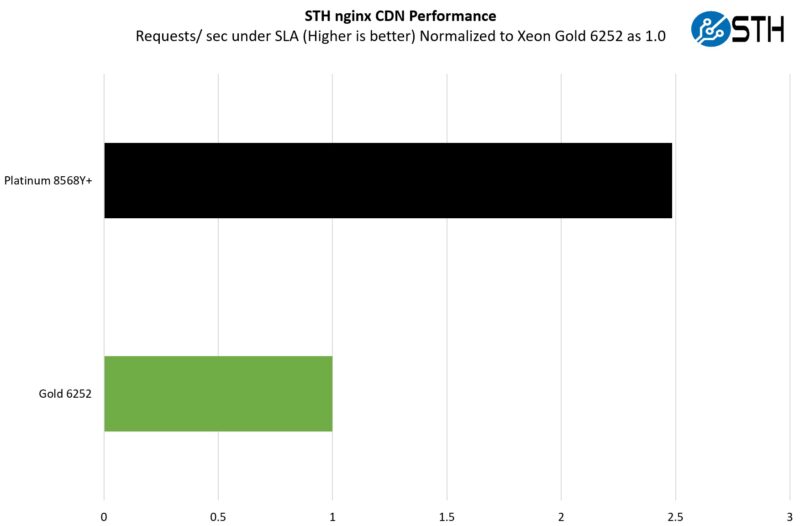
Running a very real-world workload for us, we got just shy of a 2.5x performance uplift. To be fair, this is also a workload that can see the SSL connections get offloaded to QuickAssist accelerators. At the same time, it is also one of the poster child applications for cloud native processors.
MariaDB Pricing Analytics
This is a very interesting one for me personally. The origin of this test is that we have a workload that runs deal management pricing analytics on a set of data that has been anonymized from a major data center OEM. The application effectively looks for pricing trends across product lines, regions, and channels to determine good deal/ bad deal guidance based on market trends to inform real-time BOM configurations. If this seems very specific, the big difference between this and something deployed at a major vendor is the data we are using. This is the kind of application that has moved to AI inference methodologies, but it is a great real-world example of something a business may run in the cloud.
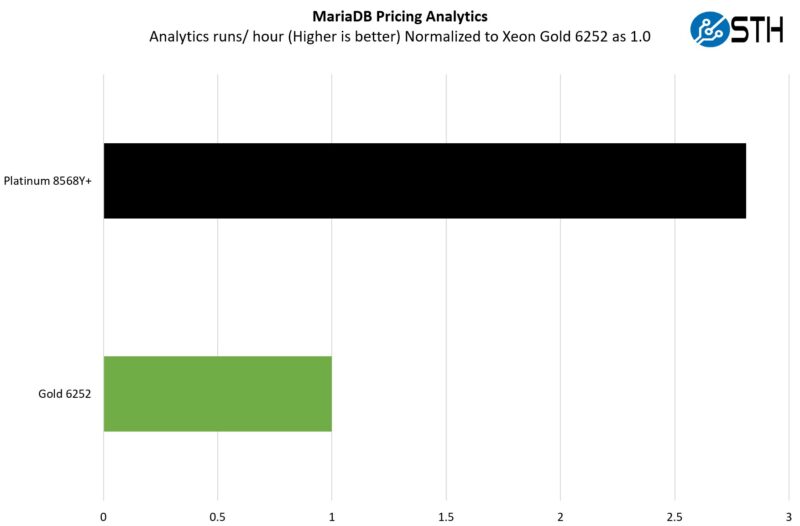
Here, the net gain is closer to 2.8x. Today one would likely run this as an AI inferencing task and use AMX for a bigger performance increase, but this is running a financial model that has to be accurate because there were revenue recognition implications for the company.
STH STFB KVM Virtualization Testing
One of the other workloads we wanted to share is from one of our DemoEval customers. We have permission to publish the results, but the application itself being tested is closed source. This is a KVM virtualization-based workload where our client is testing how many VMs it can have online at a given time while completing work under the target SLA. Each VM is a self-contained worker. This is very akin to a VMware VMark in terms of what it is doing, just using KVM to be more general.
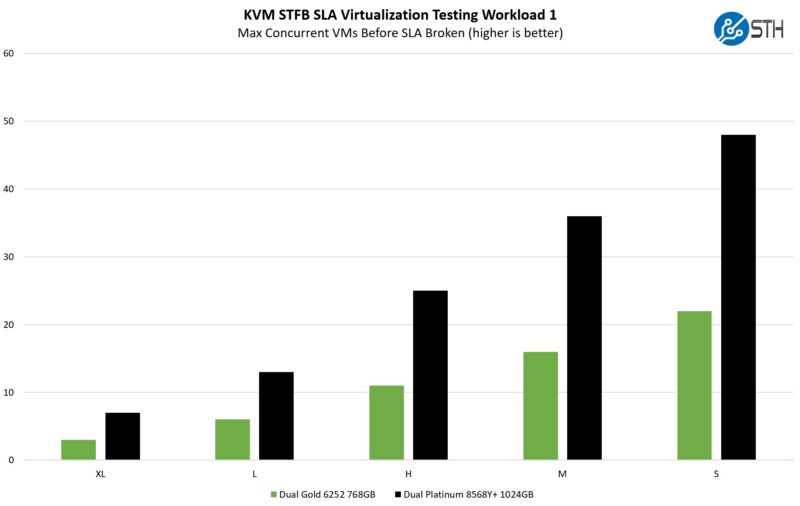
On the virtualization side, we got a bit more than the benefit of having twice as many cores, and sometimes for a simple reason. Having more DIMM slots means that we had more memory in our configurations for the 5th Gen Intel Xeon parts which is what helped the small VM size results. On the more CPU-constrained XL side, the results were a bit closer, but the new generation still had a massive lead.
Now, we are specifically just focusing on lift-and-shift legacy workloads. We are not utilizing features like Intel AMX for AI, nor are we using built-in accelerators. Those offer enormous generational gains, but many legacy applications will not be built to use those features. Many of these legacy workloads will be candidates for cloud-native processors in 2024 as that market matures.
Next, let us wrap this up in our key lessons learned.
2nd Gen Intel Xeon to 5th Gen Intel Xeon Power Consumption
We took our two Supermicro servers and did a quick head-to-head on the power consumption side.
Idle power consumption was generally in the 80-100W for the 2nd Gen Intel Xeon system, while it was roughly double that for the newer system. Under load, the older systems would often run at 600W-700W maximum, while the newer systems were in the 900W-1kW range.
The newer systems clearly use more power. At the same time, assuming the systems are loaded to around 70%, one is often getting 2-3x the performance for about 1.4x the power.
That is really the power of the consolidation with the new chips. Again, this is going to be a big theme in 2024, but if your organization is running out of power in the data center, and is accustomed to just buying P-core Xeon, then that gives you some idea of what to expect.
Next, let us get to key lessons learned.


Xeon naming schemes make no sense. New socket restarts the series at 1st gen?! WHAT?!
Snek – not exactly. They also renamed them to “xeon scalable processor”. And, they changed the socket after 2nd Gen, and again after 3rd Gen, and didn’t restart the generations.
Author – would have been more of a ‘fair fight’ had you gone with same core count, and same level of processor, i.e. gold vs gold.
Not to say Emerald Rapids shouldn’t beat the pants off Skylake or Cascade Lake, but you’ve skewed the tests.
I’m with Bhahbh – I don’t really understand the reasonings behind going with the 24 core vs the 48 core. I mean, maybe if the new 48 core were the same price as the 24 core (which you can still get new from most major OEM’s at this point as Cascade Lake) it would make sense. But that’s not the case at all. Everything is more expensive (platform, processors, etc).
Going with the middle of the road processor totally makes sense, but the 48 core isn’t going to be middle of the road for most SMB’s.
Our university decided to buy a new HPC with Sapphire Rapids 8490H. Slightly disappointed with the non-HBM system as well as the timing of deploying sapphire rapids (July 2024)
But after reading this article, I would absolutely take the 4X floating point per node performance increase from Xeon Gold 6154
I suspect 2-3x price hike for new generation of servers so the performance gain per Dollar is negligible.
– What is the price story of consolidation?
– Are both servers priced similarly so we are comparing ±10K$ servers?
Comments are closed.