The Intel Xeon Scalable T series parts. It has taken us several months to do this comparison because we just recently received a few sets in the lab. Since we have more than half of 2017’s server CPU lineup, we wanted to validate an assumption, that the Intel Xeon Scalable “T” series CPUs are essentially the same speed as their standard counterparts. We recently had a few vocal readers suggest that our assumption that the performance of the chips would be similar is false. Today we are going to present data showing otherwise.
What Does the T in an Intel Xeon Scalable CPU Denote
As a bit of background, here is the naming convention key for the Intel Xeon Scalable CPU family:
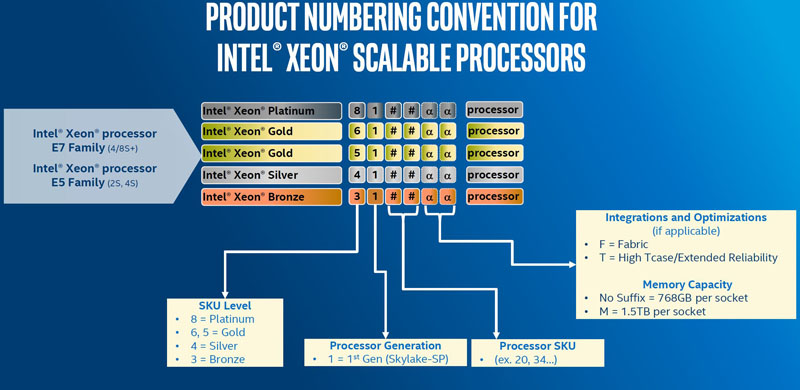
In essence, the Intel Xeon Scalable T series is a set of CPUs that are designed to operate at elevated thermal thresholds. They also have a longer support cycle for embedded applications. A good example of where one may use something like a T CPU is in a rugged server that will be deployed in a harsh environment.
Here is the initial T series CPU list that we received:

You will notice that the vast majority of the CPUs have standard non-T counterparts. For example, the Intel Xeon Silver 4116 and the 4116T. One exception that we recently got into the lab is the Intel Xeon Gold 5119T which does not have a publicly available non-T counterpart (e.g. a Gold 5119.)
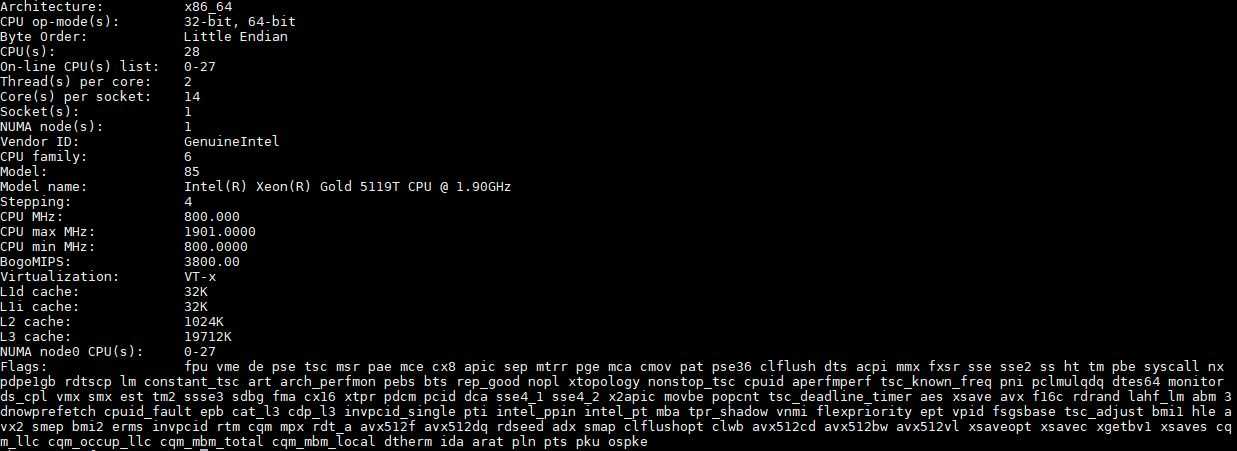
One may assume that with the ability to run at higher thermal envelopes, it may mean more headroom for turbo boost and therefore higher clocks. We have received this question many times at STH since the Intel Xeon Scalable family launch, and we are ready to share some data.
Intel Xeon Silver 4116 v. Intel Xeon Silver 4116T Performance Sample
To demonstrate the deltas, we took two pairs of chips that we had on hand, the Intel Xeon Silver 4116 and Xeon Silver 4116T. Each has 12 cores, 24 threads and the same 85W TDP. The Intel Xeon Silver 4116T list price is about 10% more and the Tcase is 91C on the T part and only 76C on the standard part.
Our benchmark runs take several days to complete and result in well over 10,000 performance data points. As we looked through the results, the answer was clear, the CPUs performed similarly. We have the test configurations below.
For this exercise, we are using our legacy Linux-Bench scripts which help us see cross-platform “least common denominator” results we have been using for years as well as several results from our updated Linux-Bench2 scripts. We are going to update the test results post Meltdown and Spectre patching so take these as relative performance numbers.
Python Linux 4.4.2 Kernel Compile Benchmark
This is one of the most requested benchmarks for STH over the past few years. The task was simple, we have a standard configuration file, the Linux 4.4.2 kernel from kernel.org, and make the standard auto-generated configuration utilizing every thread in the system. We are expressing results in terms of compiles per hour to make the results easier to read.
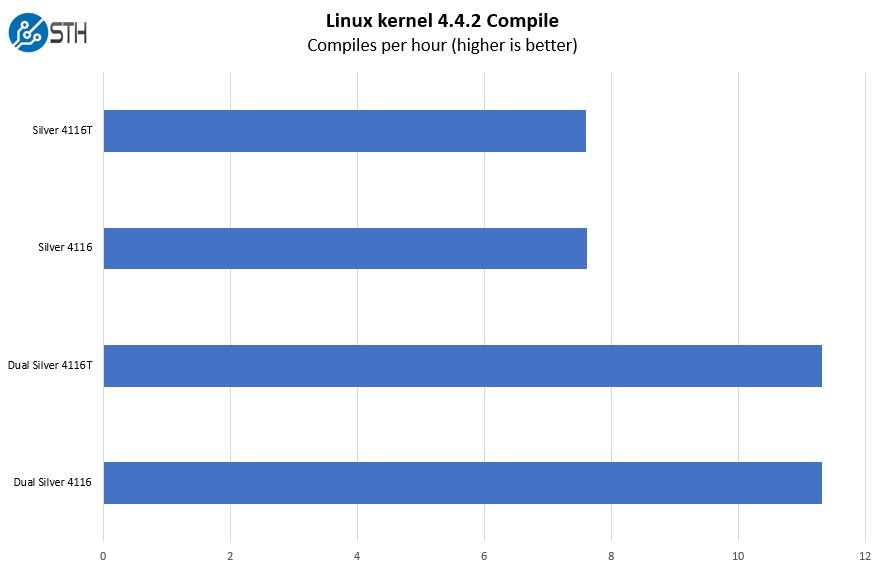
We are going to see a pattern. Note that there are small differences but they are going to be well within benchmark run variances.
c-ray 1.1 Performance
We have been using c-ray for our performance testing for years now. It is a ray tracing benchmark that is extremely popular to show differences in processors under multi-threaded workloads. We are going to use both our legacy 4K result along with our new Linux-Bench2 8K render to show differences.
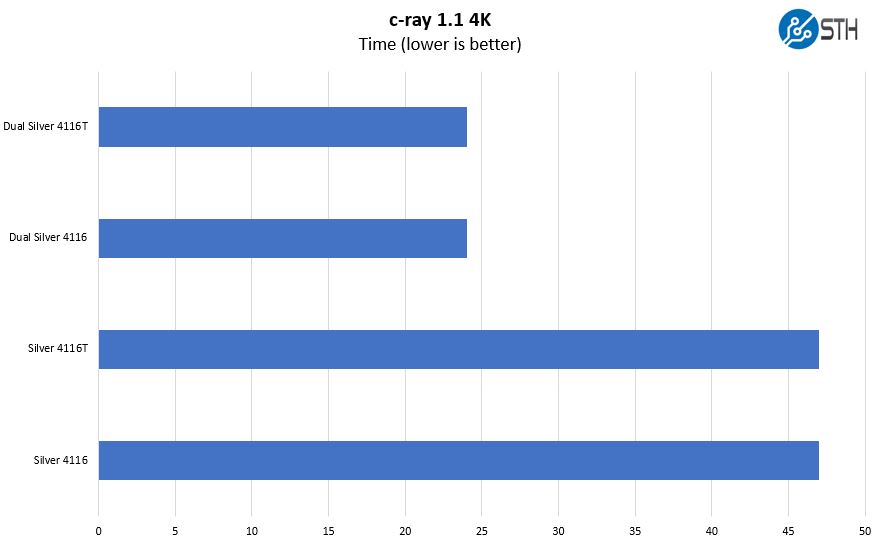
Here are the 8K results:
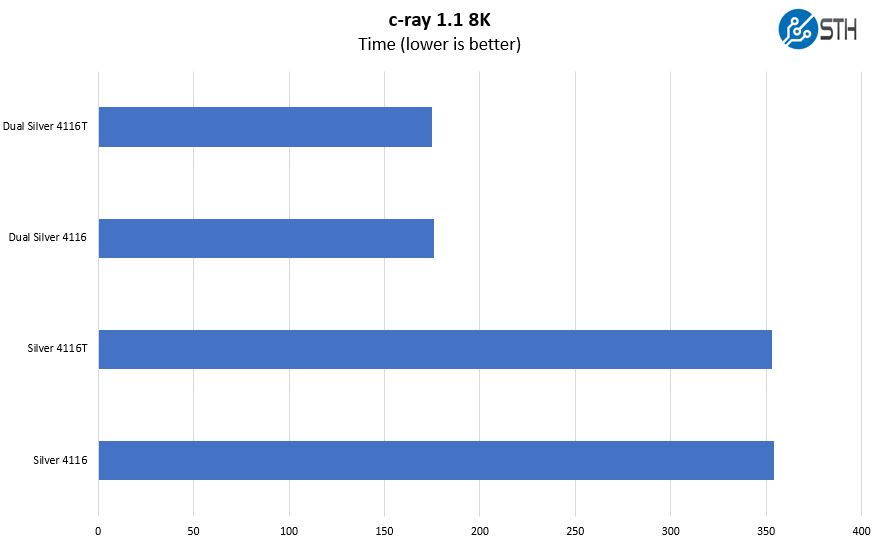
As you can see, the chips perform relatively similarly in single and dual socket configurations.
7-zip Compression Performance
7-zip is a widely used compression/ decompression program that works cross-platform. We started using the program during our early days with Windows testing. It is now part of Linux-Bench.
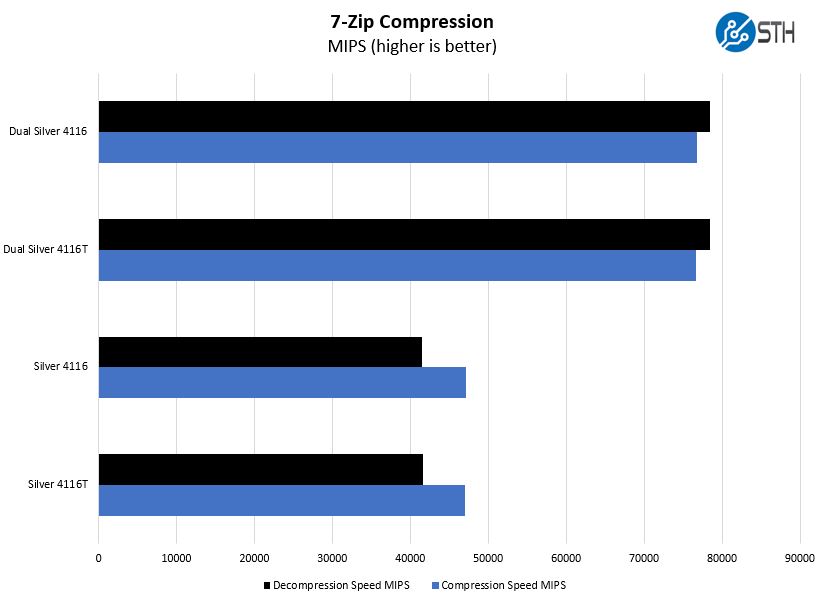
Compression is the same picture.
OpenSSL Performance
OpenSSL is widely used to secure communications between servers. This is an important protocol in many server stacks. We first look at our sign tests:
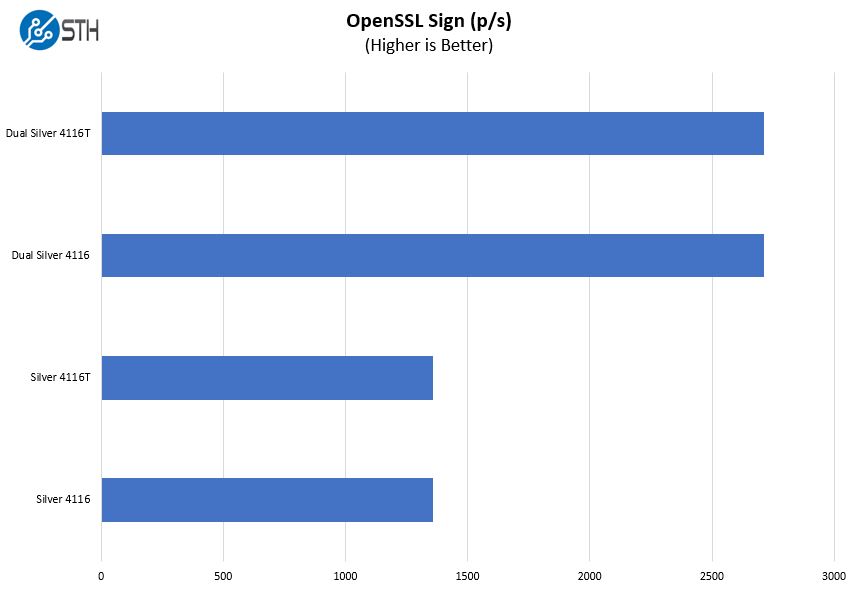
Here are the verify results:
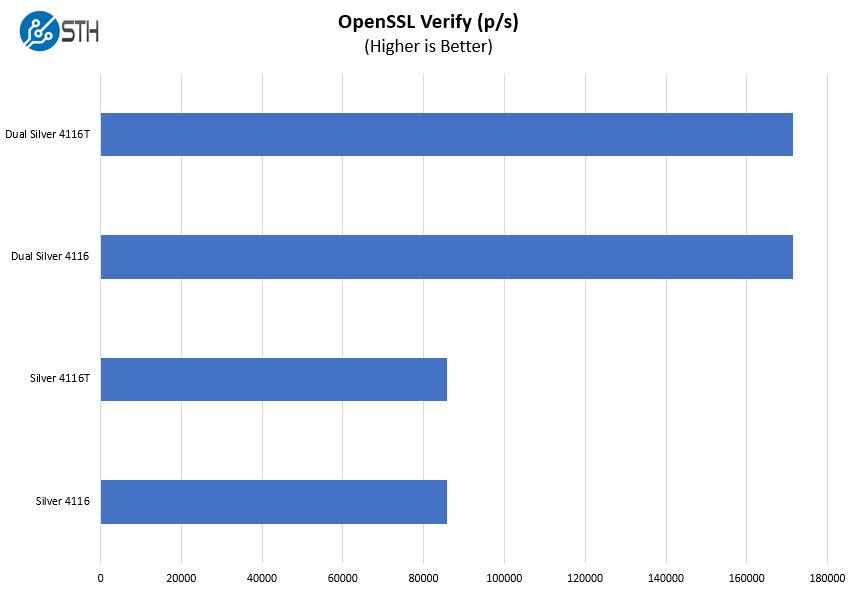
Again, they are close.
GROMACS STH Small AVX2/ AVX-512 Enabled
We have a small GROMACS molecule simulation we previewed in the first AMD EPYC 7601 Linux benchmarks piece. In Linux-Bench2 we are using a “small” test for single and dual socket capable machines. Our medium test is more appropriate for higher-end dual and quad socket machines. Our GROMACS test will use the AVX-512 and AVX2 extensions if available.
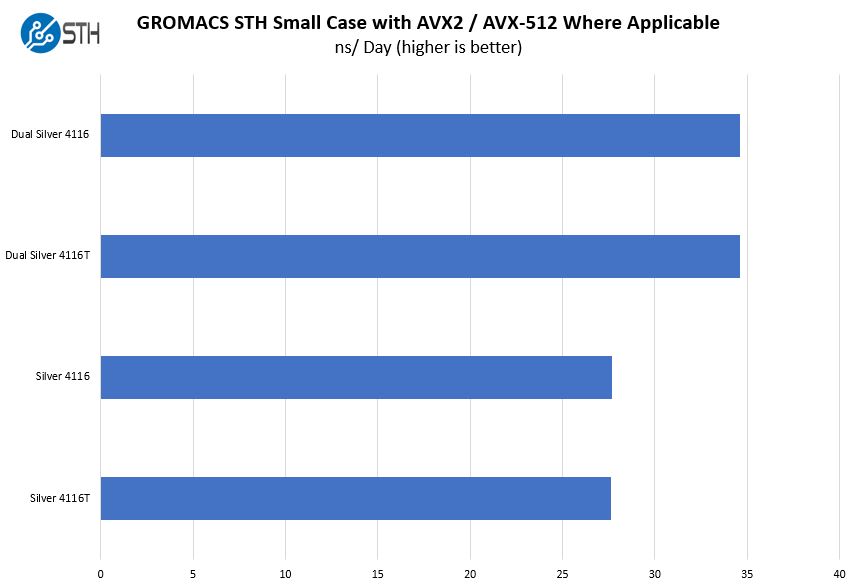
Moving to AVX-512 where we expect more power usage and perhaps may expect to see the T series parts perform better, it is again essentially a wash.
Chess Benchmarking
Chess is an interesting use case since it has almost unlimited complexity. Over the years, we have received a number of requests to bring back chess benchmarking. We have been profiling systems and are ready to start sharing results:
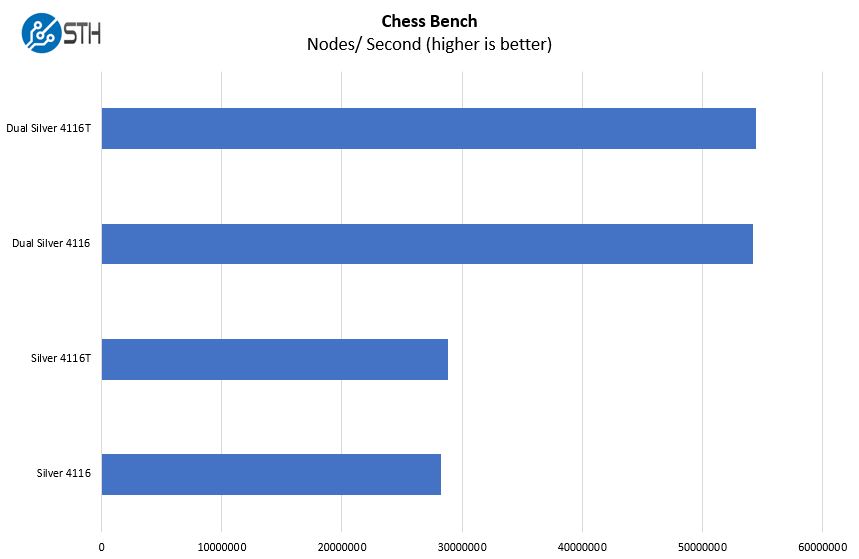
Here we see the chips close yet again. The point has been made.
A Note on Power Consumption
Instead of yet another graph with nearly identical bars, these chips performed essentially the same +/- 1W in our testing from idle to full load.
Final Words
This is one of the more anti-climatic pieces that you will read on a server hardware review site. We tested integer, floating point, storage, encryption, development and AVX-512 workloads as examples and the T series parts mirrored the performance of the standard parts. We get a number of questions such as “are T series parts as good as/ better than the standard ones?” The answer is that in a normal data center, they should perform about the same.
The value of the T parts is in Intel’s backing. Longer lifecycle and higher Tcase operational specs are important in many segments and worth a 10% premium. From a performance perspective, they are essentially the same.
Test Configurations
For our testing, we used a single socket and dual socket platform to test each pair of chips. Since we wanted a higher degree of precision, we used the same physical systems simply swapping CPUs so that all components would otherwise be the same.
2P System
- System: Dell PowerEdge R640
- CPUs: 2x Intel Xeon Silver 4116 and 4116T
- RAM: 12x 32GB DDR4-2666
- Intel DC P3710 400GB
1P System
- System: Supermicro SuperStorage SSG-5029P-E1CTR12L
- CPUs: Intel Xeon Silver 4116 and 4116T
- RAM: 12x 16GB DDR4-2666
- Intel DC P3710 400GB
OS used was Ubuntu 16.04.3 HWE.



Thank you for your hard work. I can really appreciate the tedious work that went into making this comparison so please, keep up the good work.
HI can you test the influence of Meltdown and Spectre updates to the performance of this systems?
We will do when the updates are completely rolled out.
Sometimes a negative result is as important as a positive. The theory is not unreasonable; if the chips in question were oveclockable, a difference might have been found. But realistically, this is about Intel product differentiation. Here, as you say, they are charging for guaranteed performance at high Tcase.
The only odd thing is that usually the way they achieve this is by lowering TDP and frequency, whereas here they seem to have just said (for +$100) “yeah, it’ll run fine at that heat”. Hopefully they tested that!
It would be interesting to see if these numbers can be tweaked by the motherboard. Most modern Intels have all sorts of power tables that are BIOS controlled for temperature and thermal limits in various boost scenarios.
In theory a motherboard designed for the T series could potentially bump the envelope on those, though you could probably test that partly by seeing if Intel recommend different tables for the different CPUs.
Otherwise I can only assume they are warranted to basically not die under these extreme loads.
What would be interesting is a comparison of 4108, 4109T and 4110. 4109T has lower TDP than both 4108 and 4110 and performance wise should be in the middle. It also costs the same as 4110