
At Intel Innovation 2022, QCT and Intel showed off their workload optimization work. This was not the flashiest demo, but then upon looking at our notes again, it made more sense. When we look toward next-generation platforms, as well as those deployed today, the impact of low optimization is enormous in terms of performance and power consumption.
QCT on Application Profiling at Intel Innovation 2022
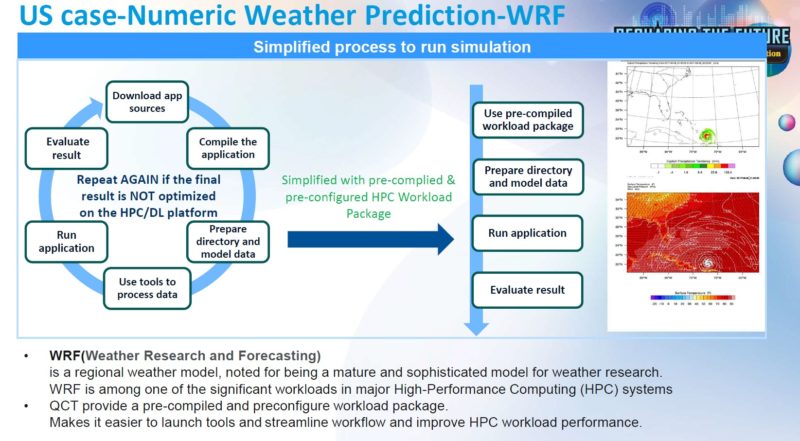
Here is QCT’s slide on profiling and tuning WRF. WRF, for those who are unaware, is a weather simulation tool. This is a well-known HPC workload that has clusters dedicated to running it. Something one can see is that the goal is optimization by running the software and seeing how it works.
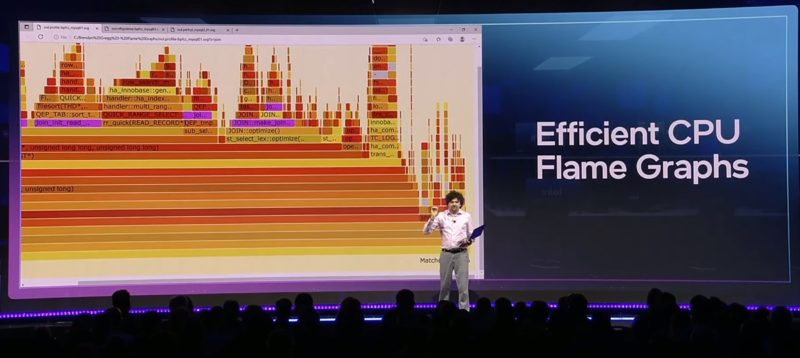
That brings us to the question, of how QCT is doing this with its customers. Something that we did not cover much of during Intel Innovation 2022, but that was an interesting talk, was Brendan Gregg’s (a former Netflix performance lead) talk. There, he showed CPU flame graphs as a way to see the execution time spent on different parts of the stack.
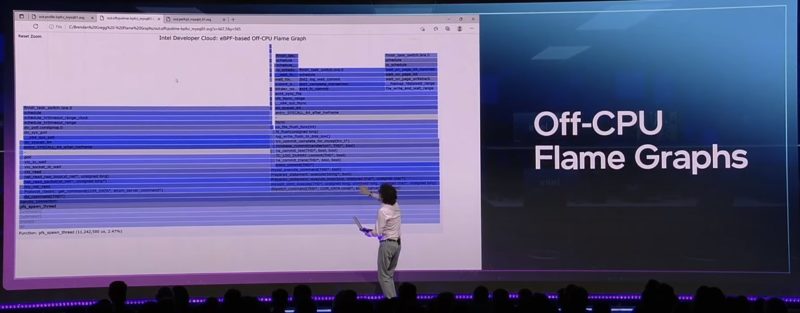
Intel has extended this to go beyond just on-CPU, but also to off-CPU flame graphs. HPC workloads often involve transferring data from one node to another, and thus there is pressure on a cluster’s performance from waiting for things like data movement.
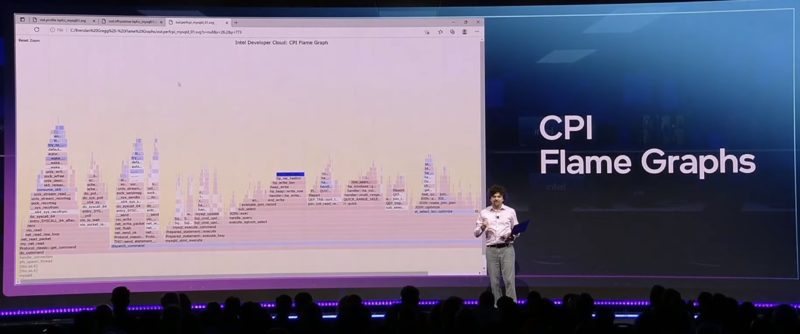
Intel also has CPI flame graphs. If you can see the dark blue bar below, this is a process that is waiting for IO.
Earlier this year, Intel acquired a company called Granulate for $650 million. We noticed that QCT is using Intel Granulate and gProfiler with its clients to track down those performance bottlenecks.
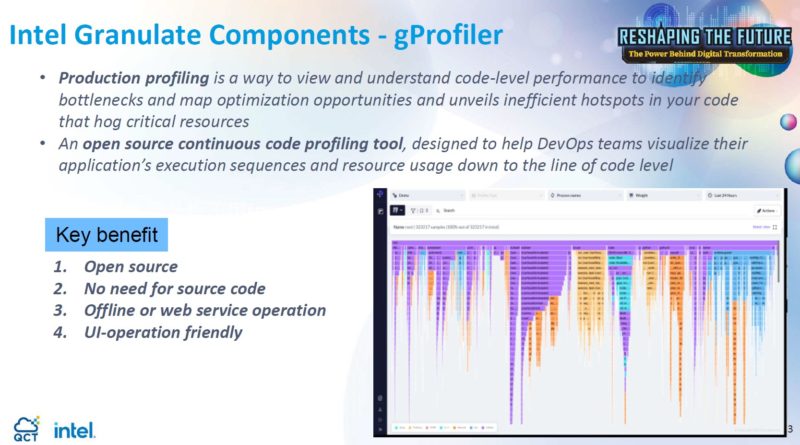
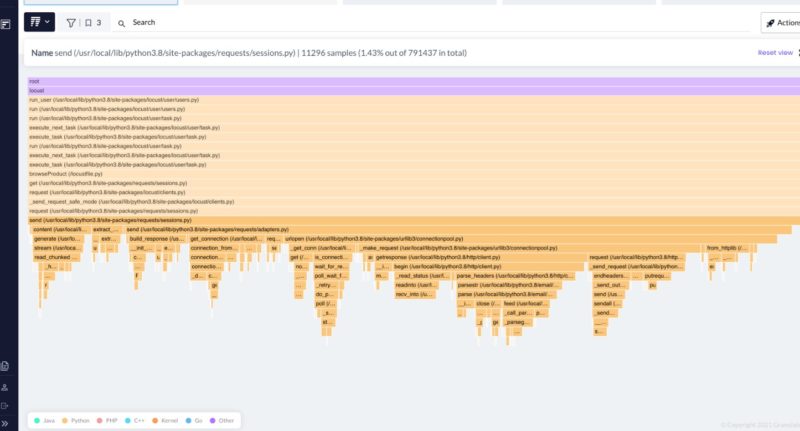
If you use gProfiler, you will see the extensive use of flame graphs.
These flame graphs then help feed two different paths of optimization. The first is code optimization, and that is what Intel’s talk at Innovation 2022 was focused on. From the QCT side, it works with customers to use this data to tune systems and clusters.
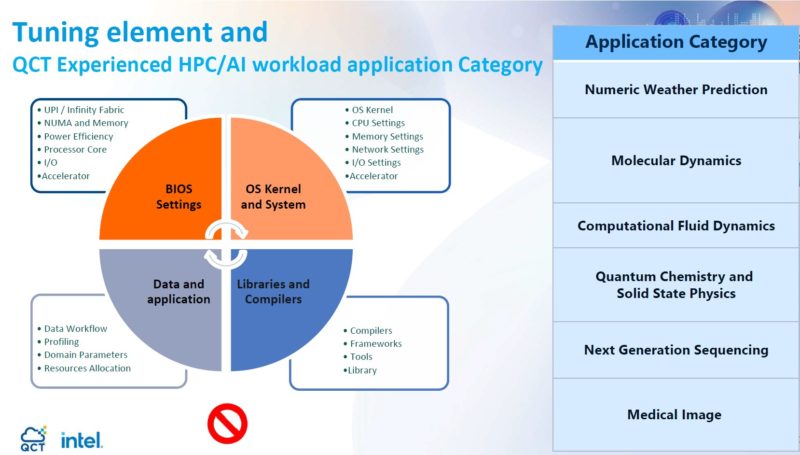
That can be everything from the libraries used but then all the way to the basic BIOS settings, kernel settings, and also cluster hardware.
Final Words
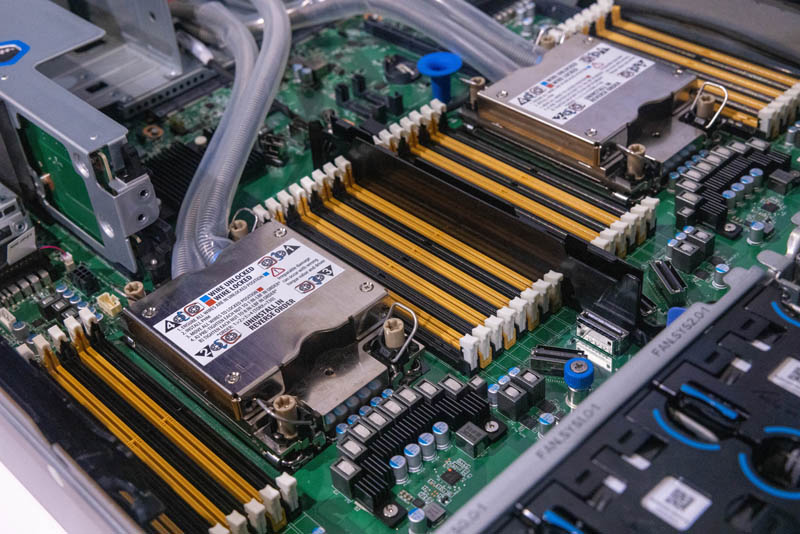
When we are at trade shows, seeing WRF simulation output is often easy to understand since it usually involves weather forecasts and a map. Hardware is also easy to observe since it is sitting in plain sight.
What we do not focus as much on, and perhaps we should, is tools like Intel’s Granulate gProfiler and efforts to apply them by companies like QCT. Large hyper-scale customers often have sophisticated tools that allow them to do this work. Now, smaller organizations are being given access to this software, and it seems like something QCT is now offering as a service.


Brendan Gregg’s two books, Systems Performance and BPF Performance Tools, are great reads. They would be a great subject for a Serve the Home book review piece.
Comments are closed.