PNY CS2130 1TB Performance Testing
We are moving towards using larger test sizes on our benchmarks, but on several tests, we also used the smaller default-test sizes. This allows us to see the difference between lighter and heavier workloads.
CrystalDiskMark 7.0.0 x64
CrystalDiskMark is used as a basic starting point for benchmarks as it is something commonly run by end-users as a sanity check.
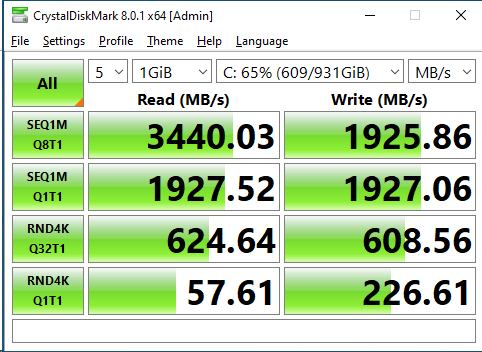
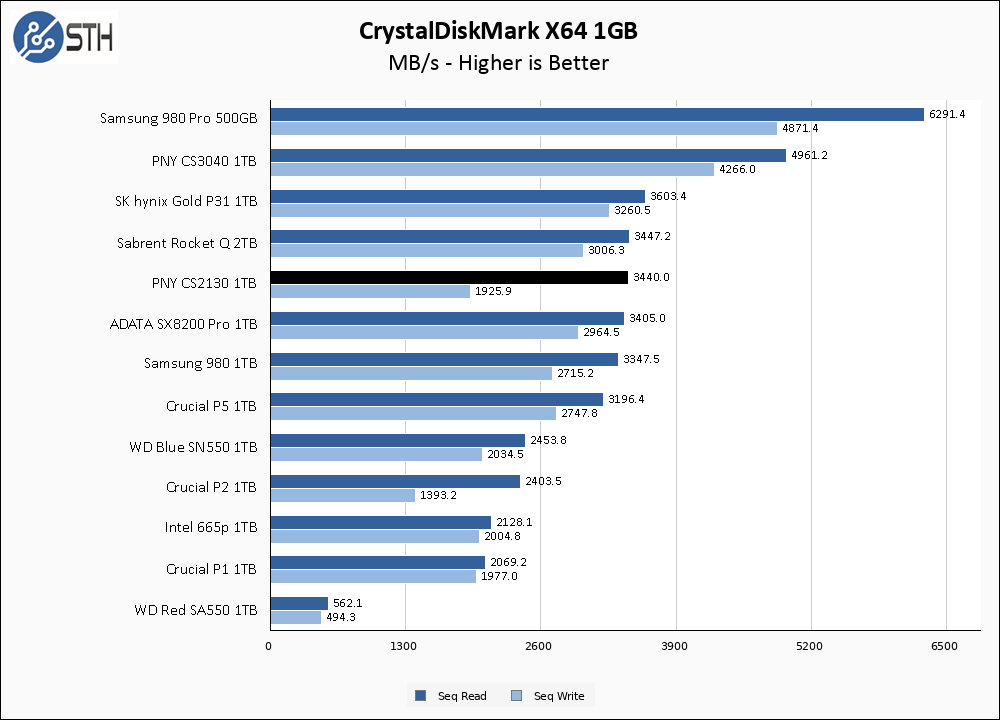
To start with, CrystalDiskMark looks pretty good for the PNY CS2130 1TB. Read performance is very close to the rated number, and write performance exceeds the 1800 MB/s specification by a little bit. In terms of relative performance on our graph, the CS2130 is looking pretty good, especially in the context of a read-heavy workload.
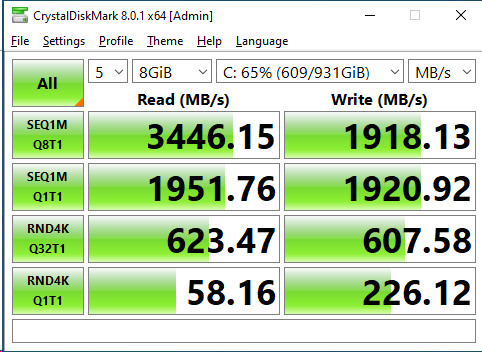
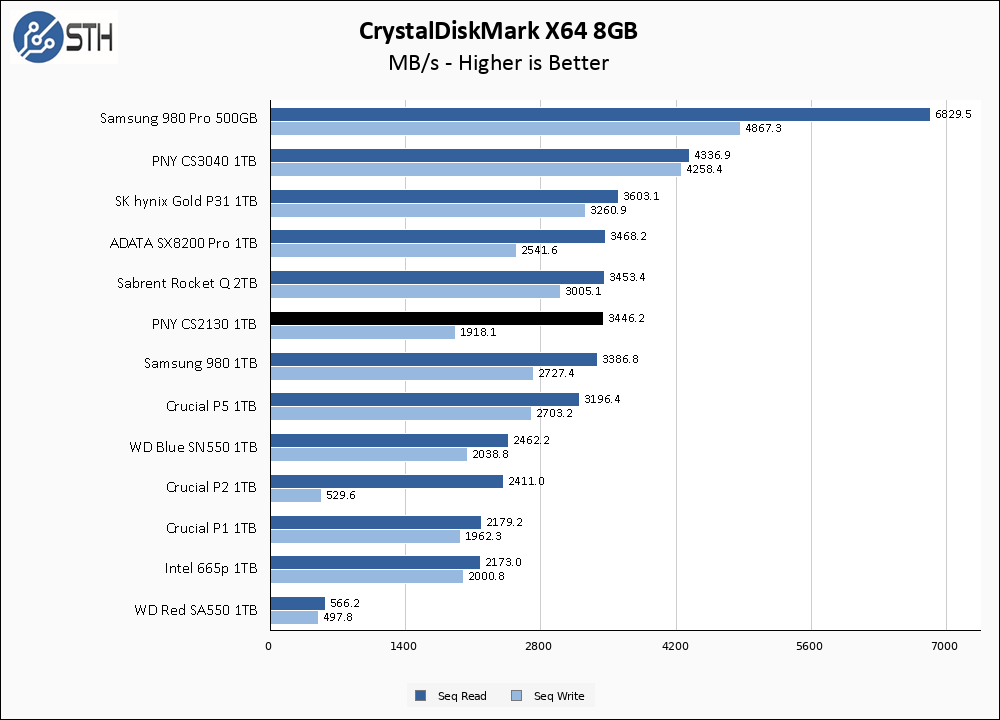
Moving to the larger CrystalDiskMark test has absolutely no effect on the PNY CS2130 1TB.
ATTO Disk Benchmark
The ATTO Disk Benchmark has been a staple of drive sequential performance testing for years. ATTO was tested at both 256MB and 8GB file sizes.
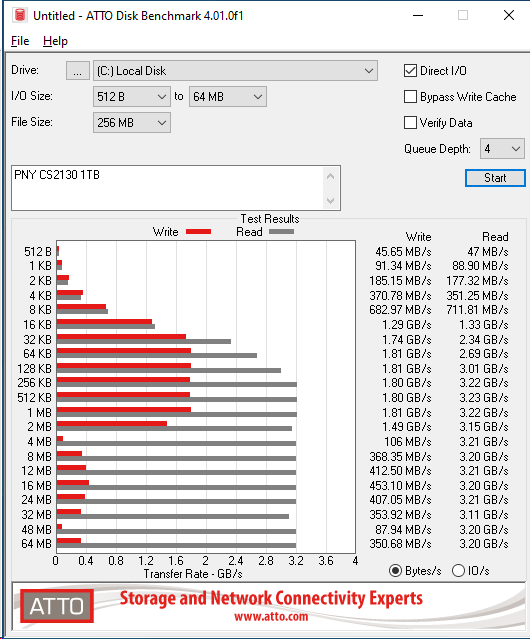
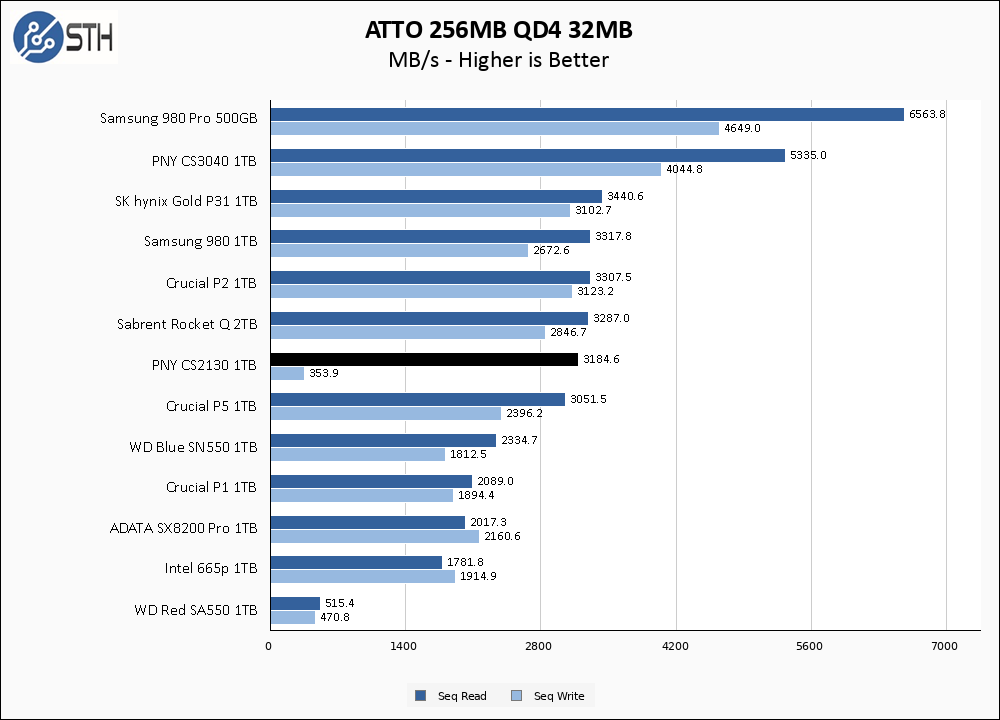
Unfortunately for PNY, ATTO tells an entirely different story than CrystalDiskMark. While read performance remains relatively good by maintaining performance above 3000 MB/s, the write performance is simply disastrous. We take our graph datapoint at the 32 MB mark in ATTO, but write performance is horrible for all the larger chunk sizes and dipping below 100 MB/s performance at the 48 MB chunk size.
Given the performance of this drive in the benchmark, the WD Red SA550 1TB has been added to the graphs to represent SATA drives, and in terms of write performance clearly beats out the CS2130.
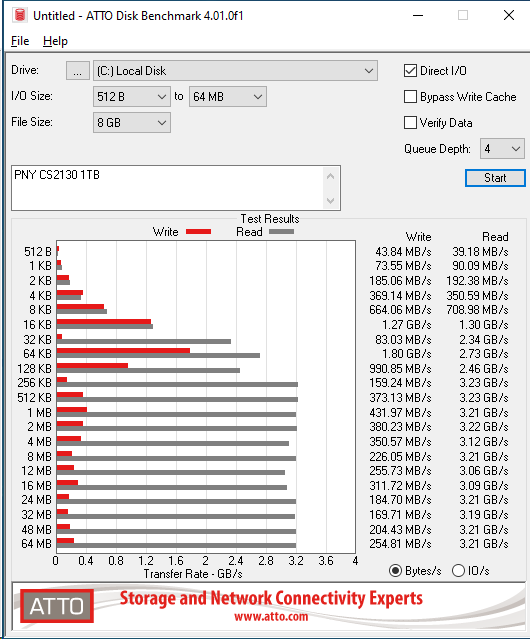
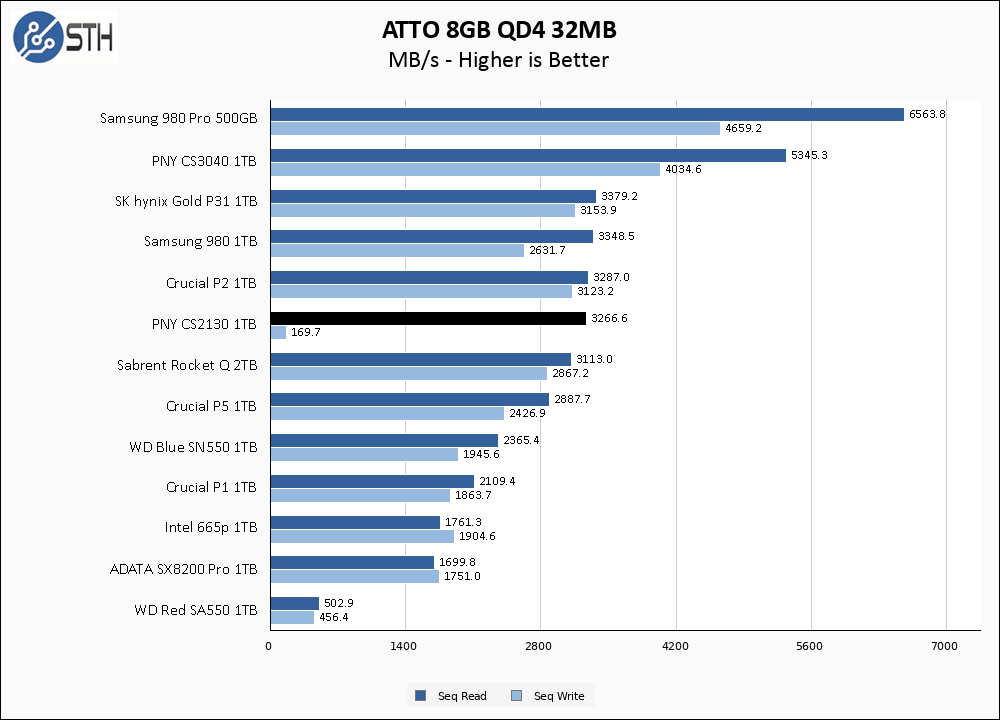
If you thought the last ATTO benchmark was bad, the larger 8GB test is just a train wreck. Write performance is highly variable, yet somehow consistently bad throughout the test. Read performance is still good, but that is small comfort given the severity of the write performance problem.
Anvil’s Storage Utilities
Anvil’s Storage Utilities is a comprehensive benchmark that gives us a very in-depth look at the performance of drives tested. This benchmark was run with both a 1GB and 8GB test size.

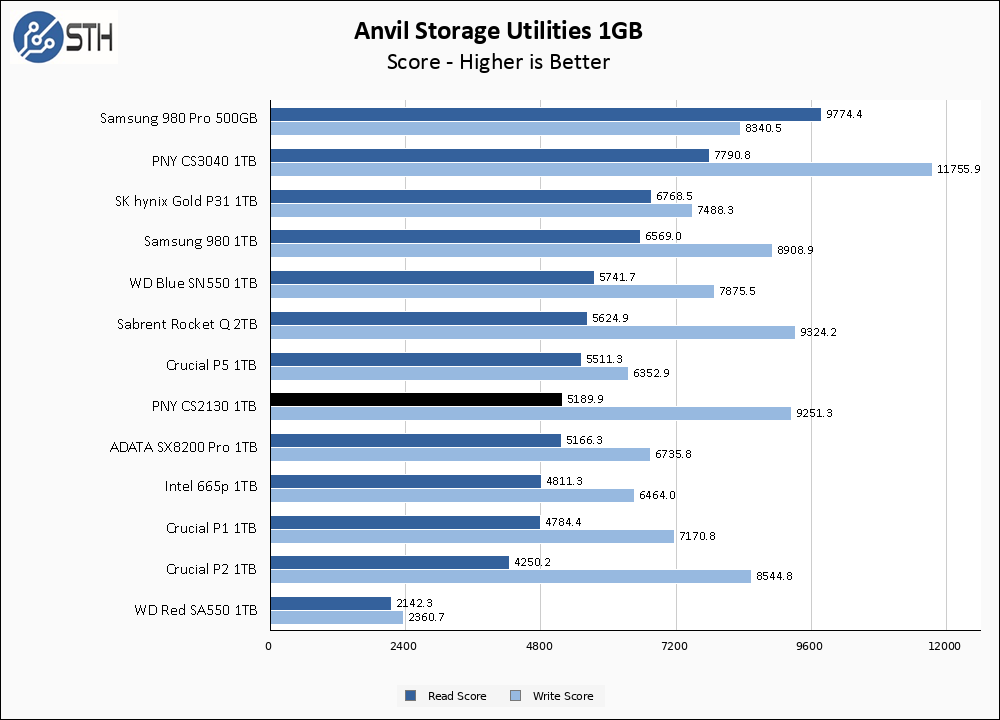
Phison controllers and Anvil have always gotten along swimmingly, and despite the ATTO results the PNY CS2130 1TB continues that trend. Read performance is pretty middling as far as PCIe 3.0 SSDs go, losing out the likes of the WD Blue SN550 1TB and the Crucial P5 1TB, but write performance is strong as per normal with any Phison equipped drive.
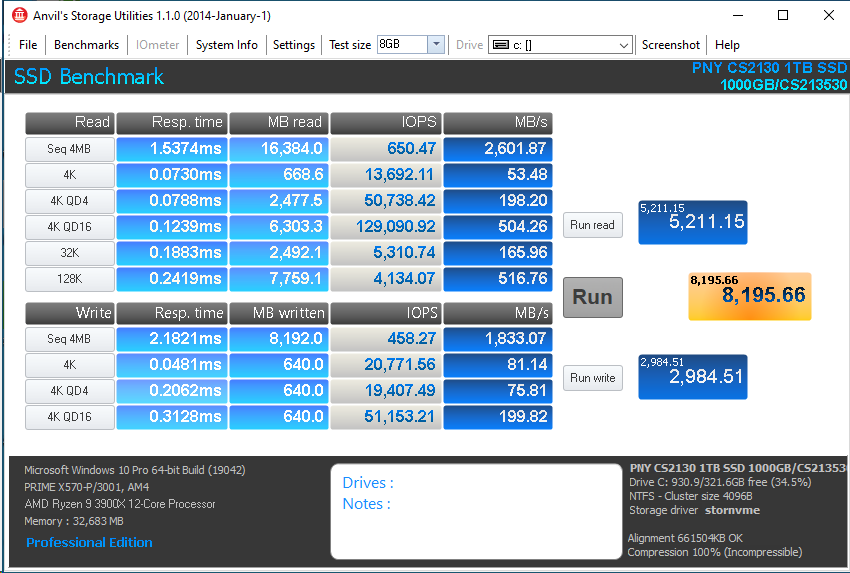
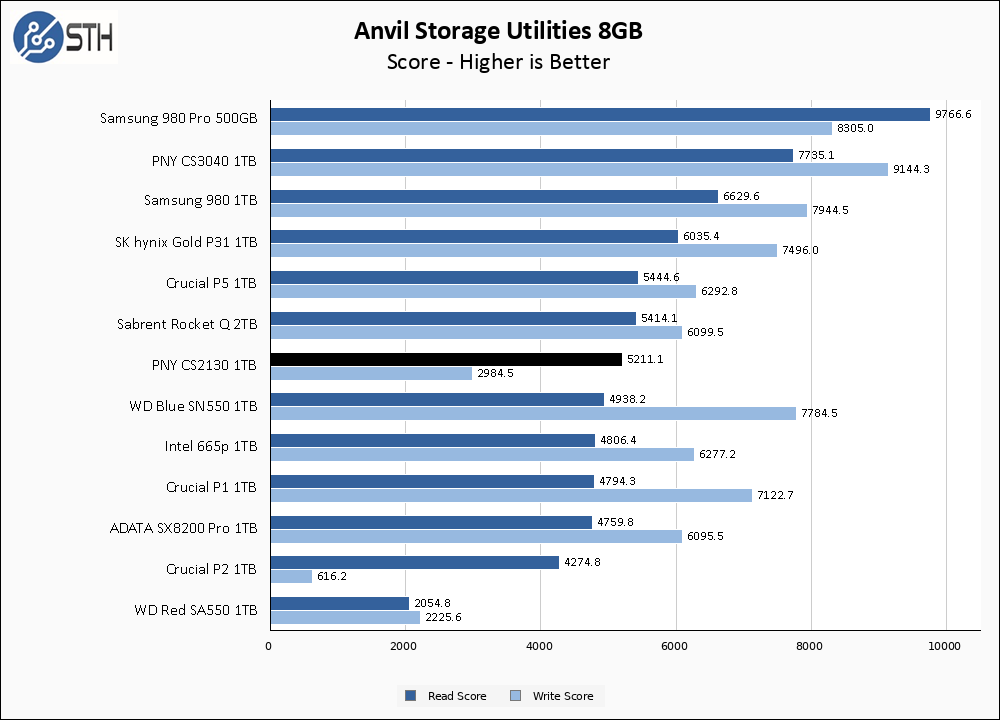
Despite the ability for Phison drives to do well in Anvil write performance, the PNY CS2130 1TB suffers a very significant drop when moving to the larger test set. The drive still comfortably stays out of SATA territory, but the CS2130 is now nearly at the bottom of our chart in terms of write performance, only beating out the Crucial P2 and the SATA drive.
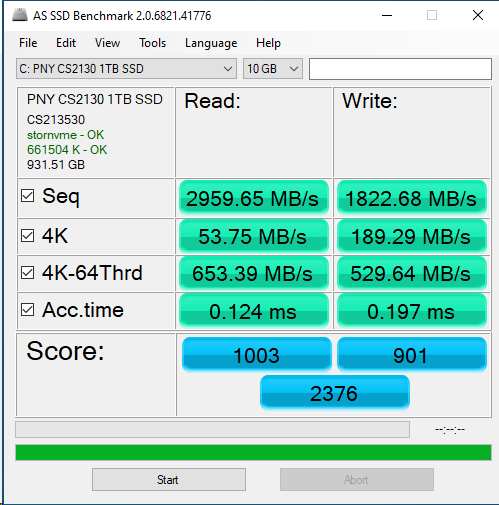
AS SSD Benchmark
AS SSD Benchmark is another good benchmark for testing SSDs. We run all three tests for our series. Like other utilities, it was run with both the default 1GB as well as a larger 10GB test set.
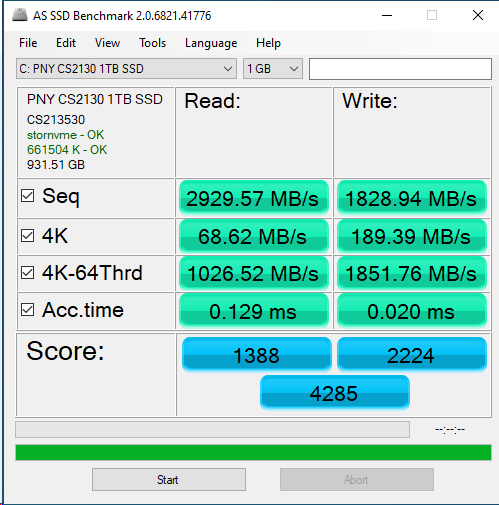
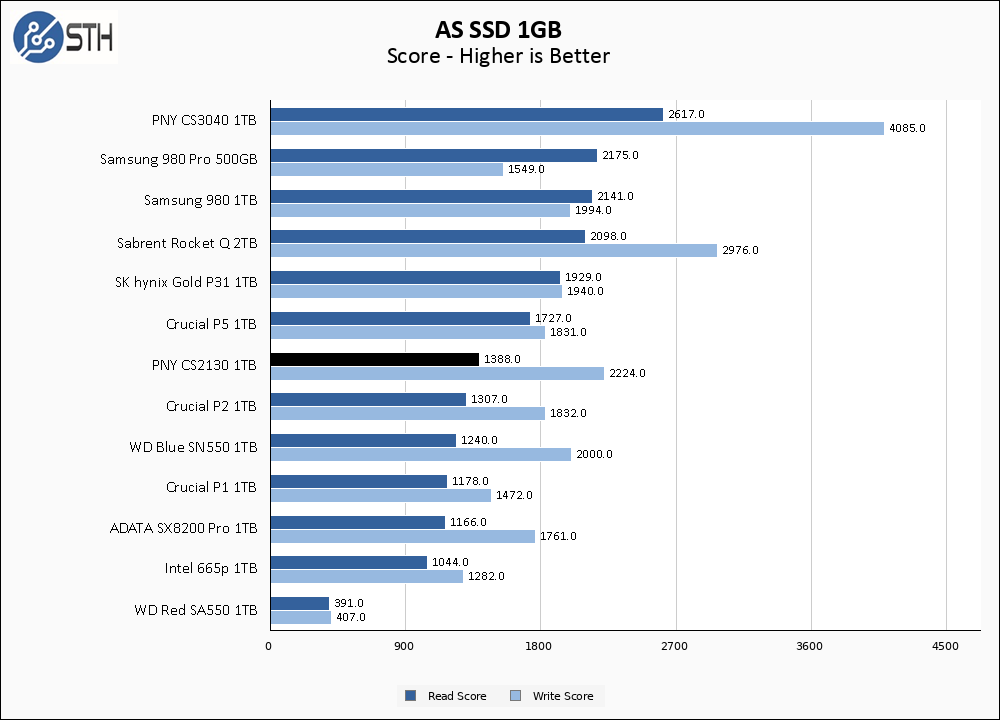
In AS SSD, the PNY CS2130 1TB holds the position in the middle of the pack, narrowly edging out drives like the Crucial P2 and the WD Blue while losing out to higher performance drives like the SK hynix Gold P31 1TB.
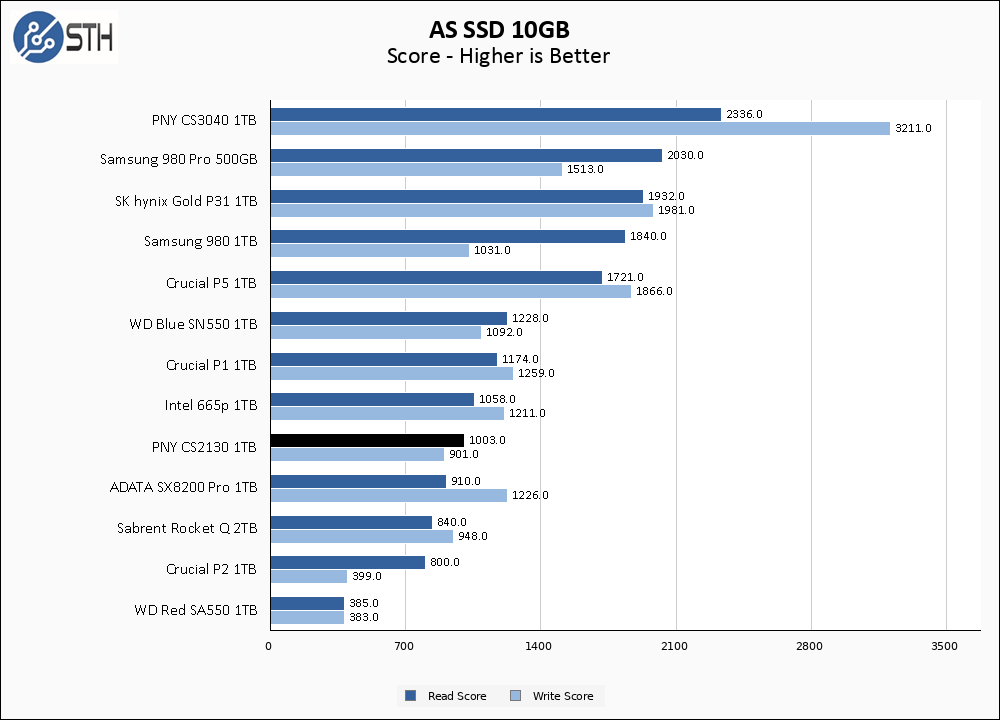
As with most of the rest of our tests, the larger AS SSD test hurts the PNY CS2130’s relative positioning on our graph. The drive no longer beats the WD Blue SN550, and only narrowly avoids the very bottom of our chart.
SPECworkstation, direct comparisons, thermals, and our conclusion are up next.


Hey Will, thanks for listening to my feedback and testing the post-pseudo-SLC-cache performance! The results of this (and other QLC drives) compared to the synthetic, low-volume benchmarks show why this is so important. Just abysmal compared even to low-tier TLC-NAND. Not to say it does not apply to most TLC NAND SSDs too, as they nearly all rely on pseudo-SLC cache now.
Cheers!
“SPECworstation benchmark”? I assume this drive is best for “worstations”.
We live in good times, for examples of bad components to be this rare.
The suspicious elements of my mind wonder if the occasional dud isn’t a sucker punch intended for grabbing the fattest margin possible from complacency?
well, to be fair to it, 100MB/s write post-cache is still way better than samsung 860 qvo which is 70-80mb/s. yet, the random write speeds are just unacceptable. if it wasn’t for that part, it would have been a good deal.
Thanks for the review.. was looking at the 2TB version due to its low price, for secondary/game storage that wouldn’t require too much write .. but dam these numbers are so bad i’ll be skipping that.
I’s simply effect of buffered writes. Between tests there is no time to flush buffers and then performance drops.
I have this 1TB drive in my PC as the system drive. Normally would not buy anything like this but because of the current GPU situation I had to buy a pre-built PC and this was in it. For general use it’s good, but when I am downloading a 50+ GB game on Steam via my 1Gbps internet connection, the drive just turns to poop. Constantly at 99% load, write speeds around the 100MB/s mark and the whole system gets unusable as Windows is not even able to load apps off of that drive. Currently considering upgrading the drive to a 970 EVO.
I found the TBW (Terrabytes written) warranty statement in an addendum to PNY’s SSD warranty PDF. The TBW warranty limits for the CS2130 are (drive capacity, warranty TBW): 500GB 110, 1TB 225, 2TB 450, 4TB 900, 8TB 1,810.
These numbers are in the “middling” TBW warranty numbers I’ve seen.
It’s too bad there hasn’t been a firmware update for these drives that fixes the abysmal write issues…. I know this because I checked using PNY’s “PCIe SSD Toolbox 2.0”.
I wish I had seen this review before I had bought the drive. Since I use it as my OS and program drive, and keep my downloads, documents, and media on an HGST 7200RPM datacenter drive and on my NAS, it still seems pretty zippy due to it’s decent read speeds.
I also keep the Windows pagefile on the HGST, as I don’t want to be doing constant writes to the Nvme SSD due to Window’s paging. By running my workstation with 64GB of Ram, the paging is kept to a minimum anyway….
Comments are closed.