PNY CS1030 1TB Performance Testing
We are moving towards using larger test sizes on our benchmarks, but on several tests, we also used the smaller default-test sizes. This allows us to see the difference between lighter and heavier workloads.
CrystalDiskMark 7.0.0 x64
CrystalDiskMark is used as a basic starting point for benchmarks as it is something commonly run by end-users as a sanity check.
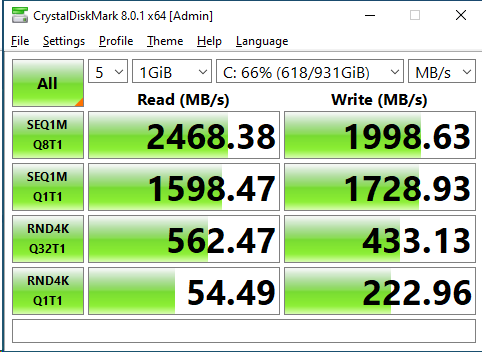
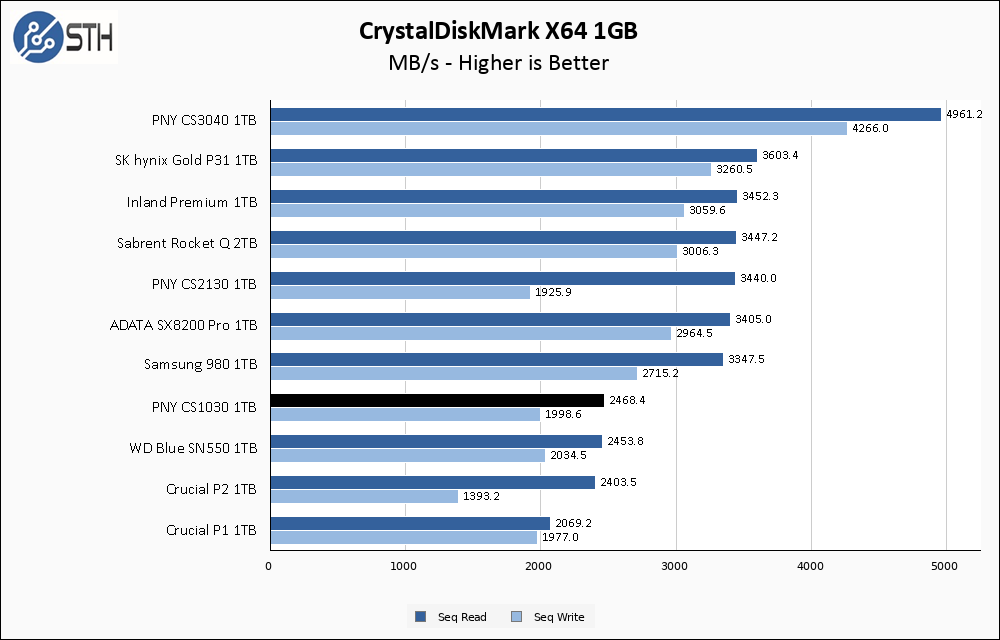
Given the relatively low performance specifications, CrystalDiskMark looks pretty good for the PNY CS1030 1TB. Both read and write performance greatly exceed the rated levels for the CS1030. Relative to the other drives on our graph the outlook is not quite as rosy, but the WD SN550 1TB is not bad company to keep.
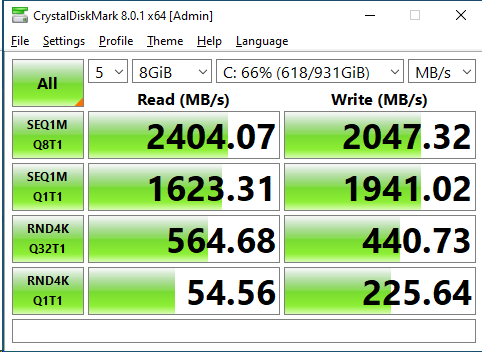
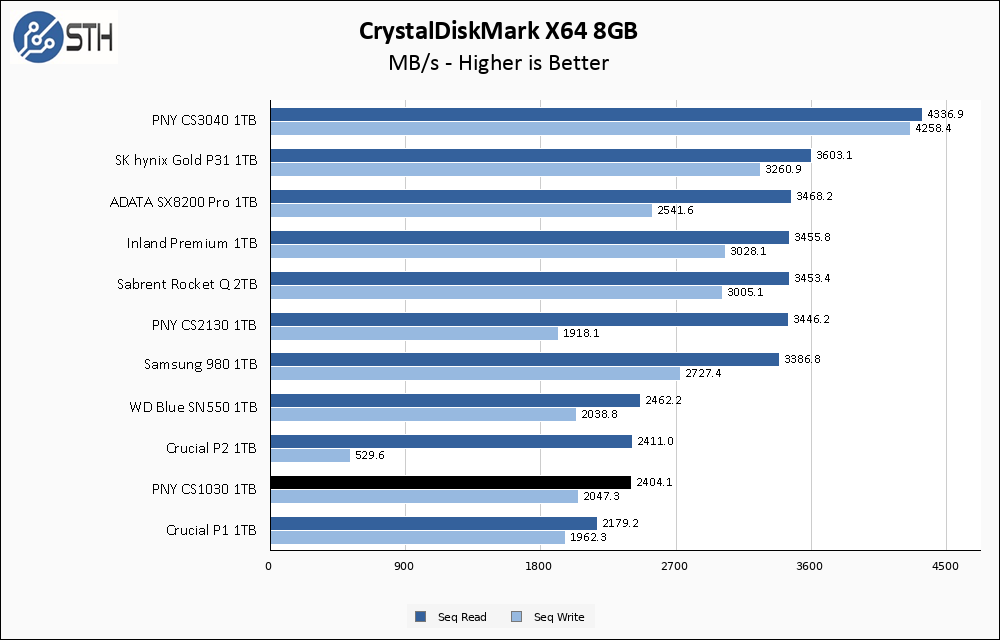
Moving to the larger CrystalDiskMark test has no effect on the PNY CS1030 1TB. Relative placing in our chart moves around a bit, but the sequential read performance of the CS1030, the WD SN550, and the Crucial P2 all remain essentially tied.
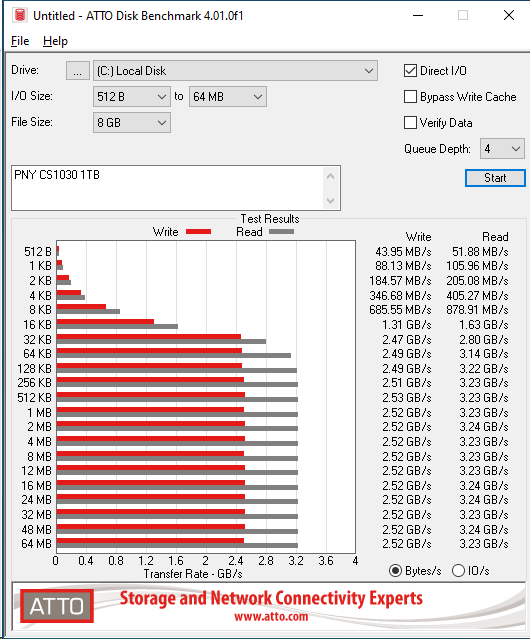
ATTO Disk Benchmark
The ATTO Disk Benchmark has been a staple of drive sequential performance testing for years. ATTO was tested at both 256MB and 8GB file sizes.

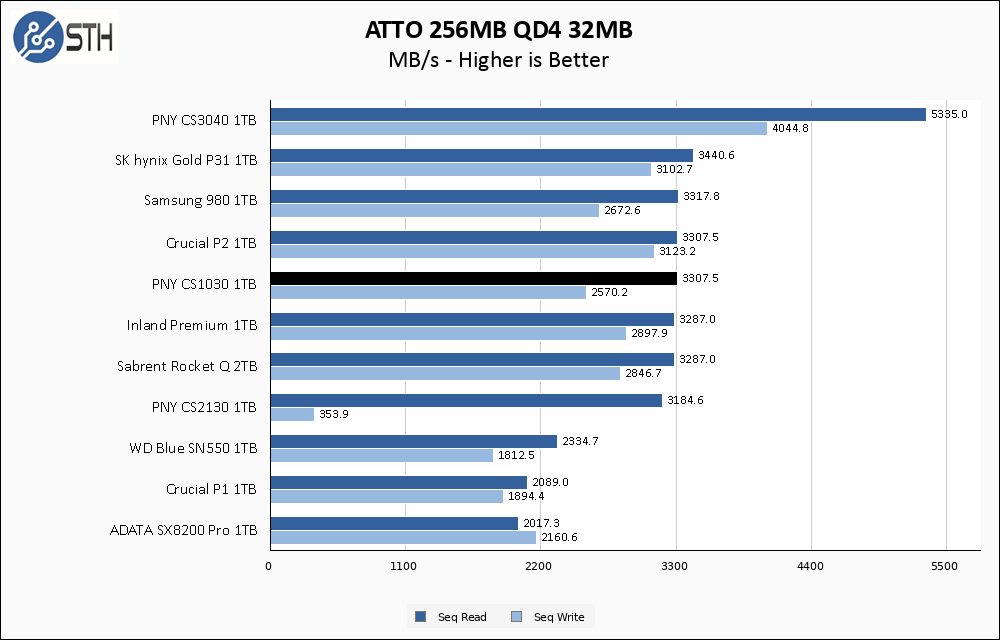
In ATTO, the PNY CS1030 continues its trend of significantly outperforming its own rated specs. Read performance comes in at 3300 MB/s, which blows away the rated 2100 MB/s. More importantly, the write performance for the CS1030 is both excellent as well as consistent. As you may remember, the PNY CS2130 performed particularly poorly in this benchmark and so it is a nice surprise to see the CS1030 turn in such a good result.
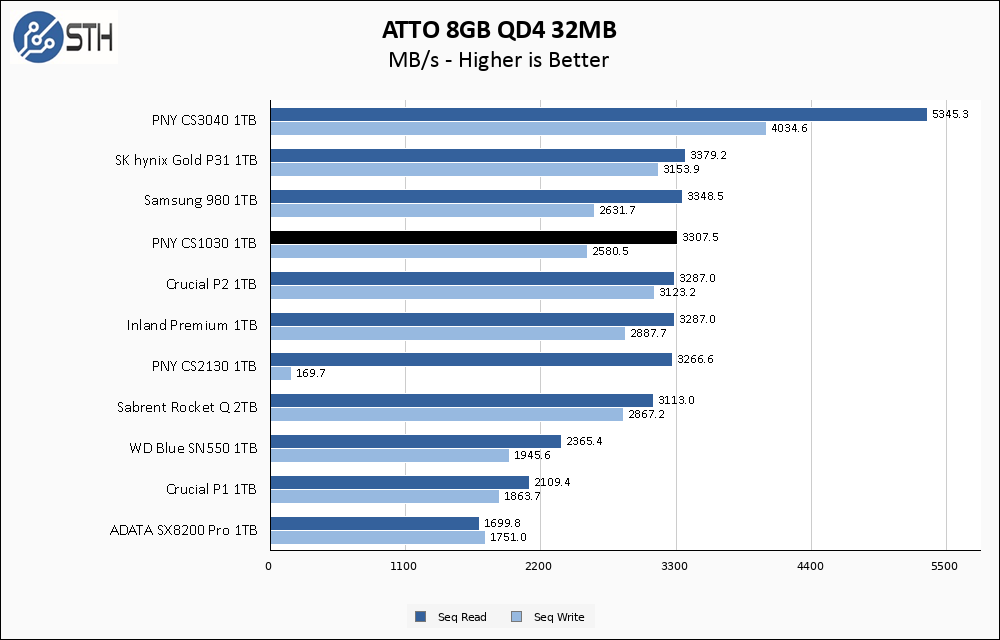
The larger ATTO test continues the good news for the PNY CS1030 1TB. Unexpectedly this drive turns in a result that is competitive with drives that have much higher performance targets.
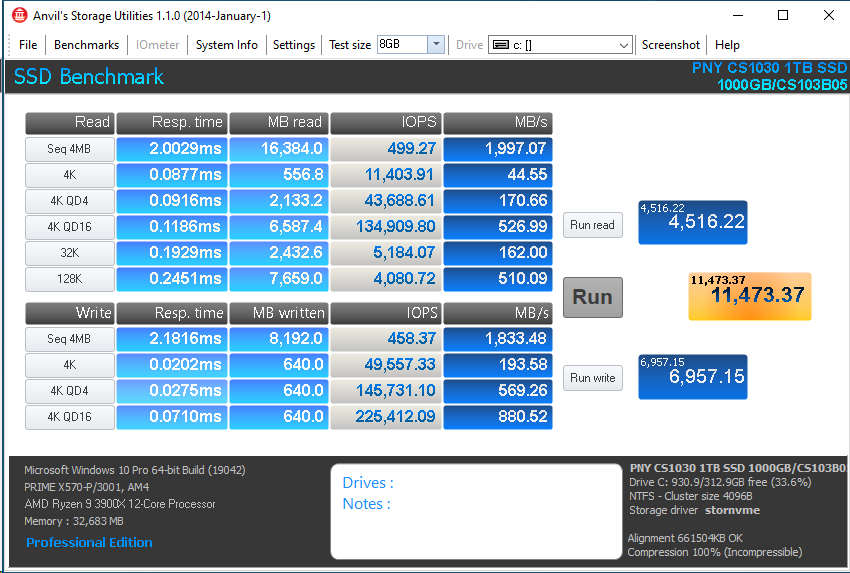
Anvil’s Storage Utilities
Anvil’s Storage Utilities is a comprehensive benchmark that gives us a very in-depth look at the performance of drives tested. This benchmark was run with both a 1GB and 8GB test size.

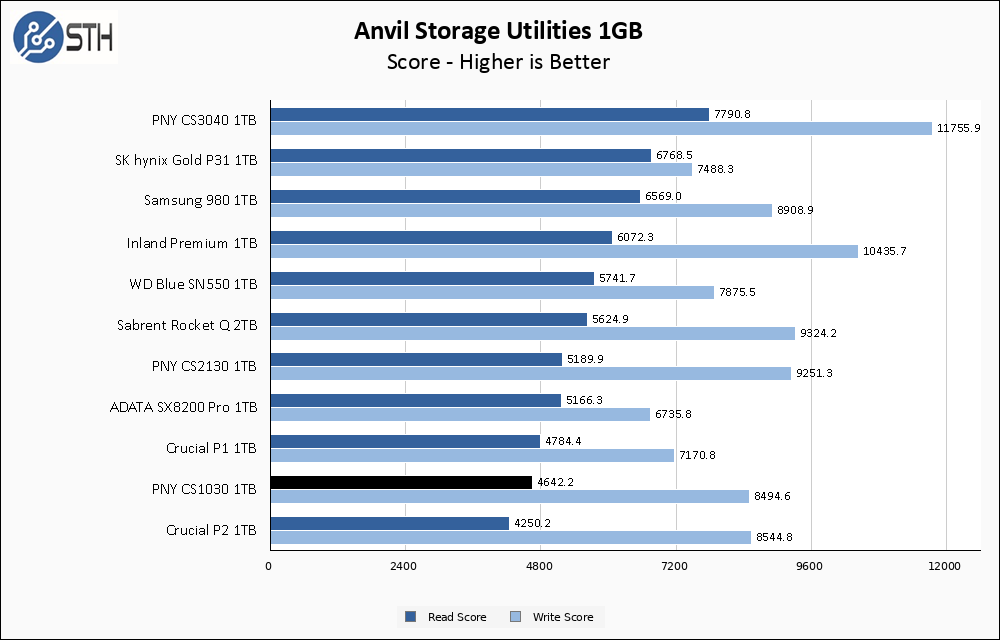
Alas, the good luck could not last forever. In Anvil’s read tests, the PNY CS1030 1TB turns in a low, but serviceable result. Nothing about these results is particularly abnormal. This drive has modest performance ratings and as a result trends towards the bottom of our chart. Since the CS1030 is based on a Phison controller, the write score continues to overperform.
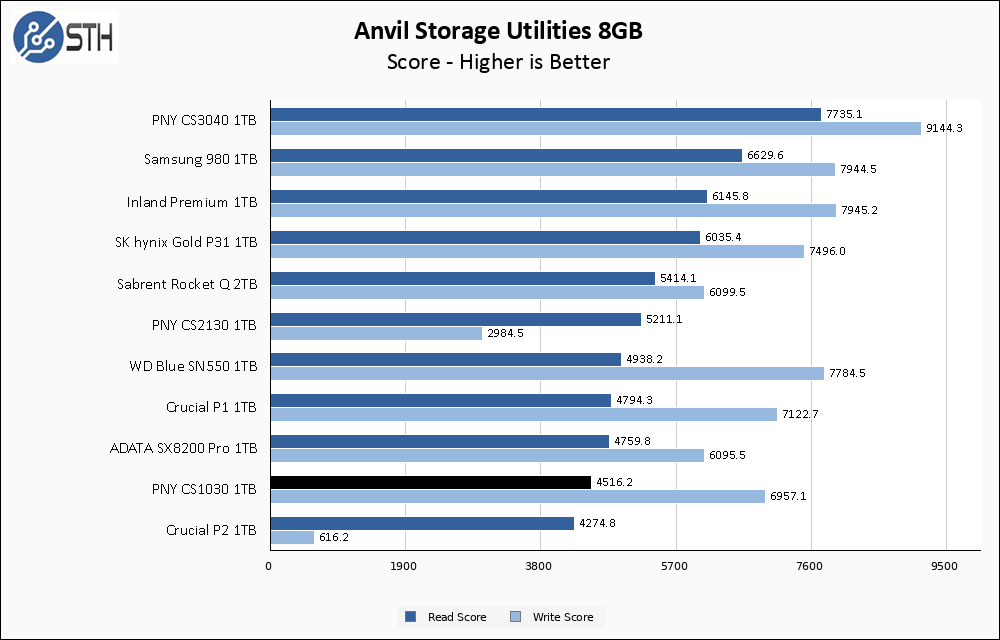
On the larger Anvil test, performance dips a little bit overall but not in any way that is concerning. The same could not be said for the CS2130, whose write performance cratered in this benchmark.
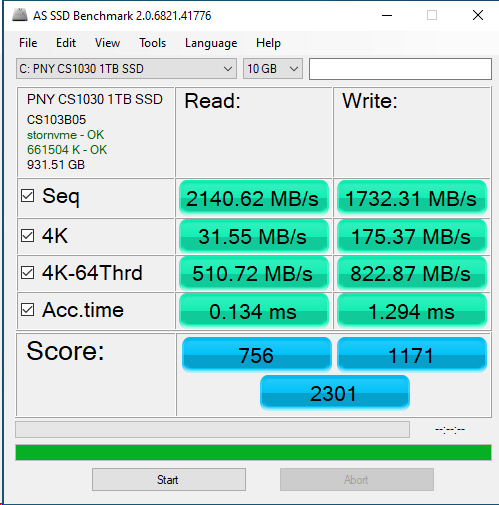
AS SSD Benchmark
AS SSD Benchmark is another good benchmark for testing SSDs. We run all three tests for our series. Like other utilities, it was run with both the default 1GB as well as a larger 10GB test set.
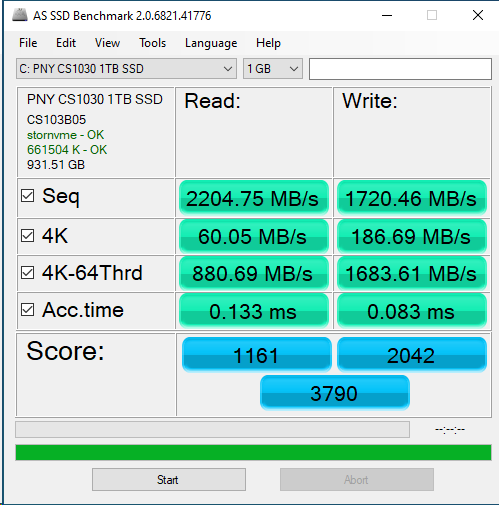
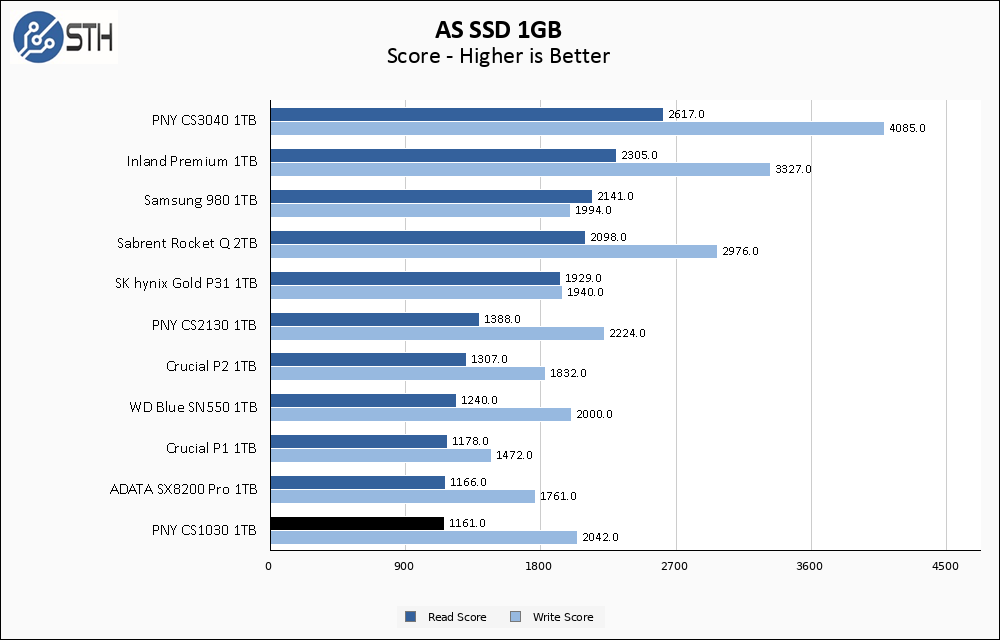
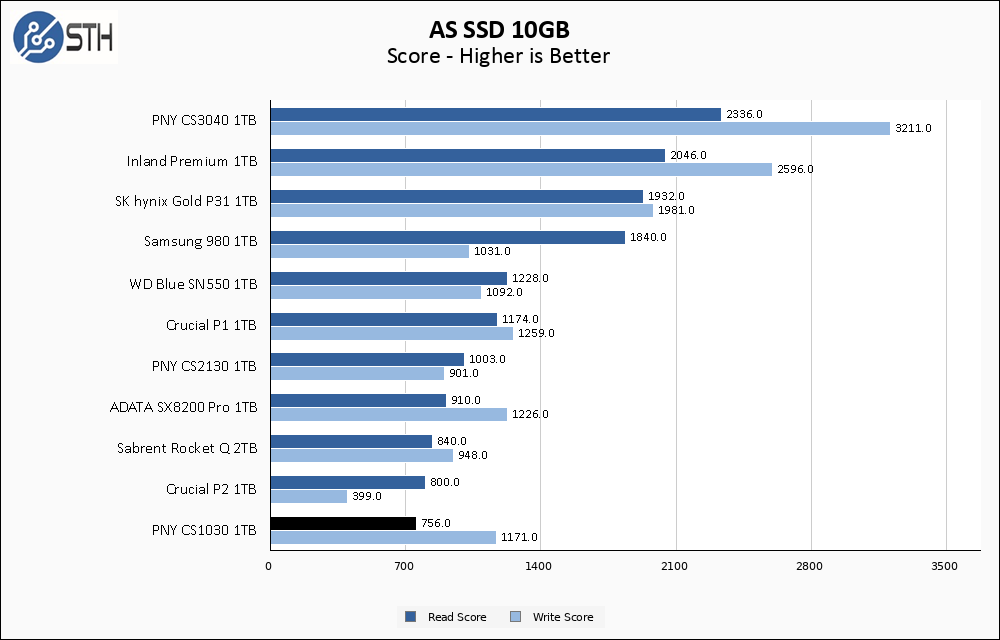
In AS SSD, read performance on the PNY CS1030 1TB is in a three-way tie for the bottom of our chart. Write performance is still holding up very well though, turning in a write score that is competing with some of the better PCIe 3.0 SSDs on our chart.
The CS1030 once again loses a small step when moving to the larger AS SSD test, but write performance falls less than on some other drives we have tested. The results here are a bit low, but not alarmingly so.
SPECworkstation, direct comparisons, thermals, and our conclusion are up next.


I’m honestly kind of amazed.
Not that SSDs vary widely and vendors can be pretty cagey about specs; but that PNY somehow ended up building or badging two of their products in basically the wrong order.
If they had called this one “CS2130” and the other once “CS1030”, with prices swapped accordingly, everything would have been more or less fine. But no.
Just a rebadging accident? Shocking indifference to benchmark results that they shouldn’t have much difficulty generating? Some sort of messy product lifecycle alignment that kept them from releasing the product they really wanted for the CS2130 slot but let them do something nice for the CS1030 slot?
How does it warrant a 8.5/10 with unknown/undisclosed endurance?
Todd,
Because PNY is still standing behind their 5 year warranty. In theory a 5 year warranty with no endurance enforcement is actually better for consumers than one that has an endurance clause on it.
I still want to know the endurance rating because that helps me understand the intensity of use a drive is designed to endure, as well as can help provide some idea of an ‘expected lifetime’ for a drive outside of the scope of the warranty. But from PNY’s perspective, they’re selling you a drive they guarantee will last 5 years, and there’s no reason to expect otherwise just because they do not provide an endurance rating.
Good for Chia then.
“PNY somehow ended up building or badging two of their products in basically the wrong order.”
Given that PNY are deliberately opaque both to the specifications of these devices, and to their endurance guarantees, I think it’s reasonable to ask whether either of these are actually fixed, or instead whether they depend on whatever components PNY use this week. So whilst in this round of testing the cheaper device out-performed its supposed better, who’s to say that a different pair of devices purchased in a month’s time won’t see the performance figures (and the use of TLC vs QLC) reversed ?
Without more confidence than PNY have provided that that’s not the case, I’d consider both PNY devices as a hard avoid
The endurance rating on CS1030 2TB is apparently 480 TBW. I would assume that the 1TB rating is half that (240 TBW) assuming they use the same NAND. This information comes from a manufacturer answered question on Amazon.
The endurance specs are listed on the PNY warranties page:
https://www.pny.com/company/support/solid-state-drives
https://www.pny.com/file%20library/company/support/product%20brochures/solid%20state%20drives/solid-state-drive-warranty_v5.21.2021.pdf
250GB 150TBW
500GB 110TBW
1TB 240TBW
2TB 480TBW
Yes, the 500GB has a lower absolute endurance rating than the 250GB. And yes, these are rather pitiful.
Unfortunately I think you may have missed something major. If you fill the drive, with a continuous write you will start out at 1.7GB/s … which almost immediately drops to 430MB/s … but after ~500GB (on an empty 2TB drive) you will quickly drop to 75MB/s. At least this is what I saw on my testing, and what I have seen others report too. I suspect this is a QLC drive — one would think that PNY certainly would advertise if it was TLC! The 2TB drive is currently selling for a bargain basement $200 AUD, which is a paltry $145 USD. I would suggest doing more extended continuous write testing.
I used Disk Tools by Tahionic.com to do my write filling, and DiskMark by NetworkDLS for other continous write testing.
I pulled the label off my CS1030 drive. It has QLC flash. ??? Come on PNY….
How can you review an SSD without mentioning TBW? This guy always misses the obvious.
Comments are closed.