Lexar NM620 1TB Performance Testing
We are moving towards using larger test sizes on our benchmarks, but on several tests, we also used the smaller default-test sizes. This allows us to see the difference between lighter and heavier workloads.
CrystalDiskMark x64
CrystalDiskMark is used as a basic starting point for benchmarks as it is something commonly run by end-users as a sanity check.
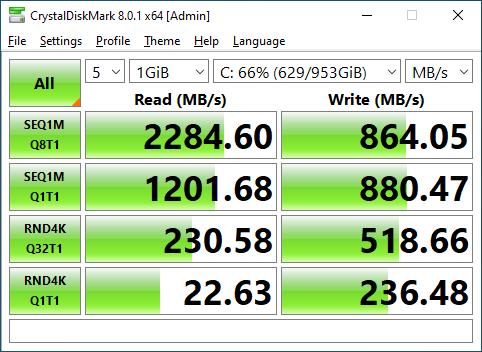
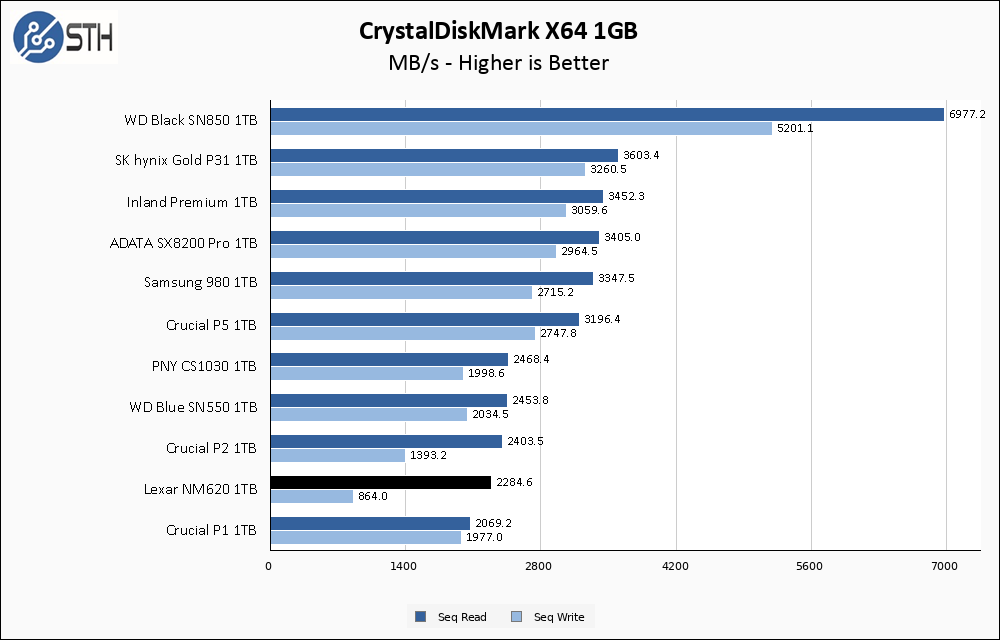
My primary philosophy when reviewing SSDs is to judge them against their own advertising first, and against their market peers second. Starting with CrystalDiskMark, the Lexar NM620 utterly fails on both fronts. Sequential performance of 2284 MB/s and 864 MB/s fall far away from the advertised 3300 MB/s and 3000 MB/s numbers. In the context of the rest of our drives on this graph, the Lexar is dead last for writes and nearly at the bottom for reads.
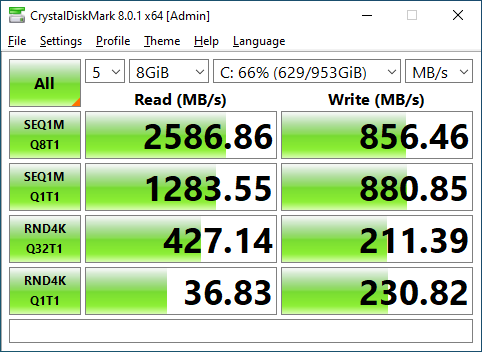
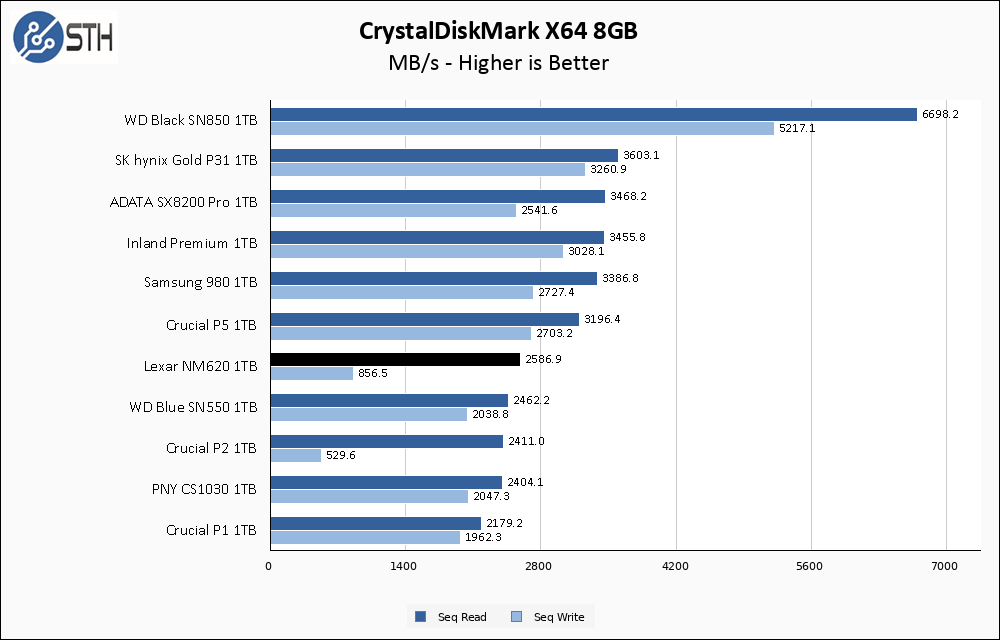
Moving to the larger CrystalDiskMark test actually helps read performance a bit, though not enough to meet the Lexar’s own advertised speeds. Write performance remains terrible, though at least it manages to beat the very poorly performing Crucial P2 1TB in that regard.
ATTO Disk Benchmark
The ATTO Disk Benchmark has been a staple of drive sequential performance testing for years. ATTO was tested at both 256MB and 8GB file sizes.
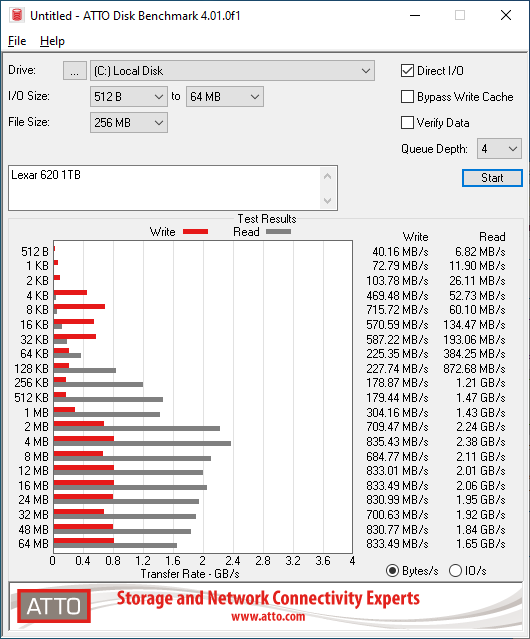
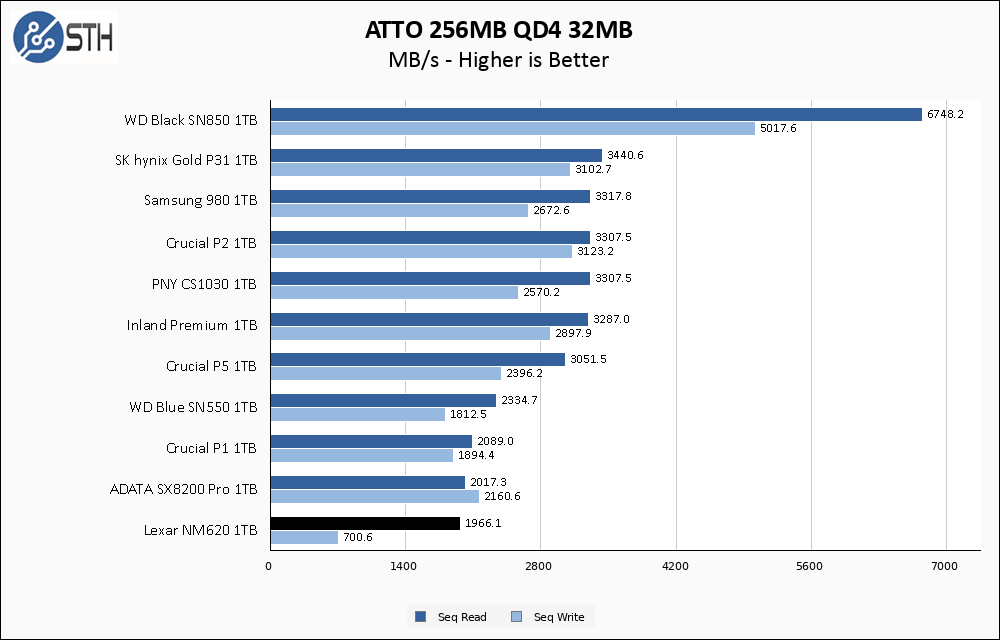
Keeping to the trend started by CrystalDiskMark, ATTO again shows the Lexar both unable to perform up to its own advertised spec, as well as diving straight down to the bottom of our performance charts. The performance here is even worse than under CrystalDiskMark.
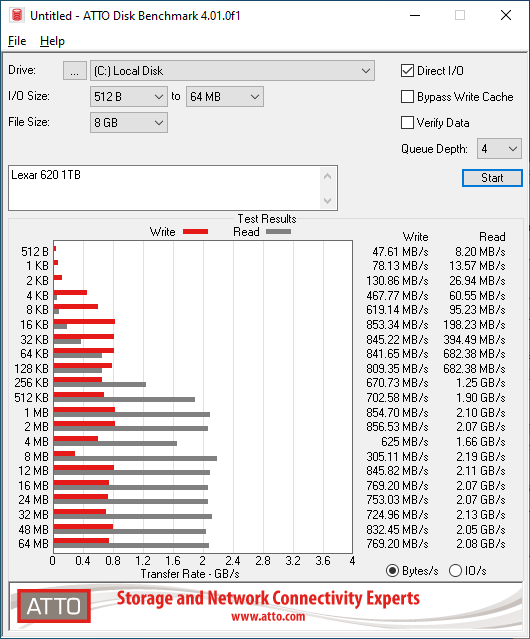
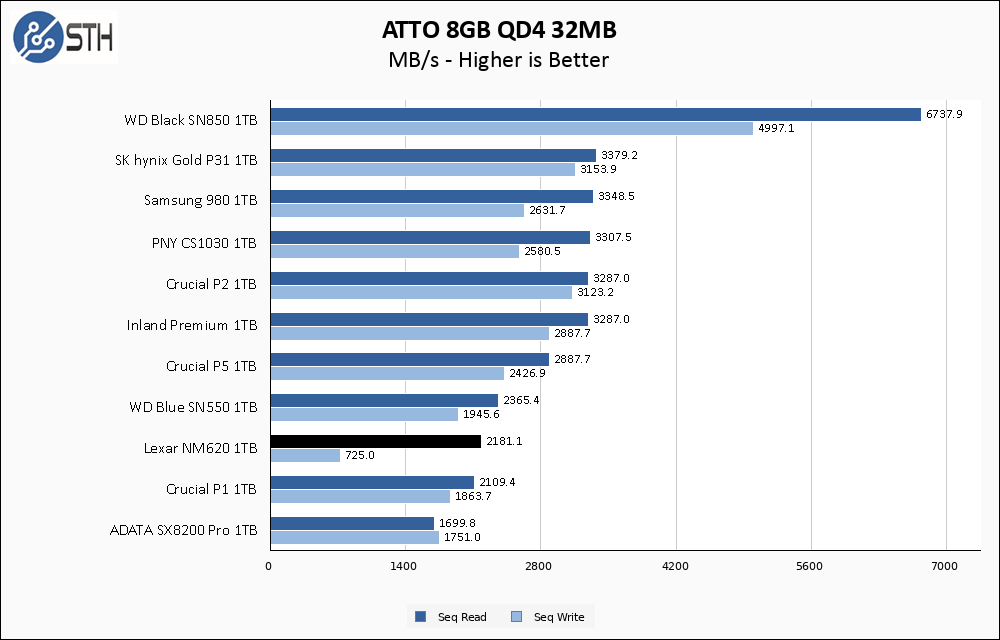
At least moving to the larger ATTO test has little effect on the Lexar NM620 1TB, and as a result, in relative read speed rankings, the drive manages to move up a couple of notches. On the other hand, sequential write speed is still riding the bottom of our chart by a large margin. ATTO is also commonly used to show best, or near-best case sequential performance so failing to come close to advertised speeds here is a major miss.
Anvil’s Storage Utilities
Anvil’s Storage Utilities is a comprehensive benchmark that gives us a very in-depth look at the performance of drives tested. This benchmark was run with both a 1GB and 8GB test size.
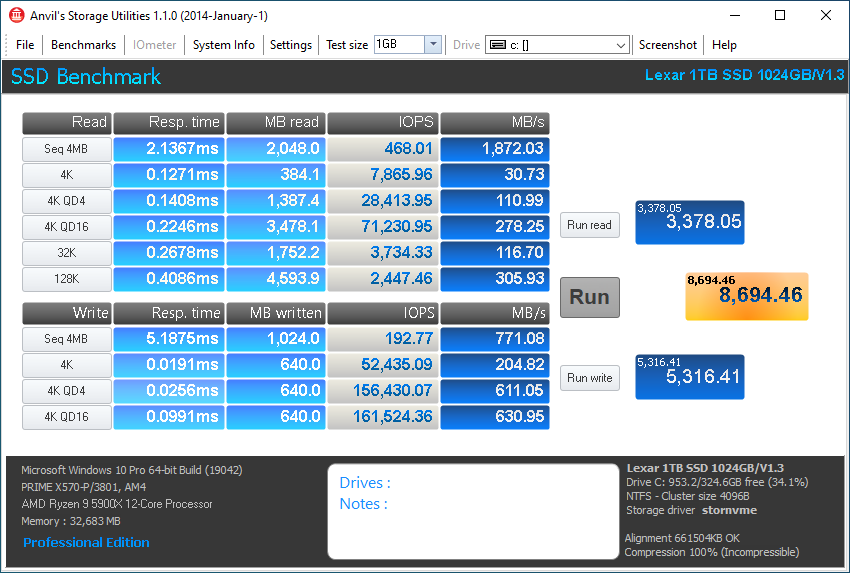
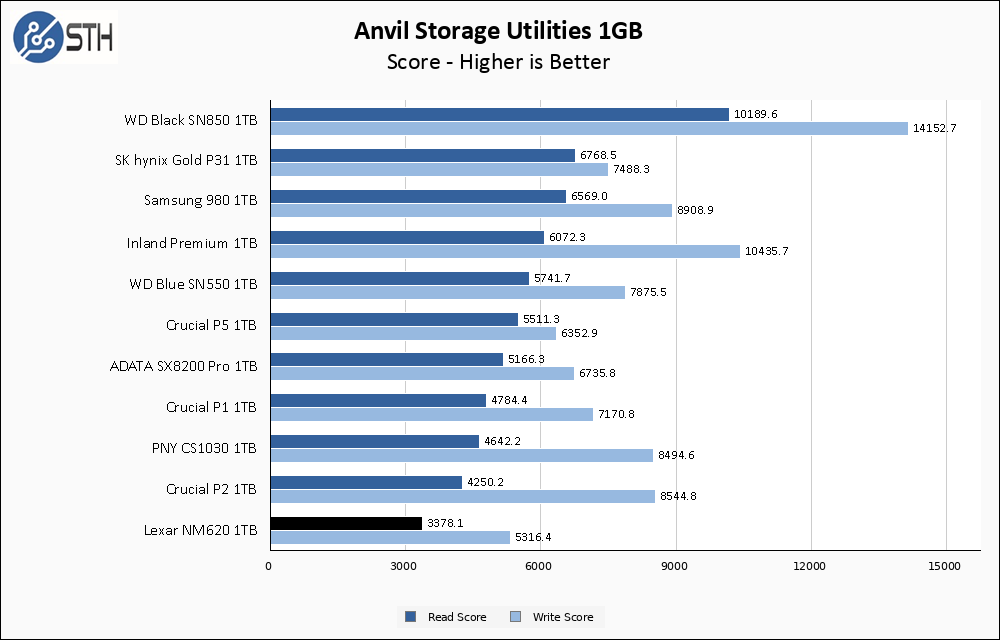
Call me a broken record, but the Lexar NM620 1TB is at the bottom of the chart again. Do not expect it to move far for the rest of the review. Terrible sequential read and write speeds continue to plague the drive, and higher queue depth random performance is not doing the drive any favors either.
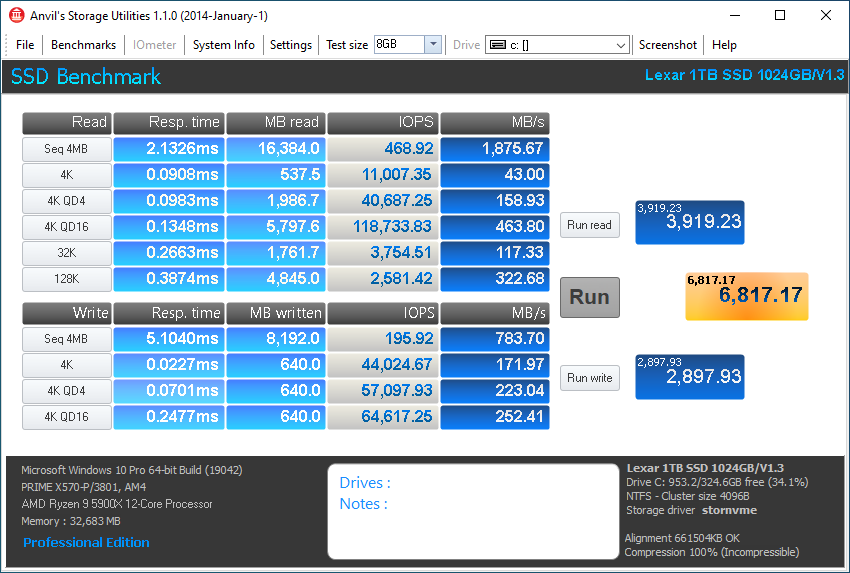
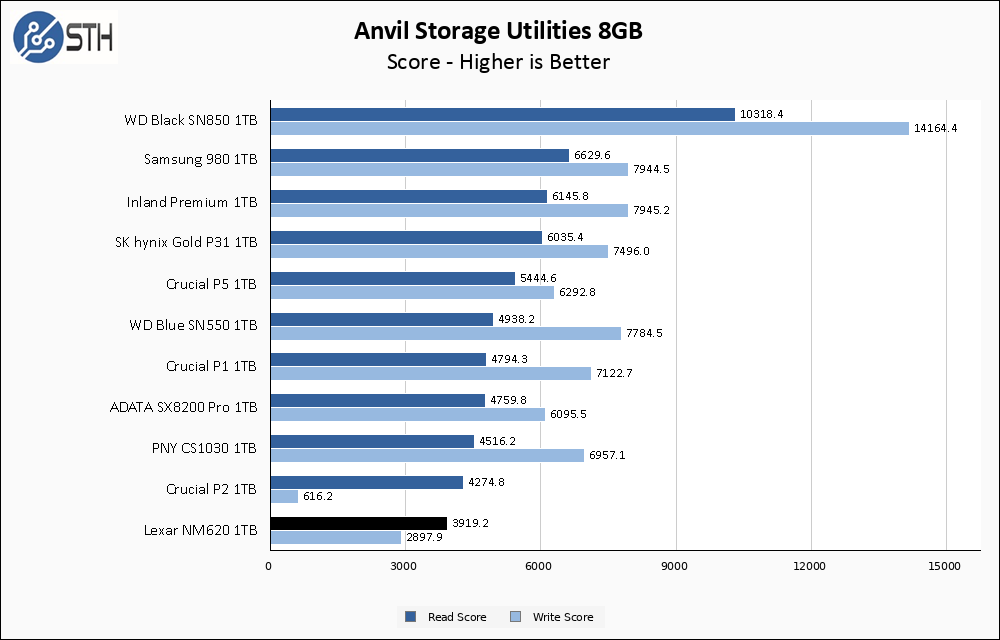
The best that can be said about the Lexar NM620 is that its performance did not crater when moving to larger test sets. Read speed remains the lowest on our chart, but write speed manages to notch a win versus the Crucial P2.
AS SSD Benchmark
AS SSD Benchmark is another good benchmark for testing SSDs. We run all three tests for our series. Like other utilities, it was run with both the default 1GB as well as a larger 10GB test set.
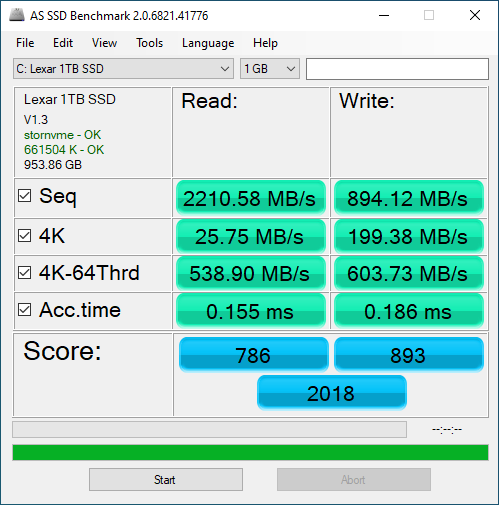
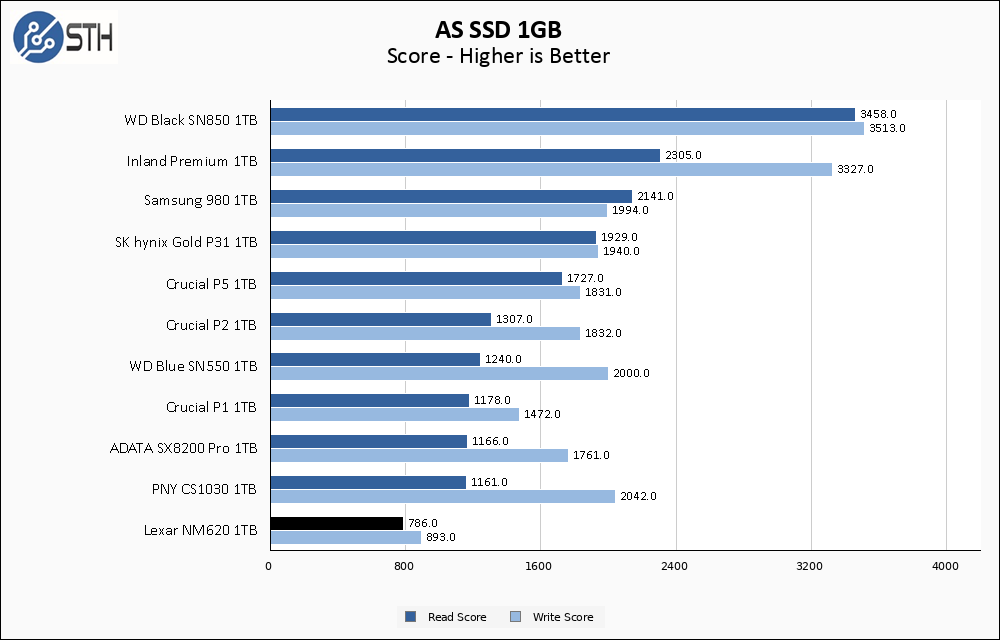
The Lexar NM620 is at the bottom of our chart again. Poor sequential and random performance, both on read and writes, are responsible for the low scores.
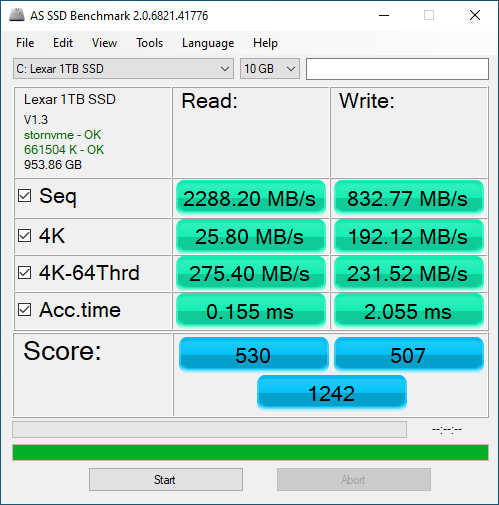
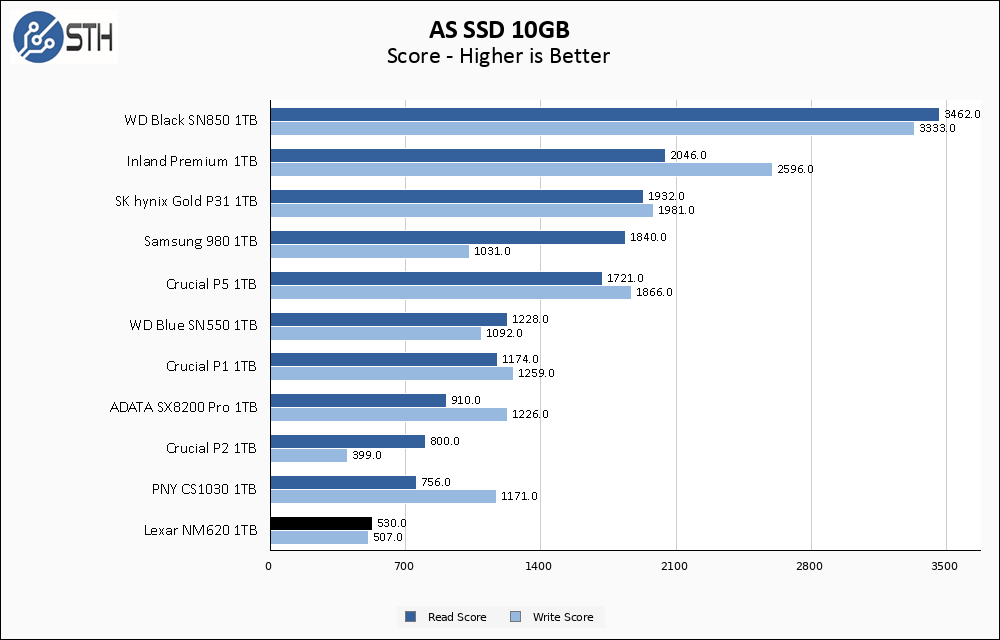
On the larger AS SSD test, write speed manages to again beat the Crucial P2, but only barely. Read speed continues to search for the bottom of the graph.
SPECworkstation, direct comparisons, thermals, and our conclusion are up next.


An honest review! Thank you!
Out of curiosity, do we know if this thing is based on some bottom-of-barrel NAND and, while clearly overpriced, doing a decent job of salvaging the situation given what it’s working with; or did Lexar manage to squander some perfectly decent flash chips by handicapping them at the controller?
“A Spectacular Fail”
Score: 5/10
This reminds me if IMDB scores…
fuzzyfuzzyfungus,
I just peeled back the sticker, the NAND is Micron 96L TLC, same as used on a number of very nice PCIe 4.0 NVMe SSDs. I would wager it is the controller holding this whole setup back, but I have almost zero insight into the controller itself since none of my customary utilities can interrogate it.
minor error here ” 2018-era PCIe 4.0 NVMe SSDs.”… probably means PCIe 3.0.
So is it now necessary for serious review sites to figure out how to approximate some validation of flash endurance specs?
And although the NAND in use here is Micron, I trust everyone is aware that Lexar hasn’t been a Micron brand for nearly 4 years now.
Bob Niland,
I have actually considered writing to drives until they die as an endurance test. However, the logistics of time almost always prevent that from happening. In this drive’s specific case, thanks to the abysmal post-cache write speed it would take 230+ days of continuous writing to reach the rated endurance level, and even on a much faster drive like the Samsung 980 you are looking at amounts of time measured in weeks instead of days. To me, the endurance rating is more like a facet of the warranty; it’s the mileage counter on your car- it exists to limit the warranty, not to enhance it.
Thanks for checking on the NAND. That is not a good sign for their controller and/or firmware.
A design focused on scraping adequacy out of really awful flash could actually be an interesting and legitimate contender(not as a direct substitute for high performance SSDs; but of interest for less performance critical bulk storage, or in applications that just don’t mechanically or electrically support HDDs); but kneecapping a TB of actually good flash by chasing some NIH internal design rather than being willing to throw Phison or similar a few bucks is just bad.
It’s very well possible the drive is throttling. At 70 degrees it is probably reducing clocks or write operations to keep within thermal budget. The 980 pro and other nvme drives have a heatsink or heatspreader sticker that helps keep them cool.
Mark,
It is possible the drive is throttling during the initial load when it hit the 70C temp, but not during the rest of benchmarking as the drive was allowed to cool a bit prior to benchmarking. Also, the drive *began* writing at around 850 MB/s, it is not like it had a brief burst at 3300 MB/s and then slowed down, it *started* slow.
Will: …230+ days of continuous writing to reach the rated endurance level…
I hadn’t run the numbers, but that is not at all surprising, and in this case being a deliberate design decision must be pondered. Even on credible brands, in addition to time, you’re testing to destruction, and tying up some computer. Might be worth a look once in a while.
On another enthusiast site this week, who list Lexar as a Partner, they ‘tested’ a Lexar SATA SSD in a glowing review …
… that benched it against an HDD.
Preserved that ad revenue, I suppose.
Mark,
You got me *just* paranoid enough about thermal throttling that I re-installed this drive and ran the CDM benchmark again. At no point in the test did the drive pass 62C – I monitored it the entire time – and the results were within the normal run-to-run variance and nearly identical to the results in the review. Also prior to publishing I had done a cursory check on the internet to see what other reviewers found, and over on Storagereview they had an equally terrible result with the drive, so I do not think it is just me!
In my opinion a spectacular fail would be data loss. Do any of these tests actually check the integrity of the data?
Will,
Thanks for the thorough follow-up! I remembered some ssd’s did have this issue (Samsung 950 pro I believe). Okay clear conclusion then: it’s just a shitty ssd and no amount of cooling will improve the situation. :)
Just as an FYI…
A guy ran a SSD endurance test on a Sheiknak 120GB SSD and it went about 320TB before completely dying after 3 months. A 256GB BX500 went over 1PB before it died after a year. They found that the longer you write on it, the slower it starts to get.
The Flash is not going to give out on 99.999% of these things before something else goes out like your patience.
https://www.youtube.com/watch?v=jHpSIBpvU0A&t=163s
You clearly have defective ssd or motherboard. Instead of checking hardware and contacting warranty support for obvious performance discrepancy you create article based on fake data.
I just checked my NM620 1TB in crystaldisk mark and got 3481 read and 3168 write.
It is also worth noting that I only use 270GB of capacity, the rest is unformatted (I do not need more space for now). My C drive only has 58GB free space. So I should have even worse results than you.
I even wasted more time to repeat all your tests to prove you are wrong. All visitors can see my crystaldisk mark, otto, as ssd and anvil results here:
imgur.com/a/NaXN8fu
Then I created 3rd partition from unused space for test purpose. It was 683GB in size, and then I created 682GB test file using dummy file creator software
Write speed was 2,5GB/s until file reached ~200GB then it dropped to fluctuation between 996-942MB/s. Near 400GB file size, write speed dropped to ~140-190MB/s and remained on this level until 682GB was written.
i.imgur.com/micaTPv.png
I have no idea how to “fill the drive with 10 simultaneous write threads” but in normal use (full write speed of file) I was not able to kill drive so badly as you – never dropped below 140MB/s write speed. And really – how often do you write whole disk at once? Disk works great (2,5GB/s) until you write more than 200GB at once, and still works good (~1GB/s) until you write more than 400GB which pretty much never happens.
This is probably best daily use disk on market considering big speeds and low price. I switched to it from WD blue sn550 and I love it. It is best seller in all online shops in my country.
Of course it will not be best on market if you want to dump 1TB of data at it daily – but 99% of users never do, and the rest has enough money to buy 2TB 980 Pro….
P.S.
You test drives when they are filled with 60%.
After 2nd test where I created 3rd partition with dummy file, my disk was filled with 61+76+682GB = 819/931=88% full.
And I still got 2900MB/s write in crystal disk at 1GB sample and 1150MB/s at 10GB sample. My guess is on 60% filling I would get same results as on empty drive.
Piotr,
I do not have a defective SSD – I tested using two of them, the second one provided directly by Lexar. As for my motherboard, I used the same test bench platform I used on every other SSD I test. No other SSDs I test, before or since, seem to have a problem with my setup.
You state that you only use 270GB of capacity and the rest is unformatted and that only 58GB is free so “I should have even worse results than you”, and in your posted benchmarks you only have a 120GB C drive on this disk. Leaving unformatted disk space is equivalent to leaving empty space, not to having used space, so if you’ve got a disk that has a 120GB partition and you’re only using 61GB of it and the rest is unformatted, your disk will perform like a disk with 6.4% space utilization. This isn’t exactly apples to apples with my testing. You say something about ‘only use 270GB of capacity’ so perhaps you have a second partition, but even if that second partition is 100% full then combined with the 61GB used on the C drive you’re at 211GB of total use, adding up to your drive being 22% full, which again is not apples to apples with my testing.
Not only that, but I test drives when they are around 60-65% utilization *after* they were filled to 85% and then have a portion of the data deleted, but TRIM is not run. This puts the drive into a ‘dirty’ state, at least somewhat similar to a drive in its midlife condition where perhaps a user is managing space by deleting things to keep an acceptable amount of free disk space.
Lastly, ‘how often do you write the whole disk at once’ isn’t the point of the sustained write test. The point of that test is to understand the speed of the drive writing direct to the NAND after exhausting all the buffers and caches and so forth, so that readers can get some kind of an idea as to the minimum performance they might experience with a drive.
I’m glad the NM620 is working well for you, and for anyone else that owns it. It just did not do well in my testing. I wish you well.
I have this, but the 512GB version. My CrystalDisk scores are like advertised:
3520 – 2680
2650 – 750
800 – 630
63.60 – 229.9
This was tested being the main Windows drive. When the drive was empty as a secondary drive the speed was a little higher (reached 3650MB/s Read speed). During the small CrystalDisk test it was never hotter than 39ºc (ambient temp 17ºc). I’m using the motherboard heatsink over it.
So I think in this review/test there was some problem either with that batch of drives, or the motherboard had a problem, or the PCIe lines are full, or there was a thermal problem. Or maybe there are batches with different memory chip brands, like in GPUs were Micron alwas perform worst than Hynix.
Hi
can you answer me fast or email me if possible
i want to buy nvme today
and it seems this drive will be slow by filling drive
but this nvme has new version and controller has changed to maxio map1202
i want to know is newer drive better or it’s same as older version ? i mean in terms of losing performance by filling storage .
You clearly have a lemon here, mine scored 3440 – 3021 being over 50% full.
I have 11 Intel i7-1195G7 w 32 GB of RAM with these drives – they are as advertised here – terrible. Specifically during re-imaging the drives with Windows 11 and apps we use. We re image them and during imaging, the MB falls to 20-30MB – EVERY single one! Any other SSD we use do not have this issue – from Samsung EVO / PRO, Crucials, etc – just this Lexar. Review is spot on for sustained writes.
Correction -not 11th Gen but 13th Gen Intel Core i7 13620H
I have 11 Intel 13th Gen Intel Core i7 13620H w 32 GB of RAM with these drives – they are as advertised here – terrible. Specifically during re-imaging the drives with Windows 11 and apps we use. We re image them and during imaging, the MB falls to 20-30MB – EVERY single one! Any other SSD we use do not have this issue – from Samsung EVO / PRO, Crucials, etc – just this Lexar. Review is spot on for sustained writes.
Have one from a geekom mini pc. It failed after 2 years.
Comments are closed.