Kingston A2000 1TB Performance Testing
We test using both the default smaller test size as well as larger test sets on our benchmarks. This allows us to see the difference between lighter and heavier workloads.
CrystalDiskMark x64
CrystalDiskMark is used as a basic starting point for benchmarks as it is something commonly run by end-users as a sanity check.
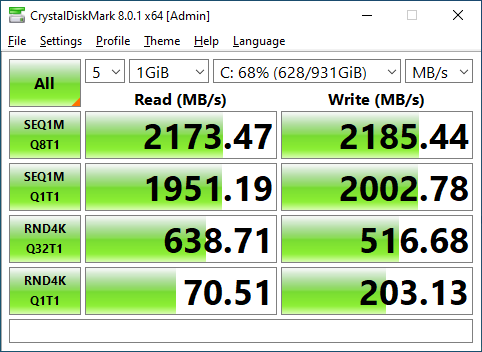

The Kingston A2000 very nearly matches its rated 2200 MB/s read and 2000 MB/s write speeds, with results coming in close enough for me to give it a pass. Given the specs are on the lower-end of PCIe 3.0 drives it is no surprise the A2000 finds itself near the bottom of our charts, but judged in isolation there is nothing wrong with the results on the A2000.
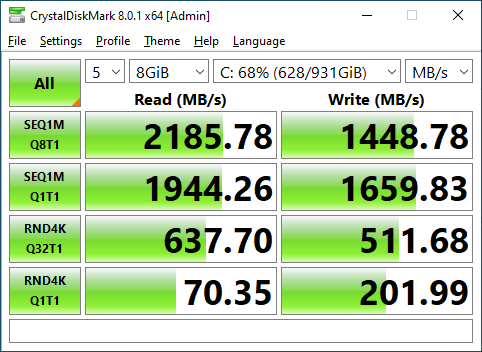
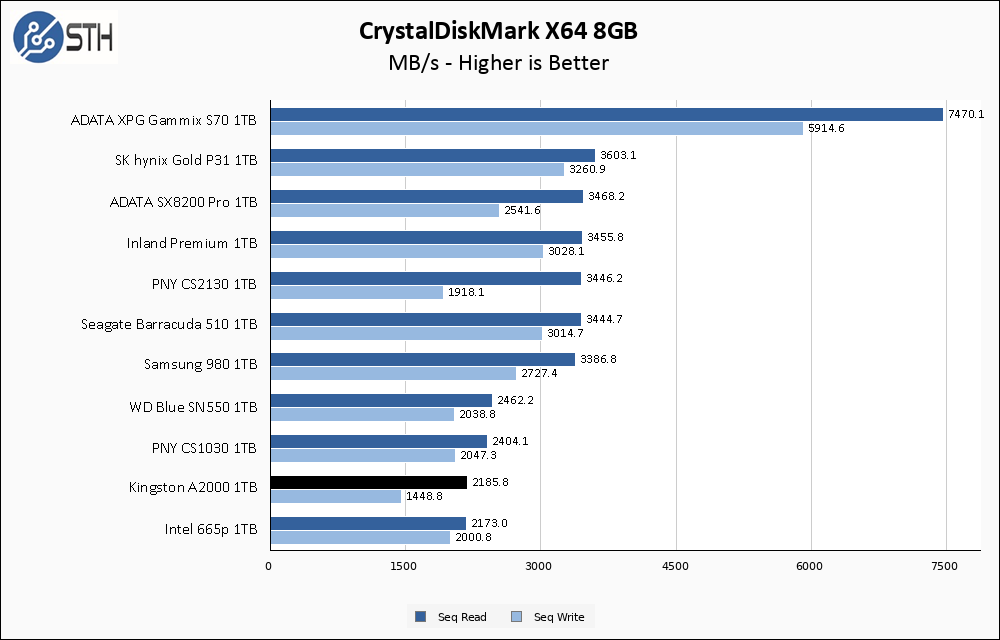
On the larger CrystalDiskMark test, write performance slips up a bit and drops to 1400 MB/s. The Intel 665p with its QLC NAND manages a better write performance here, which is disappointing for the A2000.
ATTO Disk Benchmark
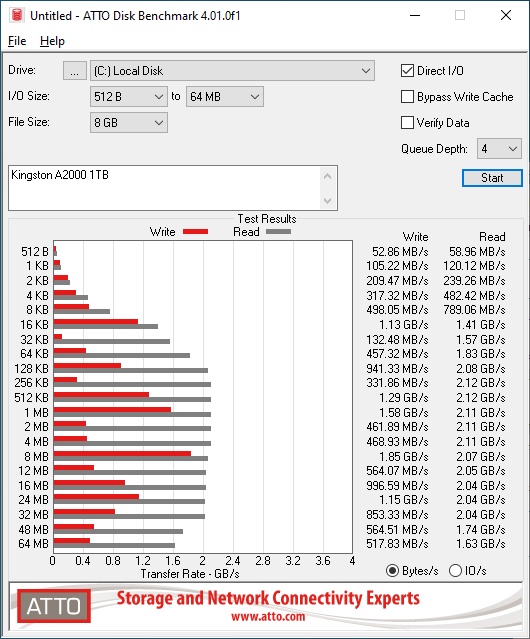
The ATTO Disk Benchmark has been a staple of drive sequential performance testing for years. ATTO was tested at both 256MB and 8GB file sizes.
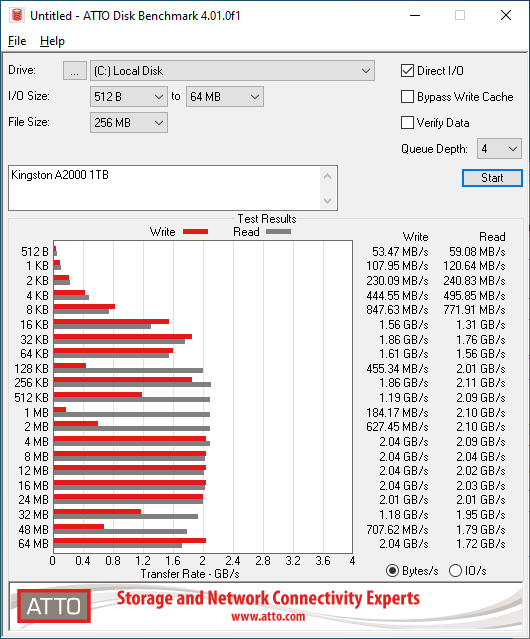
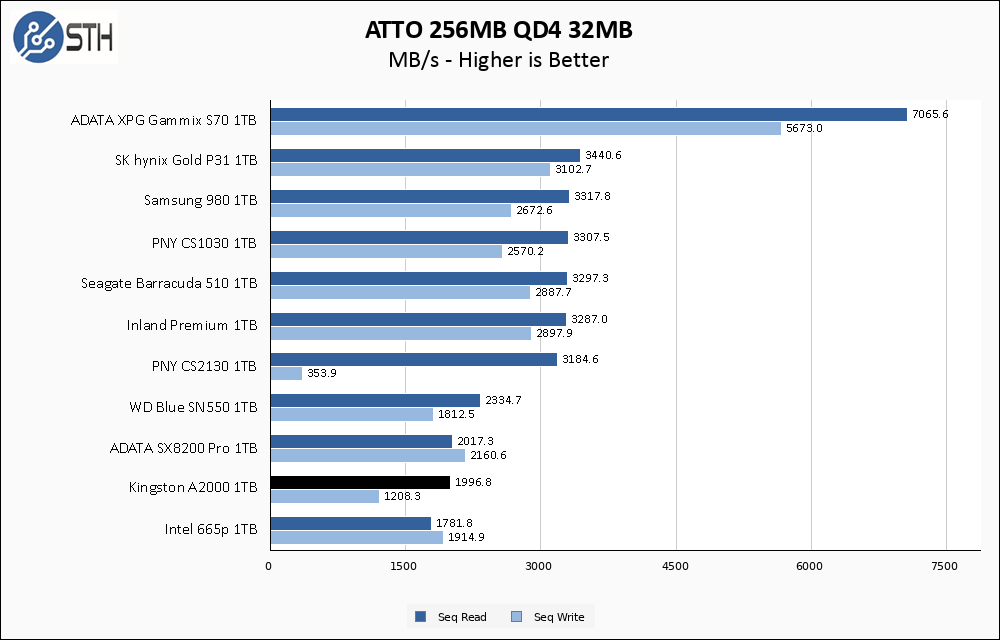
ATTO results are not particularly good. For portions of the run performance rides relatively close to the rated sequential performance, but several of the tests show significant variability in performance. Unfortunately for the A2000 this includes the 32MB datapoint that my results chart is drawn from, causing it to display particularly poor write performance on my graph.
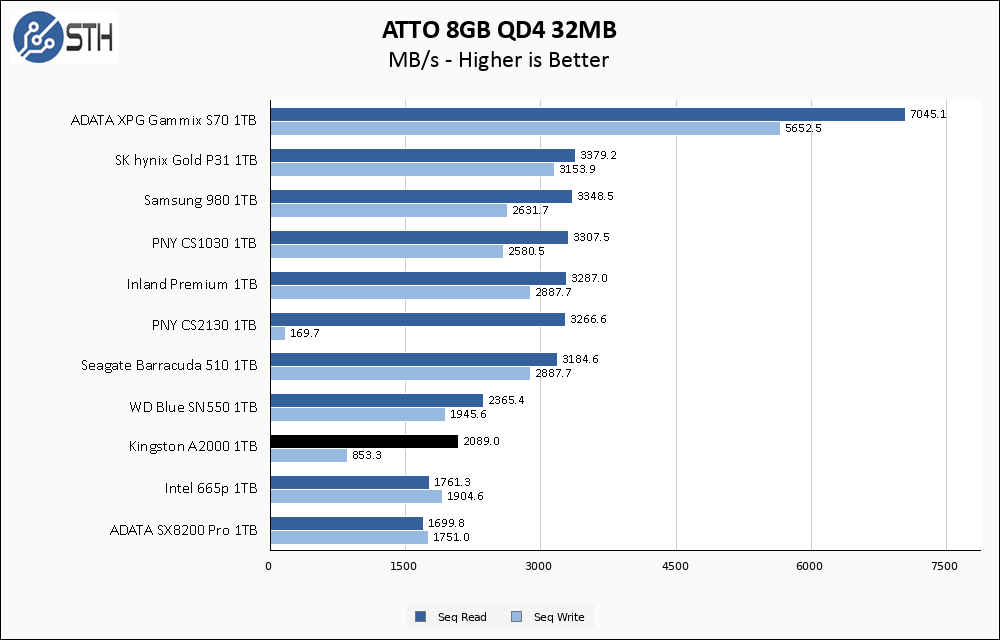
The performance instability continues on the larger ATTO 8GB test set, with even more extreme swings in performance.
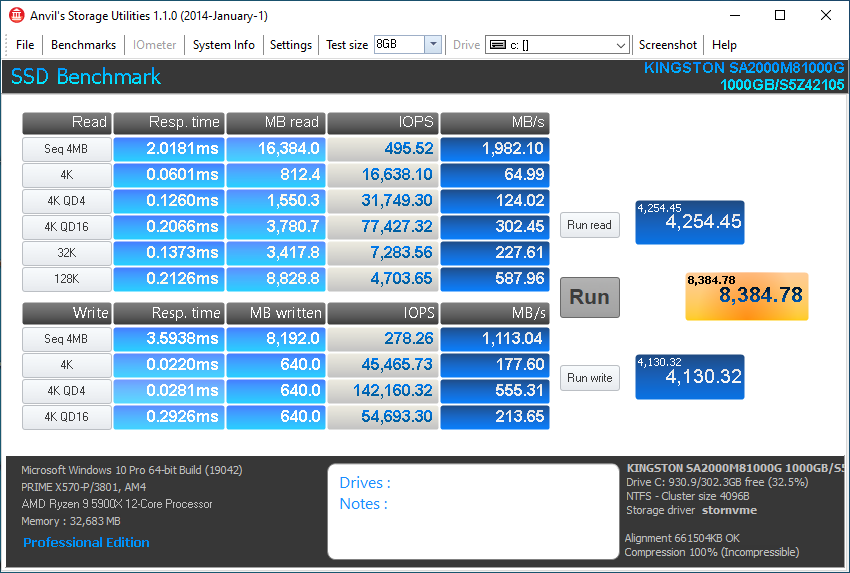
Anvil’s Storage Utilities
Anvil’s Storage Utilities is a comprehensive benchmark that gives us a very in-depth look at the performance of drives tested. This benchmark was run with both a 1GB and 8GB test size.

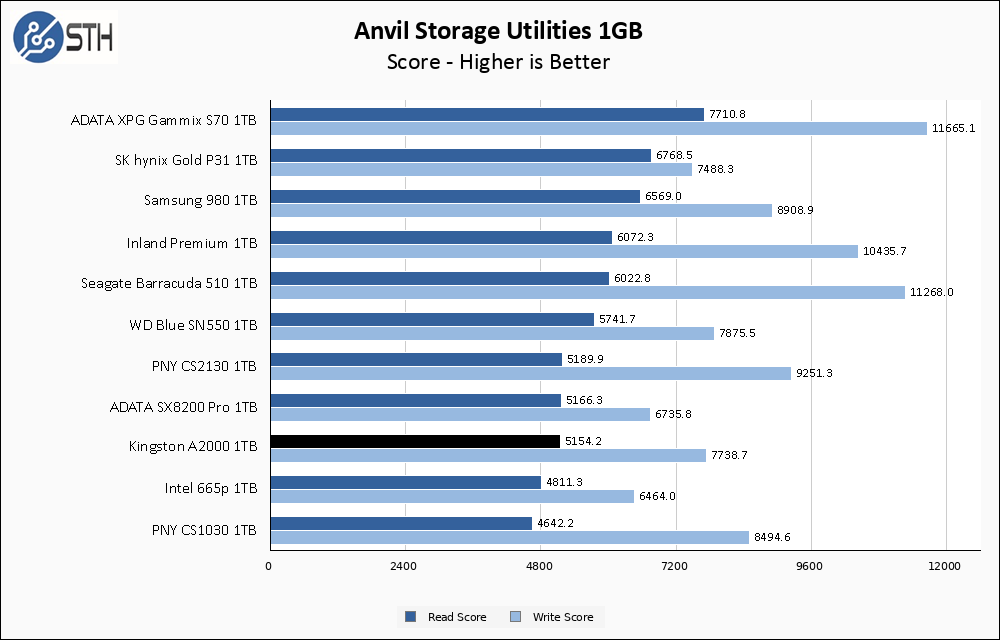
Compared to ATTO, the Kingston A2000 1TB performance in Anvil is perfectly normal. The A2000 is still down near the bottom of our chart, but there is nothing of true concern about these results and the drive is performing as expected given its specifications.
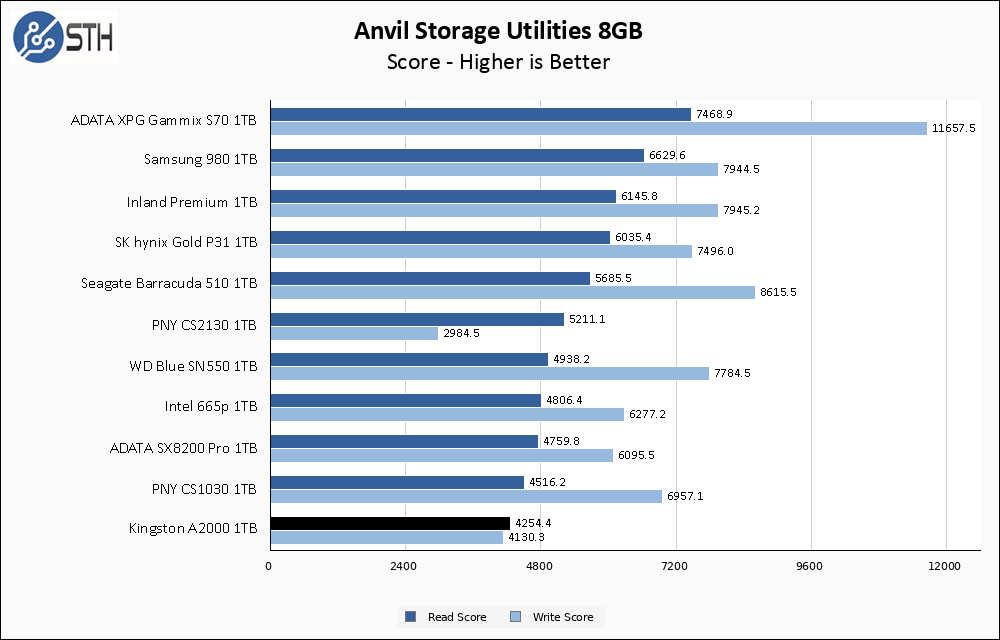
As with before, the larger test set takes a bit of a toll on the A2000 particularly with regards to the write score. While this result is not particularly great, it still avoids the most extreme performance cratering experienced by the likes of the PNY CS2130.
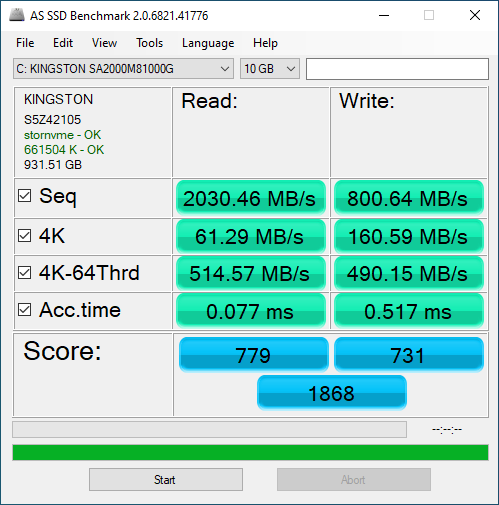
AS SSD Benchmark
AS SSD Benchmark is another good benchmark for testing SSDs. We run all three tests for our series. Like other utilities, it was run with both the default 1GB as well as a larger 10GB test set.
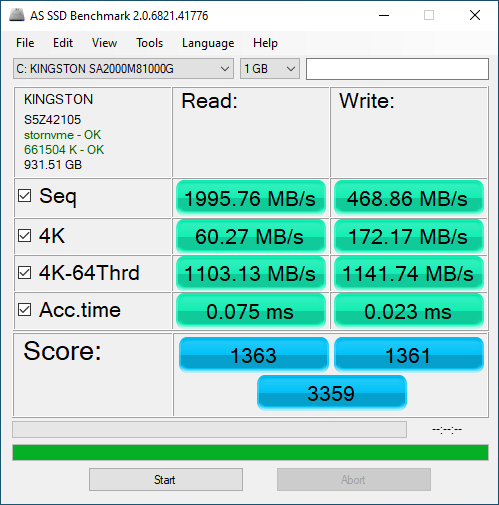
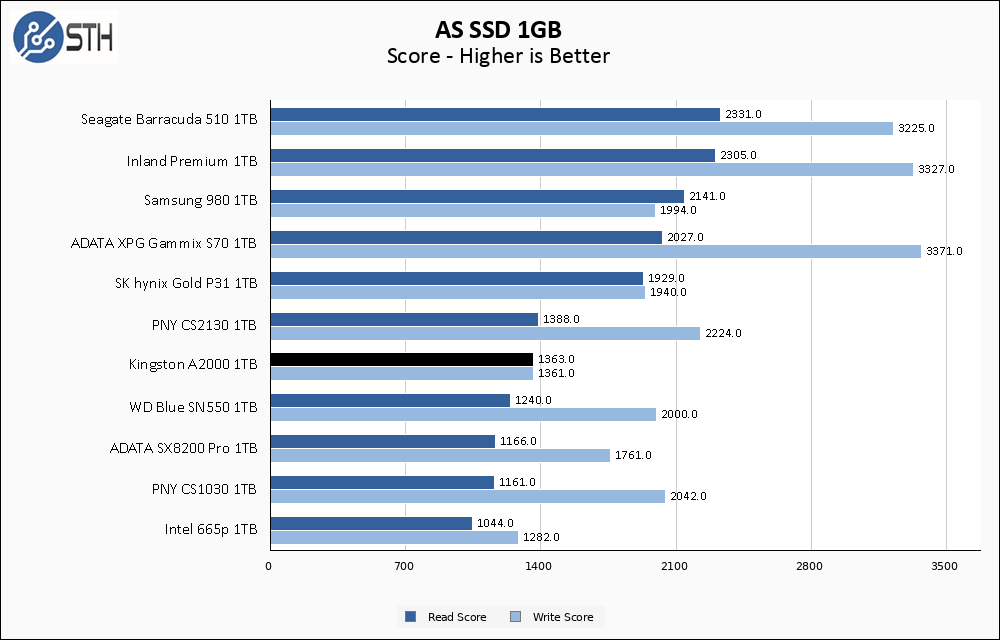
In AS SSD, the Kingston A2000 1TB turns in its best overall performance yet if you judge by the position on the chart. Write speed still continues to be the Achilles heel of this drive, turning in highly variable sequential performance numbers from run to run.
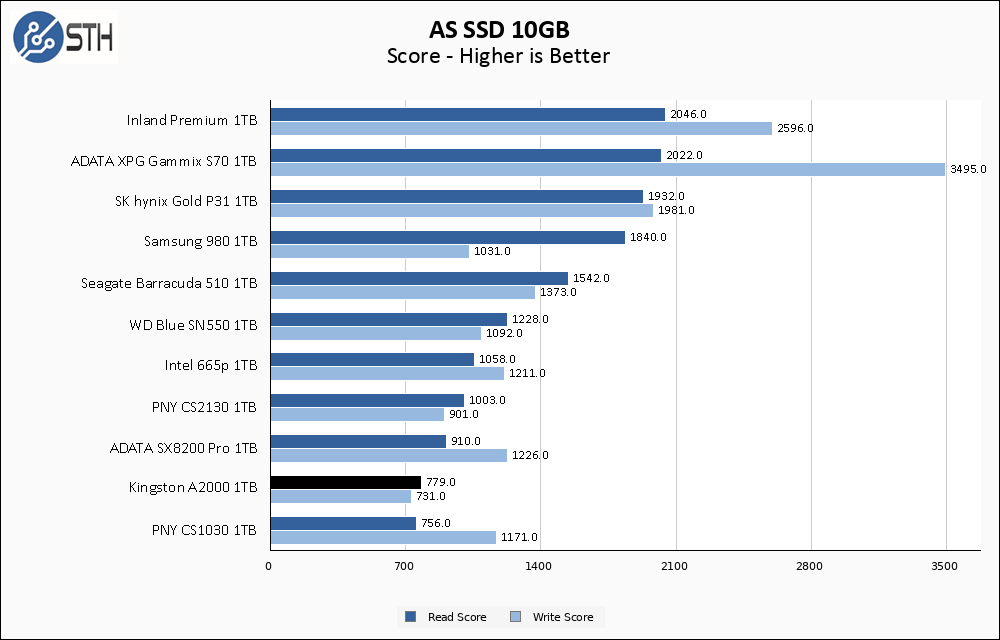
Almost every drive drops in AS SSD’s larger test and the Kingston A2000 is no different. Sequential performance actually improves over the smaller test, but the highly threaded random workloads take a huge hit resulting in a much lower overall score.
SPECworkstation, thermals, and our conclusion are up next.


Thanks for the test! Was the most recent firmware installed on the A2000?
One thing to note: Where the A2000 really shines in comparison to the SN550 and other SSDs in this price range is mixed read/write workloads, perhaps due to its DRAM cache. See e.g. TPU review:
https://www.techpowerup.com/review/kingston-a2000-1-tb-m-2-nvme-ssd/4.html
Comments are closed.