Intel Xeon Silver 4210 Benchmarks
For this exercise, we are using our legacy Linux-Bench scripts which help us see cross-platform “least common denominator” results we have been using for years as well as several results from our updated Linux-Bench2 scripts. Starting with our 2nd Generation Intel Xeon Scalable benchmarks, we are adding a number of our workload testing features to the mix as the next evolution of our platform.
At this point, our benchmarking sessions take days to run and we are generating well over a thousand data points. We are also running workloads for software companies that want to see how their software works on the latest hardware. As a result, this is a small sample of the data we are collecting and can share publicly. Our position is always that we are happy to provide some free data but we also have services to let companies run their own workloads in our lab, such as with our DemoEval service. What we do provide is an extremely controlled environment where we know every step is exactly the same and each run is done in a real-world data center, not a test bench.
We are going to show off a few results, and highlight a number of interesting data points in this article.
Python Linux 4.4.2 Kernel Compile Benchmark
This is one of the most requested benchmarks for STH over the past few years. The task was simple, we have a standard configuration file, the Linux 4.4.2 kernel from kernel.org, and make the standard auto-generated configuration utilizing every thread in the system. We are expressing results in terms of compiles per hour to make the results easier to read:
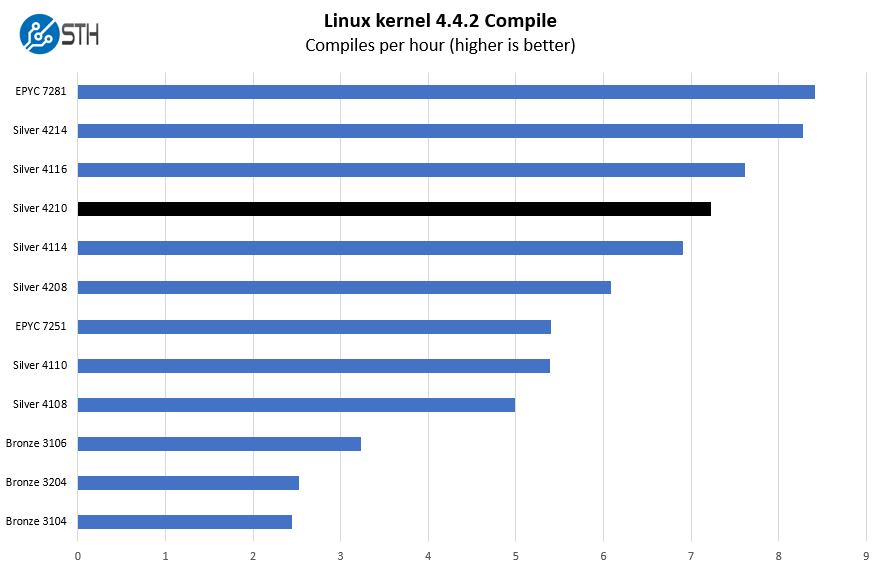
We are going to see this trend a lot here. The Intel Xeon Silver 4210 is in the performance range of somewhere between the Intel Xeon Silver 4114 and Intel Xeon Silver 4116. While the 2nd gen Intel Xeon Scalable family did not necessarily increase IPC, in this part of the stack Intel greatly increased the core counts. You can read about it in our Second Generation Intel Xeon Scalable SKU List and Value Analysis piece. In this case, the impact of adding two more cores and increasing clock speeds has an enormous uplift.
c-ray 1.1 Performance
We have been using c-ray for our performance testing for years now. It is a ray tracing benchmark that is extremely popular to show differences in processors under multi-threaded workloads. We are going to use our 8K results which work well at this end of the performance spectrum.
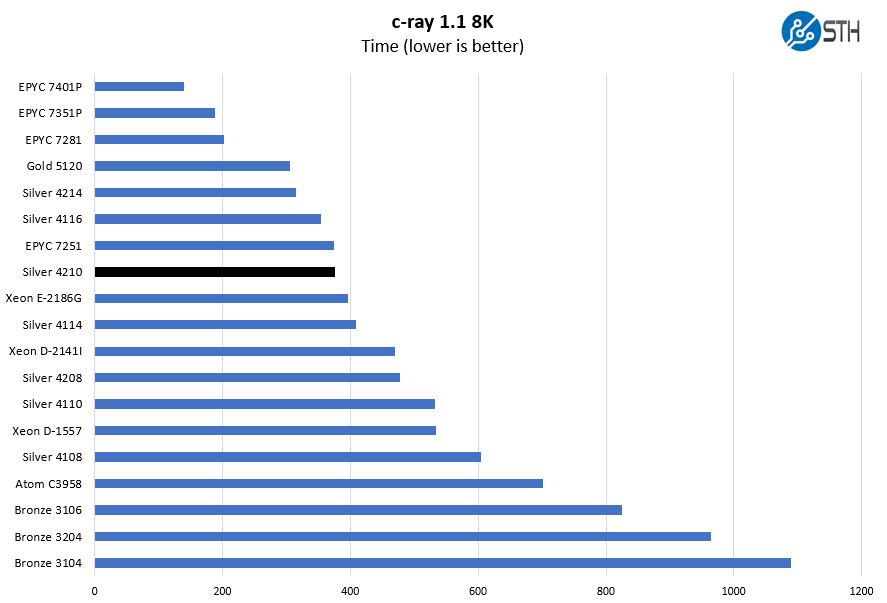
Again, this is an enormous uplift. C-ray tends to perform very well on AMD architectures so here the less expensive 8-core AMD EPYC 7251 nudges out slightly ahead on CPU performance. It is trading a single for quad NUMA node design but the AMD EPYC 7251 also has more raw memory capacity, bandwidth, and PCIe lanes at a lower list price.
7-zip Compression Performance
7-zip is a widely used compression/ decompression program that works cross-platform. We started using the program during our early days with Windows testing. It is now part of Linux-Bench.
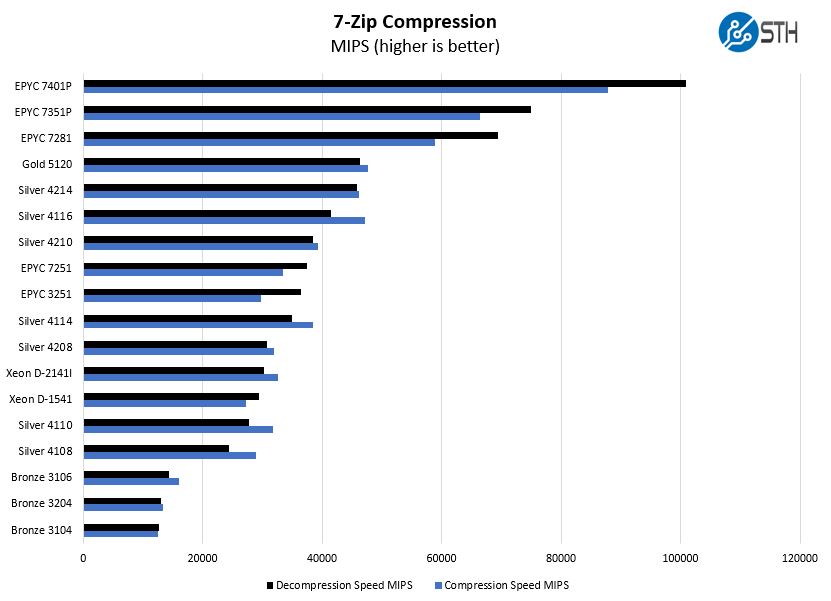
Here we see performance just above the AMD EPYC 7251, and just below the Intel Xeon Silver 4116. That is impressive at about half the cost of the first generation Intel Xeon Scalable CPU.
NAMD Performance
NAMD is a molecular modeling benchmark developed by the Theoretical and Computational Biophysics Group in the Beckman Institute for Advanced Science and Technology at the University of Illinois at Urbana-Champaign. More information on the benchmark can be found here. We are going to augment this with GROMACS in the next-generation Linux-Bench in the near future. With GROMACS we have been working hard to support Intel’s Skylake AVX-512 and AVX2 supporting AMD Zen architecture. Here are the comparison results for the legacy data set:
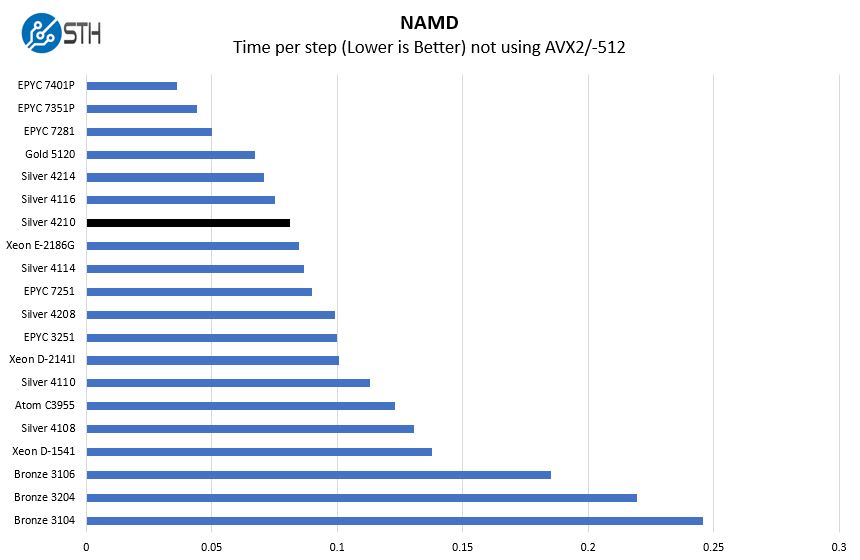
Here, the Intel Xeon Silver 4210 shows some impressive improvement over the Intel Xeon Silver 4208 CPUs. The price delta in a configurator is usually under $100, so we tend to think this is a good upgrade for most servers at a very nominal cost difference.
Sysbench CPU test
Sysbench is another one of those widely used Linux benchmarks. We specifically are using the CPU test, not the OLTP test that we use for some storage testing.
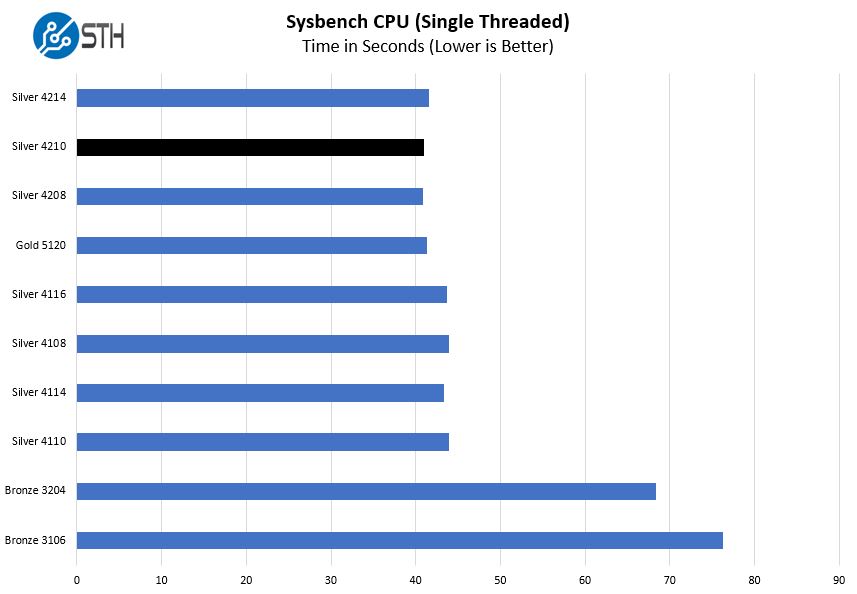
Here we wanted to show single thread performance because it shows an interesting story. The single thread performance is well above the previous generation Intel Xeon Silver 4100 line due to the 3.2GHz max turbo clock. It is now in-line with the Intel Xeon Gold 5120 which was a part that cost three times as much.
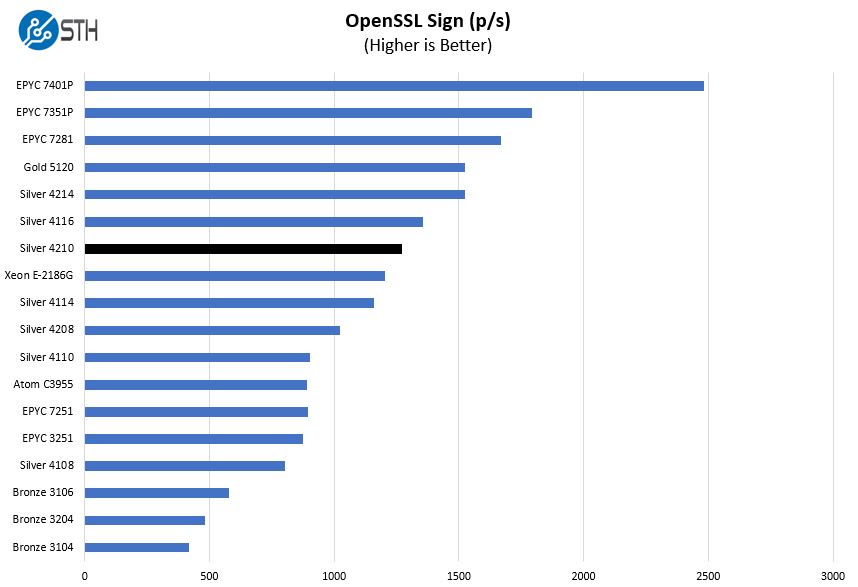
OpenSSL Performance
OpenSSL is widely used to secure communications between servers. This is an important protocol in many server stacks. We first look at our sign tests:
Here are the verify results:
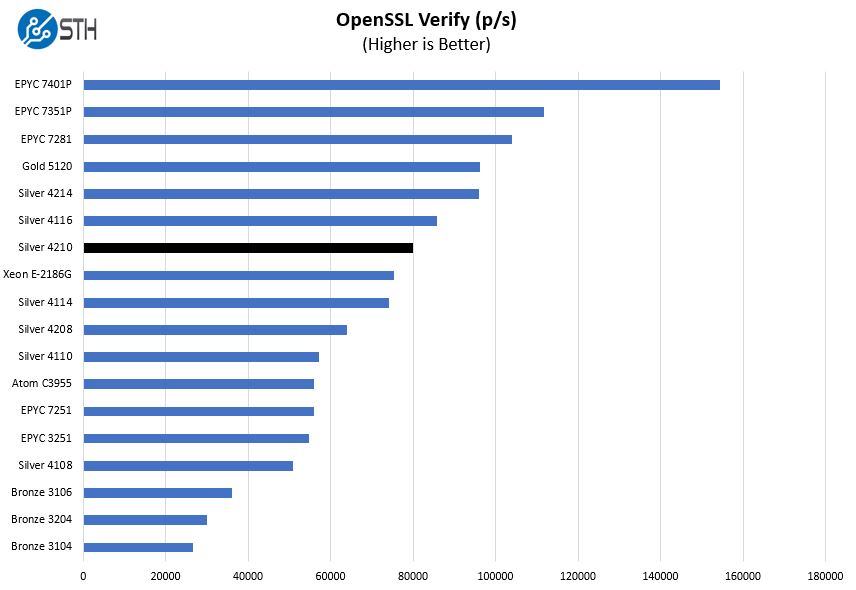
OpenSSL shows performance that is very strong. It nudges out both the 16 core Intel Atom C3955 as well as the high-clocked Intel Xeon E-2186G. In the pervious generation, the Intel Xeon Silver 4110 did not have significantly higher performance than either of those parts. With the Intel Xeon Silver 4210, that has changed.
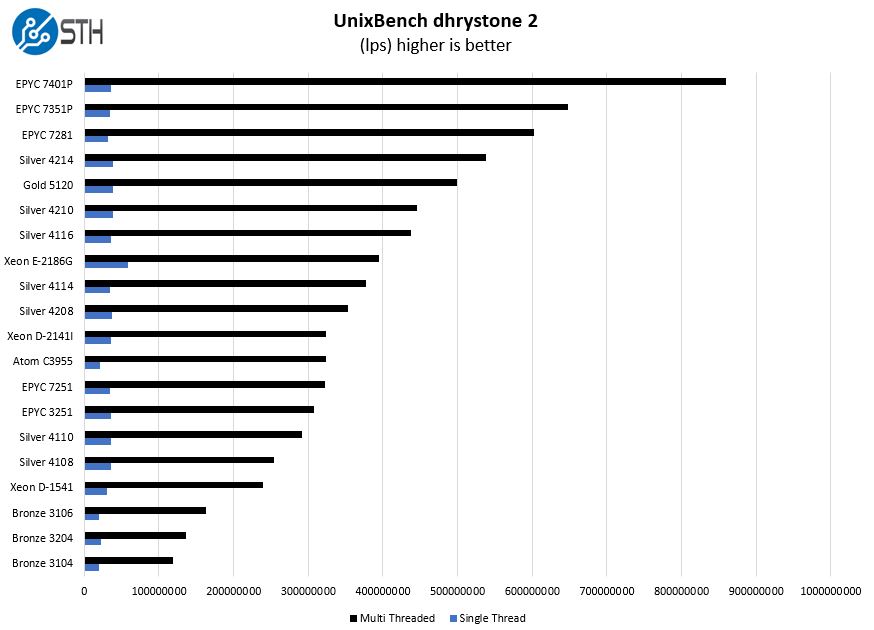
UnixBench Dhrystone 2 and Whetstone Benchmarks
Some of the longest-running tests at STH are the venerable UnixBench 5.1.3 Dhrystone 2 and Whetstone results. They are certainly aging, however, we constantly get requests for them, and many angry notes when we leave them out. UnixBench is widely used so we are including it in this data set. Here are the Dhrystone 2 results:
Here are the whetstone results:
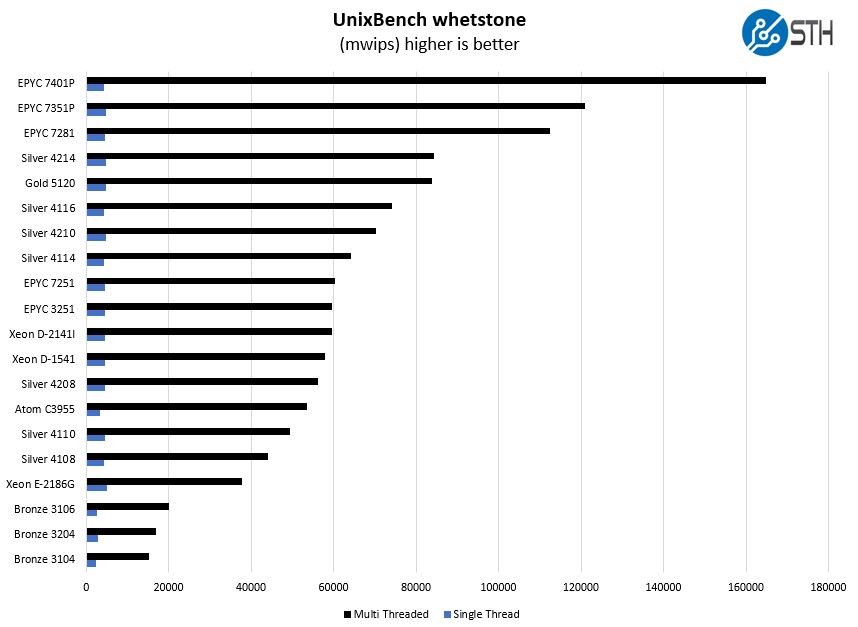
Here again, we see that the Intel Xeon Silver 4210 is delivering performance that would have cost about 80% more in the previous generation. That is a big deal in a low-cost segment like this.
GROMACS STH Medium AVX2/ AVX-512 Enabled
We have a small GROMACS molecule simulation we previewed in the first AMD EPYC 7601 Linux benchmarks piece. In Linux-Bench2 we are using our “small” case which is appropriate for single-socket servers. Our GROMACS test will use the AVX-512 and AVX2 extensions if available.
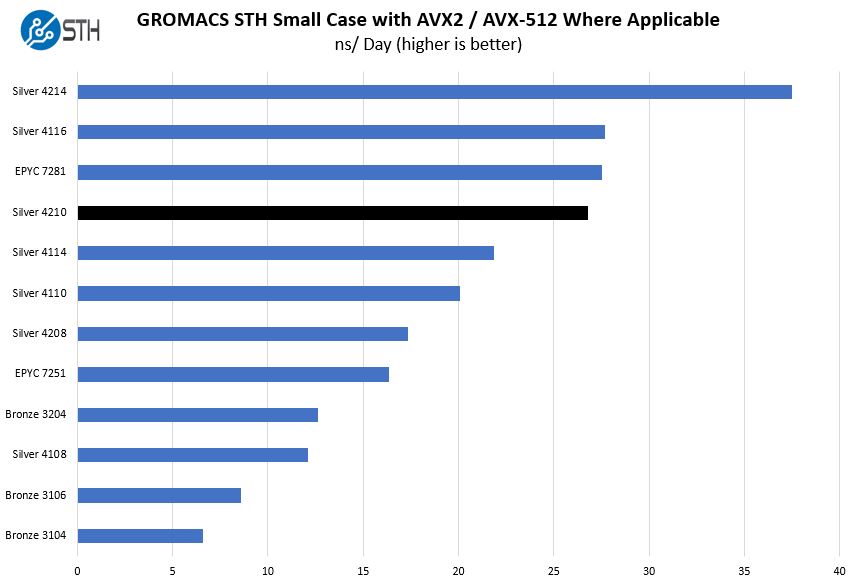
Here the Intel Xeon Silver 4210 is showing some fairly massive gains over its predecessors. Performance of this 10 core Intel Xeon Silver 4210 part is near the 12 core Intel Xeon Silver 4116 which cost almost twice as much.
Chess Benchmarking
Chess is an interesting use case since it has almost unlimited complexity. Over the years, we have received a number of requests to bring back chess benchmarking. We have been profiling systems and now use the results in our mainstream reviews:
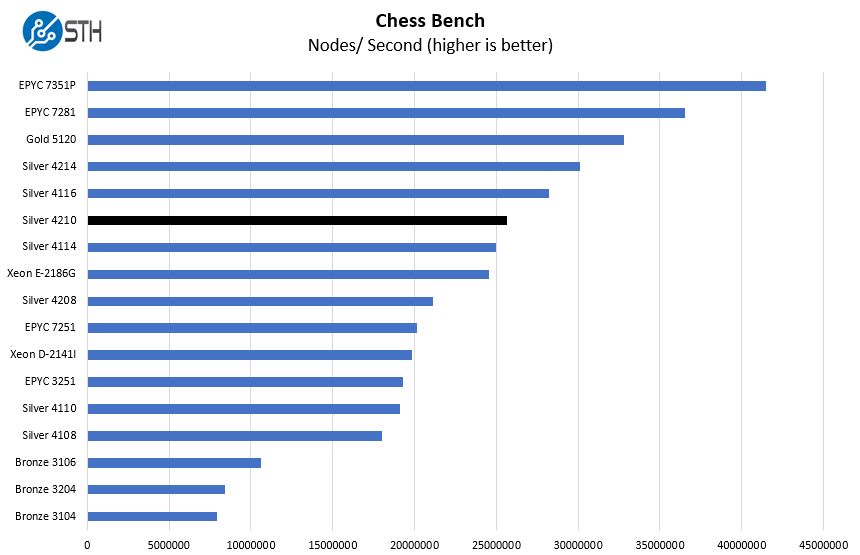
Here we see the Intel Xeon Silver 4210 perform much closer to the Intel Xeon Silver 4114, but still sees a victory. The Intel Xeon Silver 4114 is a $694 list price part or about 40% more than the Silver 4210.
Next, we are going to discuss market positioning before our final words.


