Intel Xeon Gold 6258R Performance
For this exercise, we are using our legacy Linux-Bench scripts which help us see cross-platform “least common denominator” results we have been using for years as well as several results from our updated Linux-Bench2 scripts. Starting with our 2nd Generation Intel Xeon Scalable refresh benchmarks, we are adding a number of our workload testing features to the mix as the next evolution of our platform.
At this point, our benchmarking sessions take days to run and we are generating well over a thousand data points. We are also running workloads for software companies that want to see how their software works on the latest hardware. As a result, this is a small sample of the data we are collecting and can share publicly. Our position is always that we are happy to provide some free data but we also have services to let companies run their own workloads in our lab, such as with our DemoEval service. What we do provide is an extremely controlled environment where we know every step is exactly the same and each run is done in a real-world data center, not a test bench.
We are going to show off a few results, and highlight a number of interesting data points in this article.
Python Linux 4.4.2 Kernel Compile Benchmark
This is one of the most requested benchmarks for STH over the past few years. The task was simple, we have a standard configuration file, the Linux 4.4.2 kernel from kernel.org, and make the standard auto-generated configuration utilizing every thread in the system. We are expressing results in terms of compiles per hour to make the results easier to read:
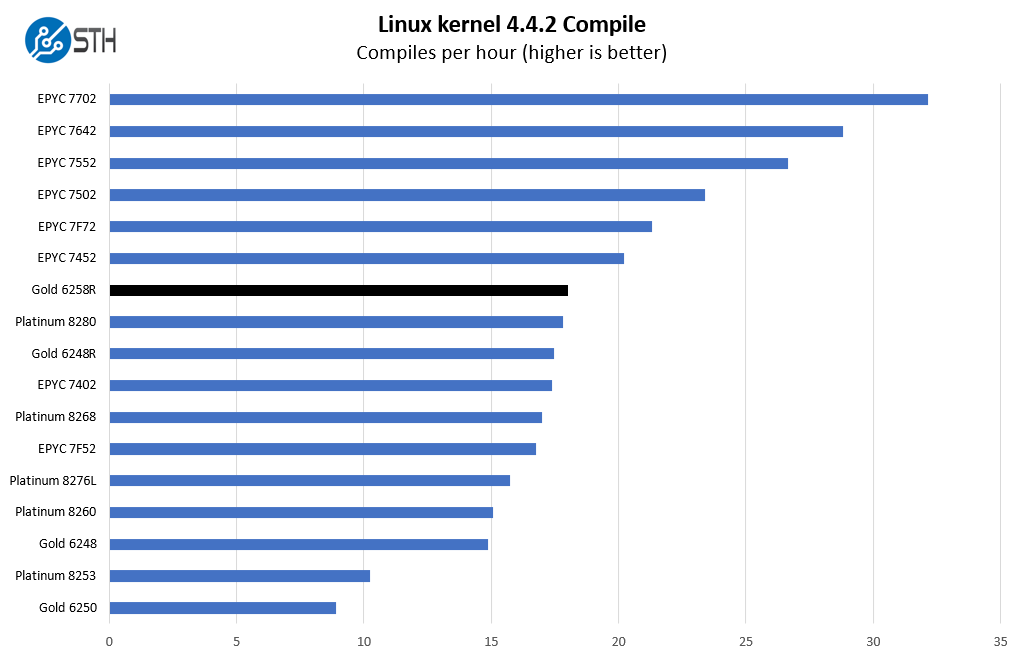
Something that we are going to follow throughout this performance section is the performance of the Xeon Gold 6258R versus the Intel Xeon Platinum 8280. The two chips are extremely close in their specs. This was perhaps the benchmark that we saw the biggest delta in terms of performance which should give you some sense of how the rest of this section is going to go.
c-ray 1.1 Performance
We have been using c-ray for our performance testing for years now. It is a ray tracing benchmark that is extremely popular to show differences in processors under multi-threaded workloads. We are going to use our 8K results which work well at this end of the performance spectrum.
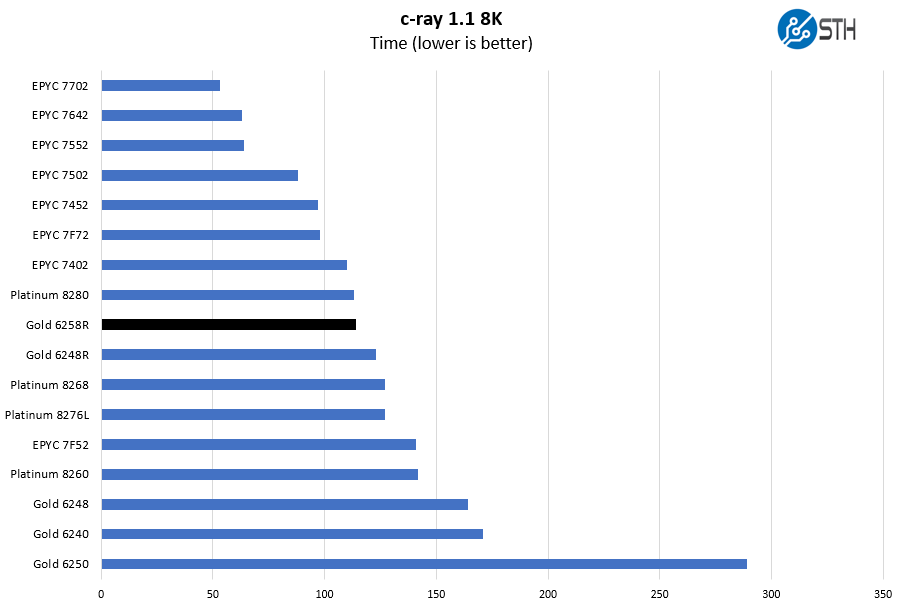
This is a benchmark that we started to use several years ago. There are architectural reasons the AMD Zen and Zen 2 chips perform extremely well here. Instead of looking at AMD versus Intel, it is best to look at Intel v. Intel here. The 28 core chips simply have more compute resources than the lower core count units which make them more desirable.
7-zip Compression Performance
7-zip is a widely used compression/ decompression program that works cross-platform. We started using the program during our early days with Windows testing. It is now part of Linux-Bench.
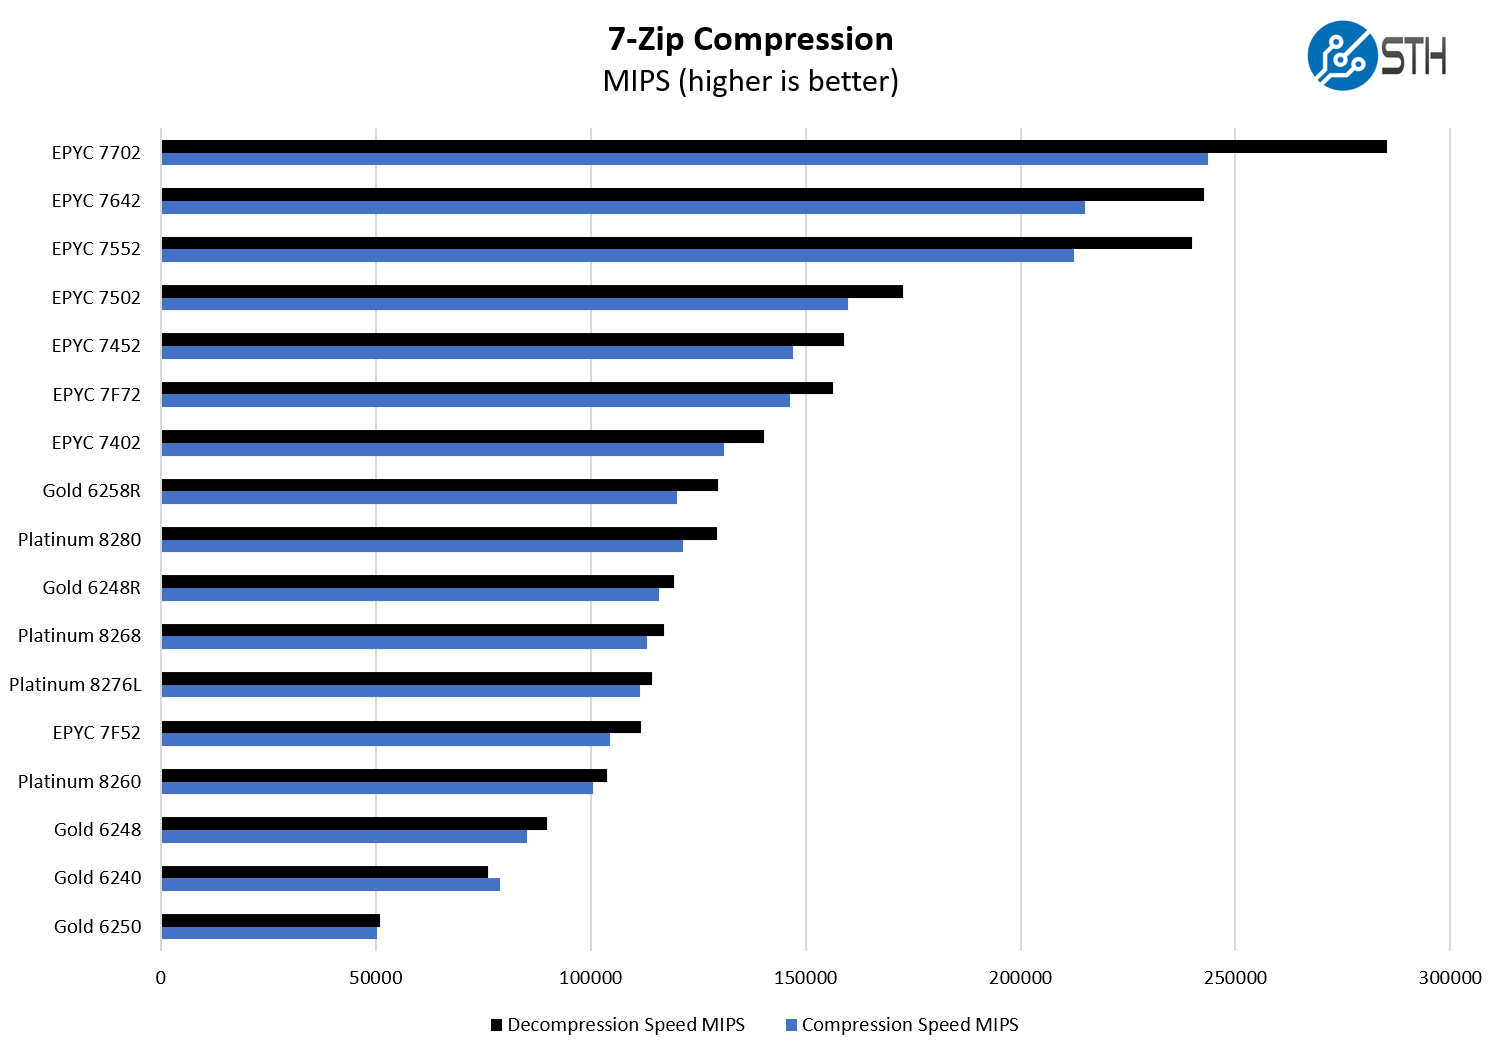
We are comparing this chip primarily to the Xeon Platinum 8280, however, we are also including results for the Platinum 8276L which offers 28 cores at a 165W TDP. Cores are not everything which is why we see the Xeon Gold 6258R perform better across these tests. We will note here that while “R” designates a refresh SKU, “L” means that the CPU is capable of larger memory capacities up to 4.5TB. Previously there was a “M” line of SKUs but those 2nd Gen Intel Xeon Scalable M SKUs are discontinued. If you need more memory, the Platinum 8276L may still be a better choice.
NAMD Performance
NAMD is a molecular modeling benchmark developed by the Theoretical and Computational Biophysics Group in the Beckman Institute for Advanced Science and Technology at the University of Illinois at Urbana-Champaign. More information on the benchmark can be found here. With GROMACS we have been working hard to support AVX-512 and AVX2 architectures. Here are the comparison results for the legacy data set:
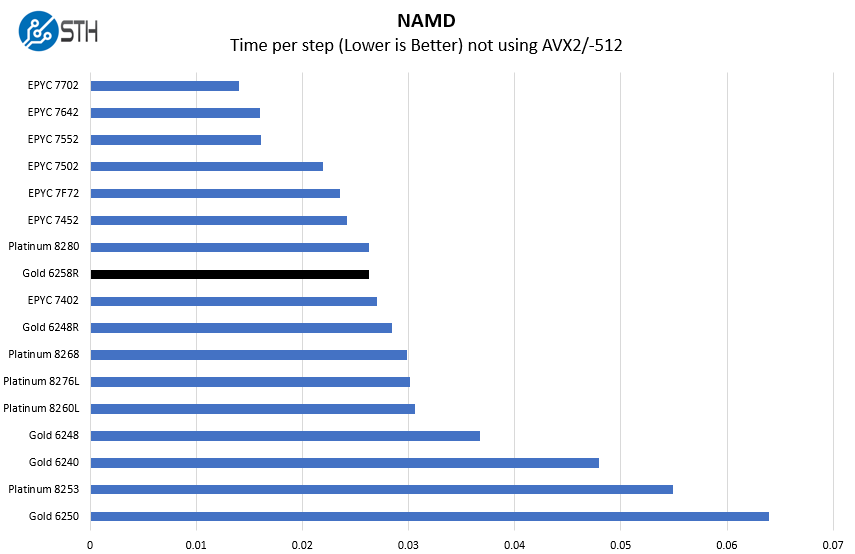
As with our c-ray test, this is another one where we saw a very slight edge for the Xeon Platinum 8280.
OpenSSL Performance
OpenSSL is widely used to secure communications between servers. This is an important protocol in many server stacks. We first look at our sign tests:

Here are the verify results:
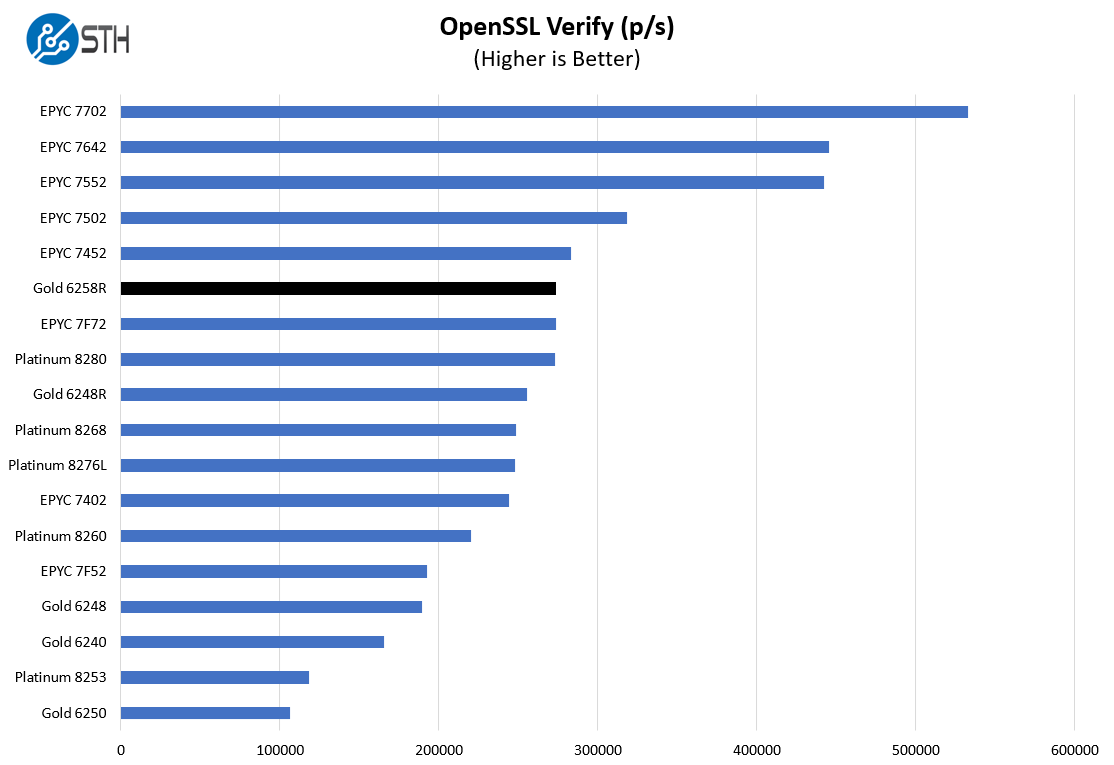
This is a workload that Intel may argue can be offloaded to QAT accelerators. Still, most architectures today do not have QAT accelerators since Intel uses this as an add-on sale either through accelerator cards or upgraded PCHs. Comparing to the AMD side, Intel still has significantly fewer cores to its detriment. While the Xeon Gold 6258R can keep up with the 24-32 core AMD EPYC offerings such as the AMD EPYC 7452 it is still doing so at a higher cost.
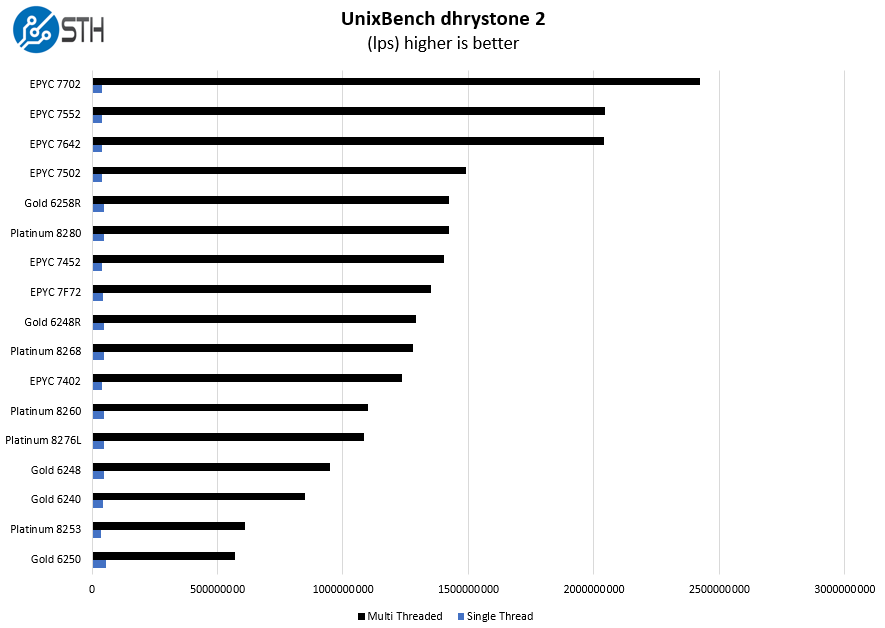
UnixBench Dhrystone 2 and Whetstone Benchmarks
Some of the longest-running tests at STH are the venerable UnixBench 5.1.3 Dhrystone 2 and Whetstone results. They are certainly aging, however, we constantly get requests for them, and many angry notes when we leave them out. UnixBench is widely used so we are including it in this data set. Here are the Dhrystone 2 results:
Here are the whetstone results:
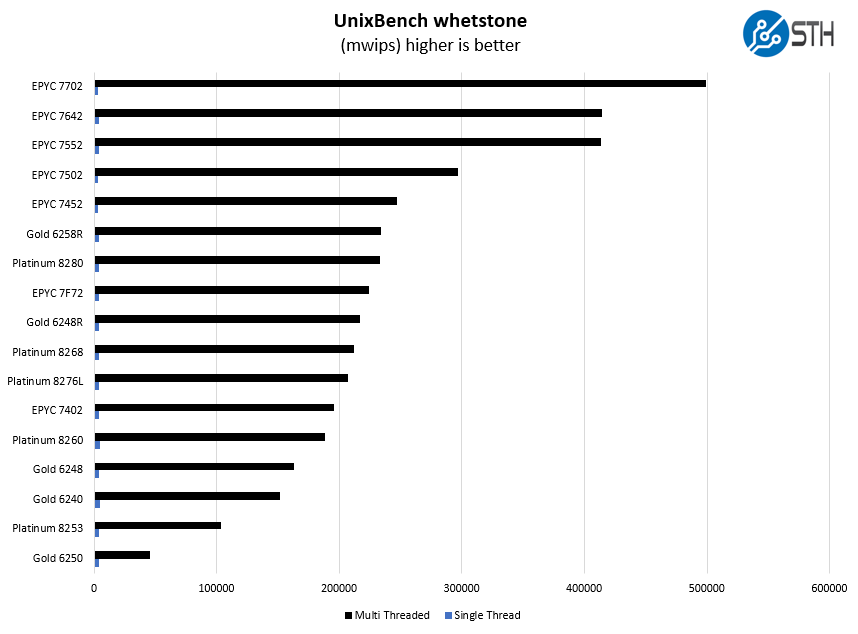
In terms of price parity, the AMD EPYC 7552 is the closest SKU to the Gold 6258R. Both chips have similar TDPs which usually means server form factors can be similar. The AMD EPYC 7552 costs around 1.9% more so one could argue it should perform better given it costs more. Sill, the performance deltas are generally well over 10x what the price delta would imply. We generally would say that makes the EPYC 7552 a better value.
Chess Benchmarking
Chess is an interesting use case since it has almost unlimited complexity. Over the years, we have received a number of requests to bring back chess benchmarking. We have been profiling systems and now use the results in our mainstream reviews:
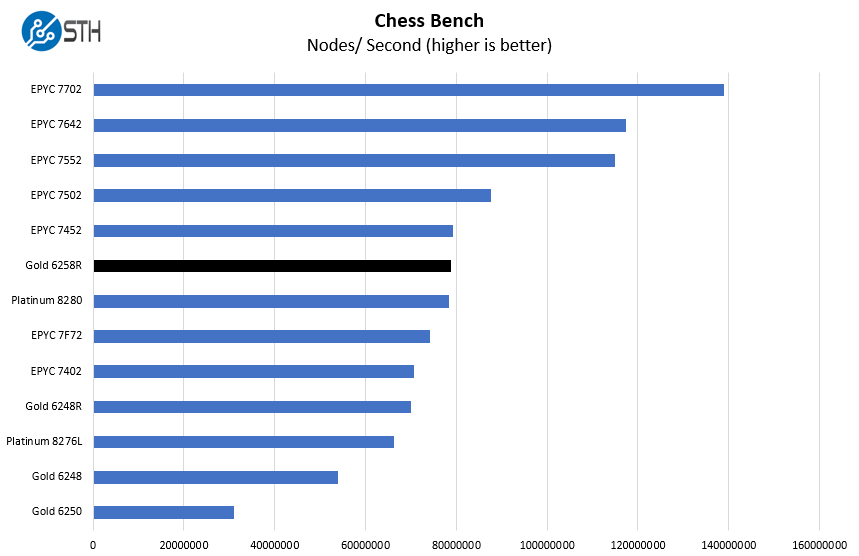
On the value side, we will mention that the Gold 6258R is around $1250 or 46.3% more than the Intel Xeon Gold 6248R 24-core part. The performance delta is generally nowhere near that. A big reason is that both chips have similar TDPs and so under heavy loads where power and thermal limiting comes into play the 24 core chip is slower, but by a smaller margin than the price tags show. In the context of a full system, the $2500 saved on a pair of CPUs may not be the biggest, however, it does explain why we see those 24 core parts as being popular.
STH STFB KVM Virtualization Testing
One of the other workloads we wanted to share is from one of our DemoEval customers. We have permission to publish the results, but the application itself being tested is closed source. This is a KVM virtualization-based workload where our client is testing how many VMs it can have online at a given time while completing work under the target SLA. Each VM is a self-contained worker.
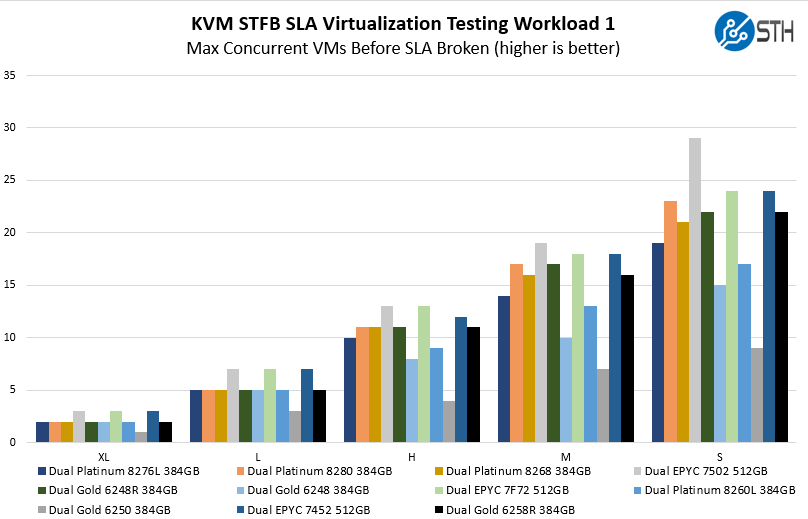
Something interesting here is that on the medium and small VM sizes the Gold 6258R was consistently slower than the Platinum 8280 here. We did a bit of testing, and it seems that this is being somewhat impacted by UPI bandwidth. The deltas are smaller in the 5-10% range of the number of VMs the chips can support before offending our SLAs not 50% like the UPI bandwidth delta.
SPECrate2017_int_base
The last benchmark we wanted to look at is SPECrate2017_int_base performance. Specifically, we wanted to show the difference between what we get with Intel Xeon icc and AMD EPYC AOCC results. Server vendors get better results than we do, but this gives you an idea of where we are at in terms of what we have seen:
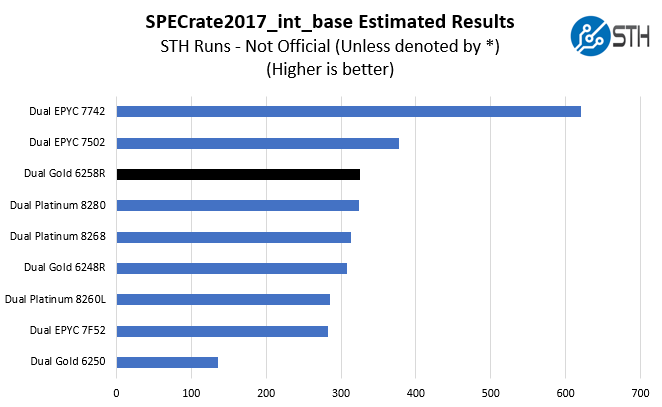
We received some comments noting we were a bit behind vendor results for some of our other tests, a fact that we noted in those reviews. Here we wanted to show both what we measured, and what server OEMs are measuring comparing the two chips. If the actual values are important for your RFP, then we suggest looking at the published results for the server(s) you are evaluating.
In either case, the Gold 6258R is very close to the Platinum 8280 which is what we have come to expect.
Next, we are going to get into the “so what” and discuss market positioning for the processor before giving our final words.


Do you by any chance have the SPECrate2017_fp numbers for this stable of CPUs which you could post or add to article? (and maybe the EPYC 7742 too?)
Would be curious what real-world numbers you get vs. tuned vendor stats. In particular with/without AVX512.
Awesome article – Thanks!
Comments are closed.