Intel Xeon Gold 6248 Benchmarks
For this exercise, we are using our legacy Linux-Bench scripts which help us see cross-platform “least common denominator” results we have been using for years as well as several results from our updated Linux-Bench2 scripts. Starting with our 2nd Generation Intel Xeon Scalable benchmarks, we are adding a number of our workload testing features to the mix as the next evolution of our platform.
At this point, our benchmarking sessions take days to run and we are generating well over a thousand data points. We are also running workloads for software companies that want to see how their software works on the latest hardware. As a result, this is a small sample of the data we are collecting and can share publicly. Our position is always that we are happy to provide some free data but we also have services to let companies run their own workloads in our lab, such as with our DemoEval service. What we do provide is an extremely controlled environment where we know every step is exactly the same and each run is done in a real-world data center, not a test bench.
We are going to show off a few results, and highlight a number of interesting data points in this article.
Python Linux 4.4.2 Kernel Compile Benchmark
This is one of the most requested benchmarks for STH over the past few years. The task was simple, we have a standard configuration file, the Linux 4.4.2 kernel from kernel.org, and make the standard auto-generated configuration utilizing every thread in the system. We are expressing results in terms of compiles per hour to make the results easier to read:
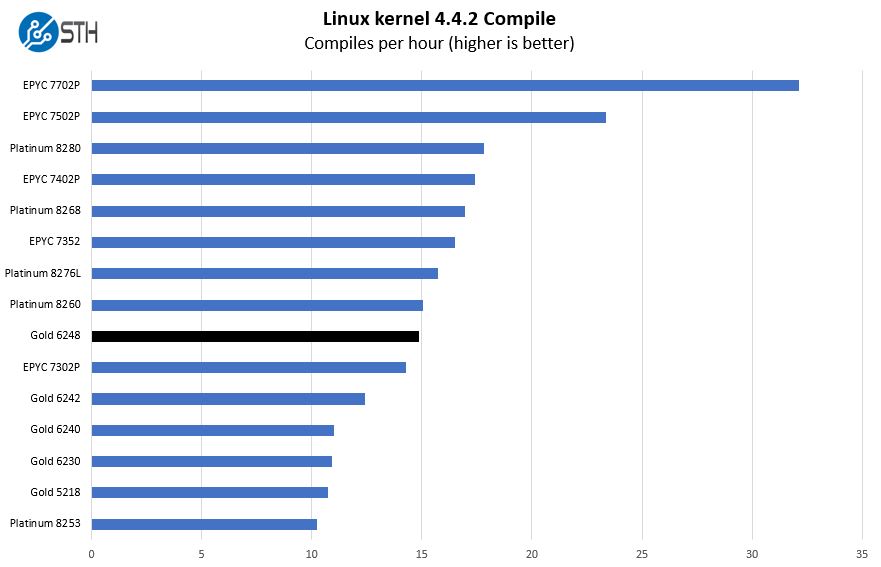
Here, we can see solid performance from the Gold 6248. The upper end of the Xeon Gold range can overlap some of the Platinum range which is what we are seeing here.
c-ray 1.1 Performance
We have been using c-ray for our performance testing for years now. It is a ray tracing benchmark that is extremely popular to show differences in processors under multi-threaded workloads. We are going to use our 8K results which work well at this end of the performance spectrum.
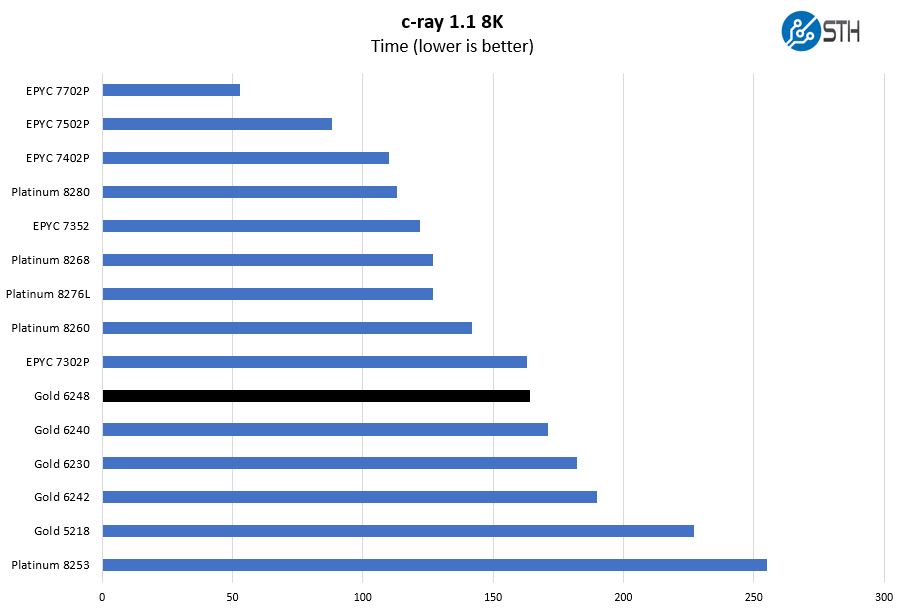
This test tends to favor AMD architectures due to caches. Here we can see the impact of that with the Xeon Gold 6248 and AMD EPYC 7302P/ 7302 having similar results.
7-zip Compression Performance
7-zip is a widely used compression/ decompression program that works cross-platform. We started using the program during our early days with Windows testing. It is now part of Linux-Bench.
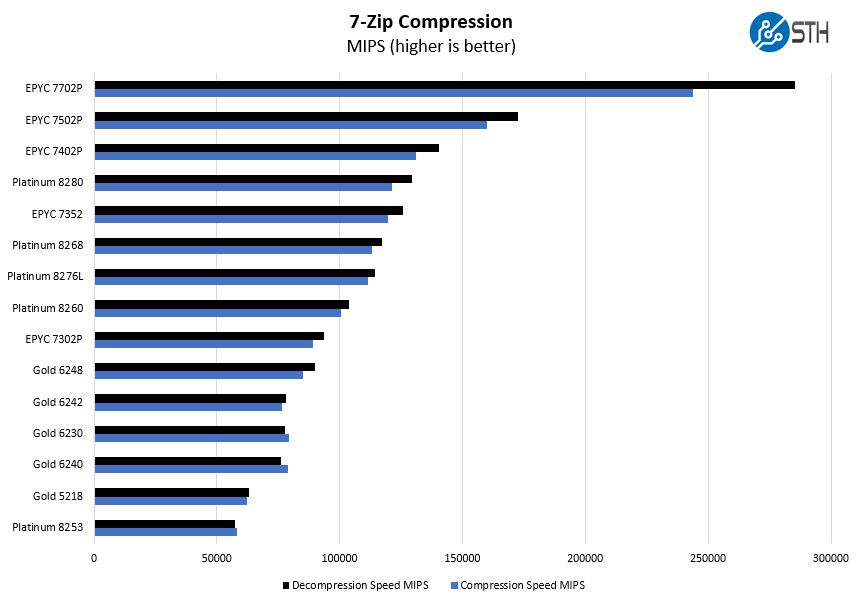
On the compression side, we see numbers just below the Intel Xeon Platinum 8260 once again. This is going to be a trend that we will see in this article.
NAMD Performance
NAMD is a molecular modeling benchmark developed by the Theoretical and Computational Biophysics Group in the Beckman Institute for Advanced Science and Technology at the University of Illinois at Urbana-Champaign. More information on the benchmark can be found here. With GROMACS we have been working hard to support AVX-512 and AVX2 architectures. Here are the comparison results for the legacy data set:
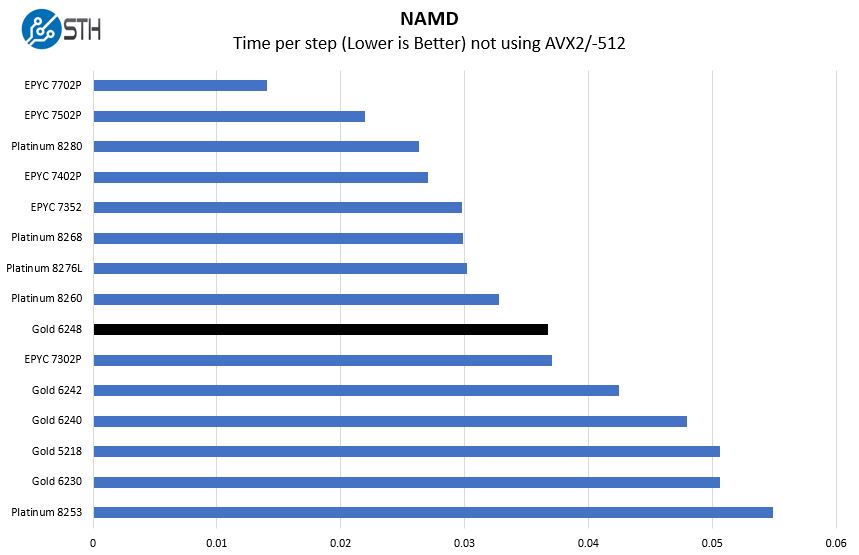
When we switch to the unoptimized NAMD size, we can see a similar trend. The Intel Xeon Gold 6242 may seem close in numbering but the Gold 6248 is far ahead.
Sysbench CPU test
Sysbench is another one of those widely used Linux benchmarks. We specifically are using the CPU test, not the OLTP test that we use for some storage testing.
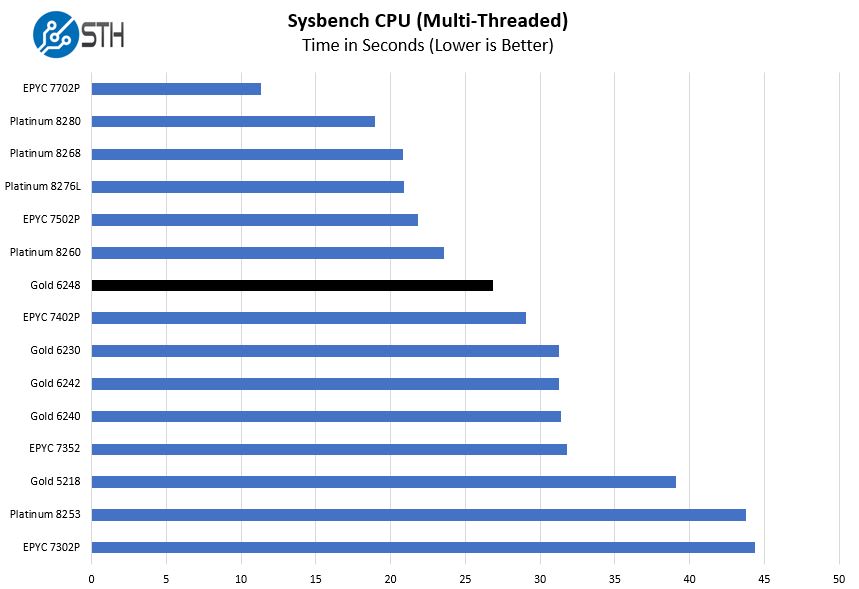
Here we see the 20 core Xeon Gold 6248 pull ahead of the 24-core AMD EPYC 7402P and by extension the dual-socket capable EPYC 7402. Intel has a clock speed advantage if AMD’s large caches do not offset that delta.
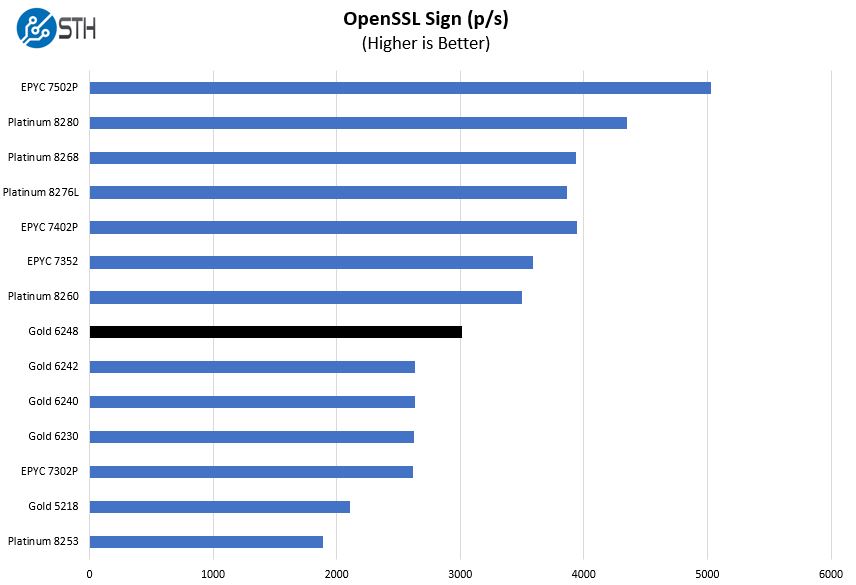
OpenSSL Performance
OpenSSL is widely used to secure communications between servers. This is an important protocol in many server stacks. We first look at our sign tests:
Here are the verify results:
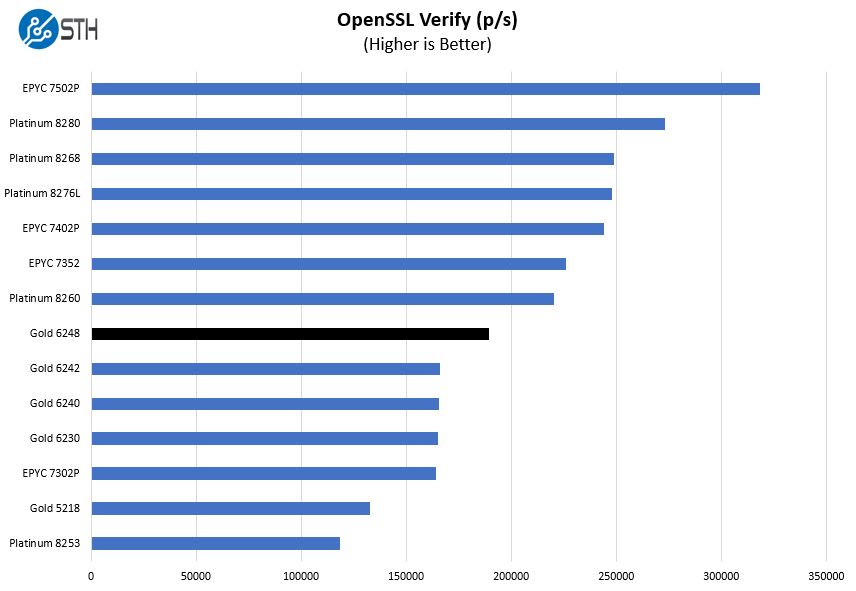
OpenSSL is a foundational technology of today’s IT infrastructure. Again we see this as a major departure from the lower-end Xeon Gold CPUs.
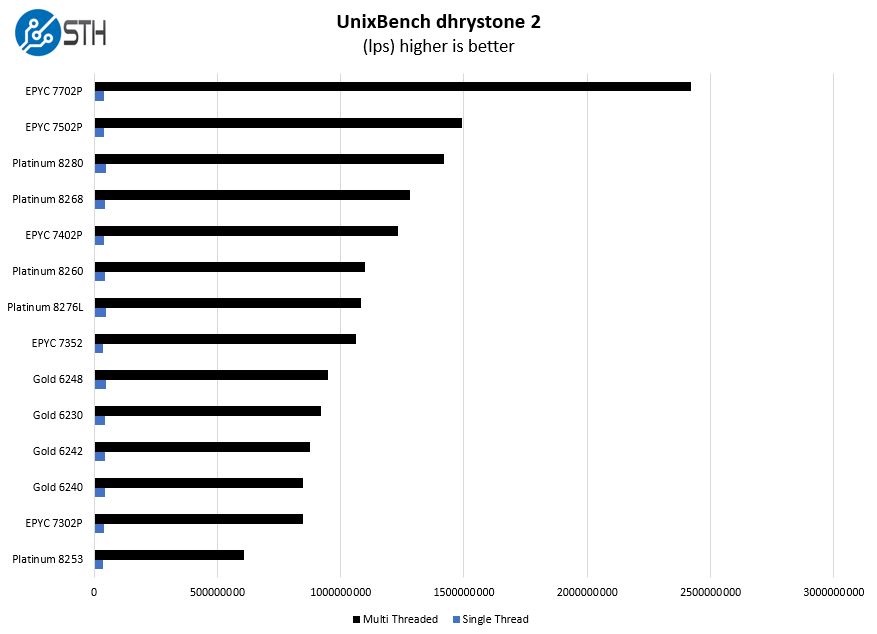
UnixBench Dhrystone 2 and Whetstone Benchmarks
Some of the longest-running tests at STH are the venerable UnixBench 5.1.3 Dhrystone 2 and Whetstone results. They are certainly aging, however, we constantly get requests for them, and many angry notes when we leave them out. UnixBench is widely used so we are including it in this data set. Here are the Dhrystone 2 results:
Here are the whetstone results:
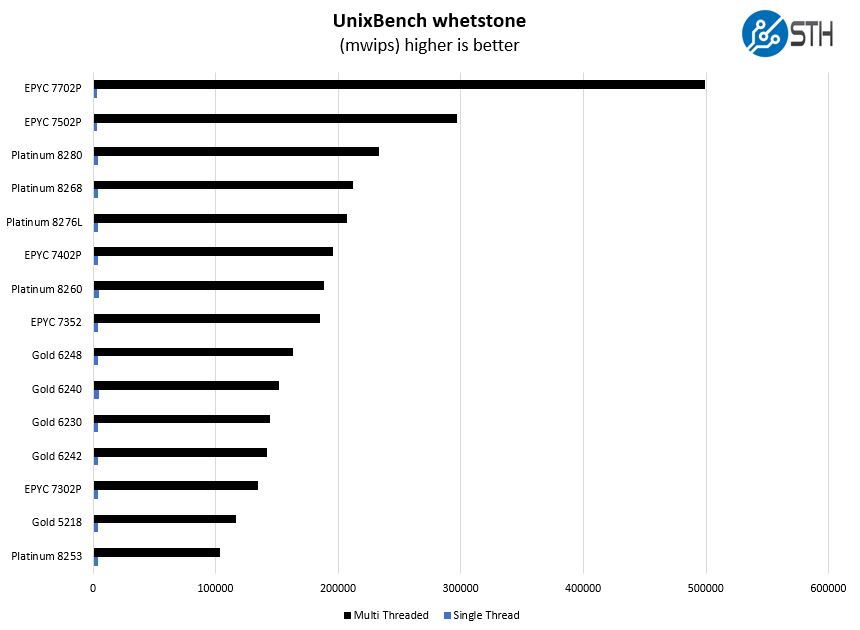
Here we wanted to quickly point out again that the Intel Xeon Gold 6240 may seem close as a 624x SKU, however, the Xeon Gold 6248 is significantly faster across our test suite.
GROMACS STH Medium AVX2/ AVX-512 Enabled
We have a small GROMACS molecule simulation we previewed in the first AMD EPYC 7601 Linux benchmarks piece. In Linux-Bench2 we are using our “small” case which is appropriate for single-socket servers. Our GROMACS test will use the AVX-512 and AVX2 extensions if available.
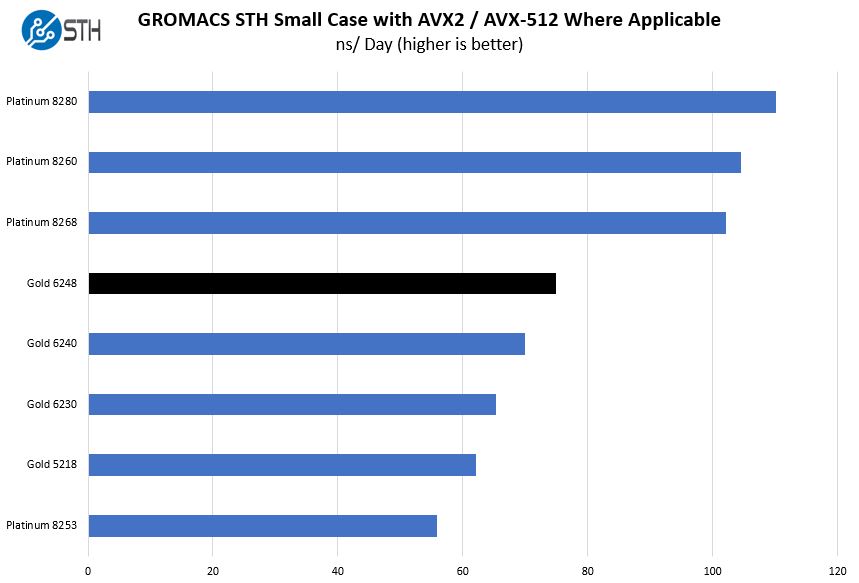
With some of the AVX-512 enhancements the Intel Xeon Gold 5200 has seen in this generation, those parts are now performing better than in the first generation on this test. Still, Intel CPUs tend to get TDP or power limited on this test.
Chess Benchmarking
Chess is an interesting use case since it has almost unlimited complexity. Over the years, we have received a number of requests to bring back chess benchmarking. We have been profiling systems and now use the results in our mainstream reviews:
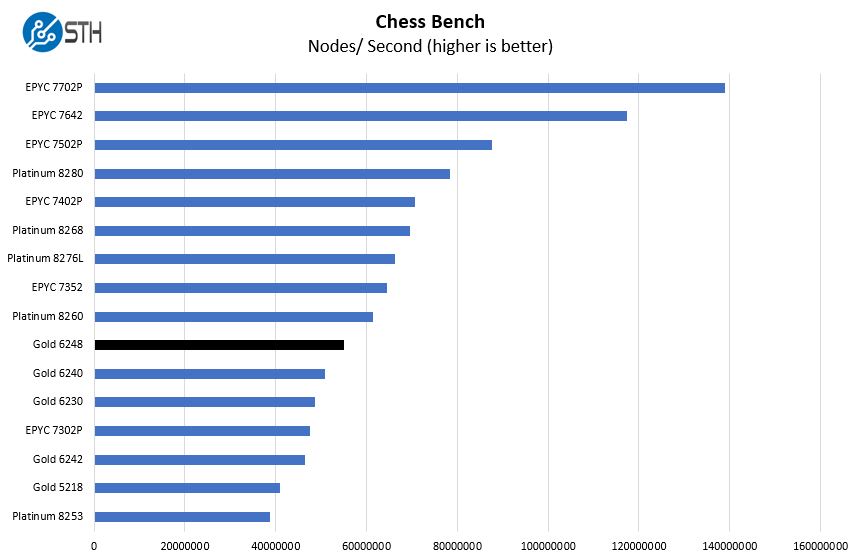
We again see the performance at the top of our Xeon Gold results and just behind the Xeon Platinum results. If you wanted to gauge Intel Xeon Gold 6252 performance, you could use the Xeon Platinum 8260 numbers to give some relative delta that would be similar here.
Next, we are going to discuss market positioning before our final words.


That chart is great for those who need to look into getting Xeons for some reason, thanks!
I’ll stick with Rome though!
High speed 10 years ago. Intel is getting is lunch eaten by amd.
Comments are closed.