Inland TD510 2TB Performance Testing
We test using both the default smaller test size as well as larger test sets on our benchmarks. This allows us to see the difference between lighter and heavier workloads.
CrystalDiskMark x64
CrystalDiskMark is used as a basic starting point for benchmarks as it is something commonly run by end-users as a sanity check.
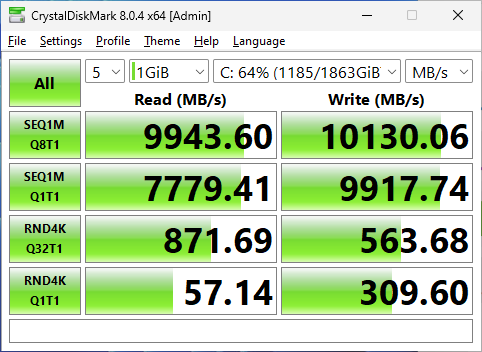
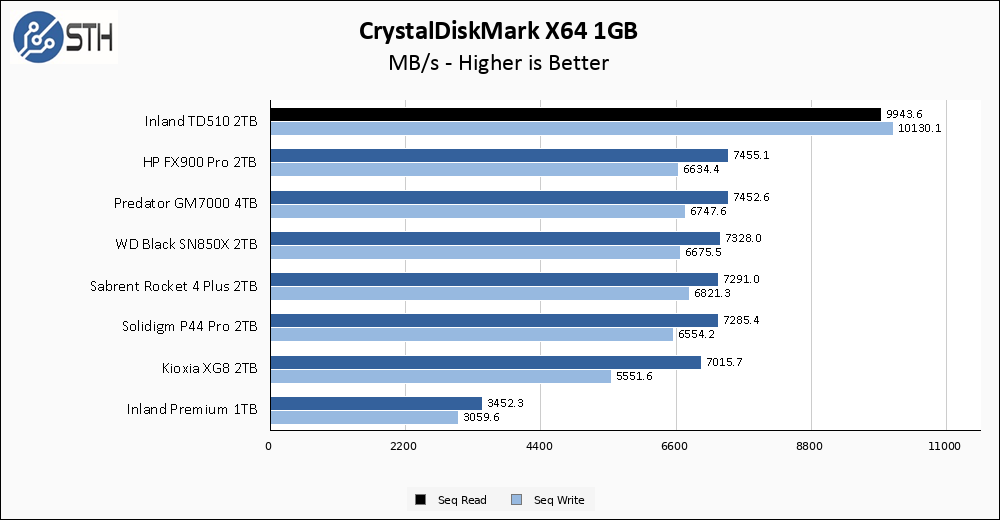
Right out of the gate, the Inland TD510 2TB stretches its legs for sequential read and write performance and takes a commanding lead over any other drive in my test database. Read performance very nearly nails the 10000MB/s rating, while write performance overperforms and comes in around 600MB/s over the rating.
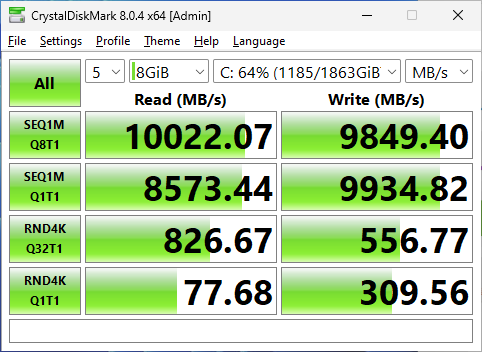
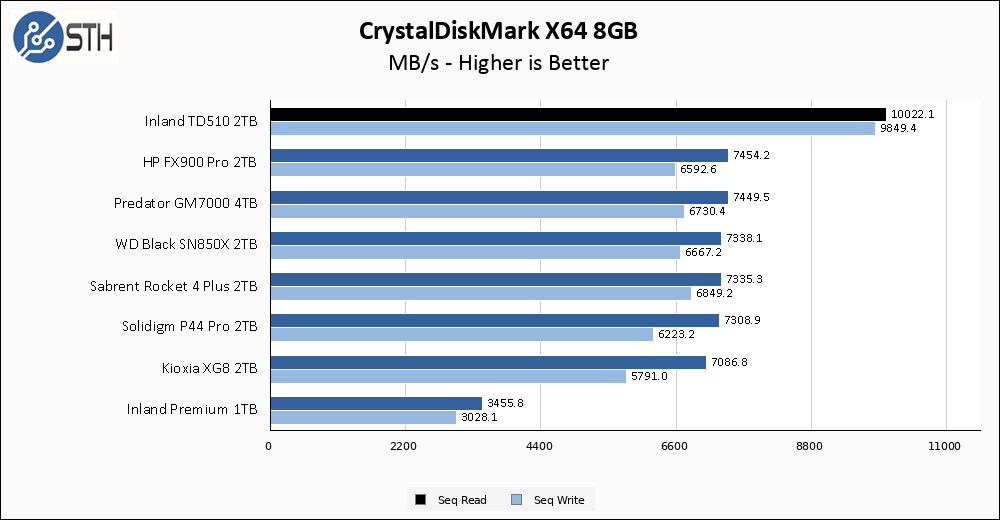
The larger CrystalDiskMark test is a breeze for the TD510, which owing to its Gen5 interface sits alone at the top of my chart.
ATTO Disk Benchmark
The ATTO Disk Benchmark has been a staple of drive sequential performance testing for years. ATTO was tested at both 256MB and 8GB file sizes.
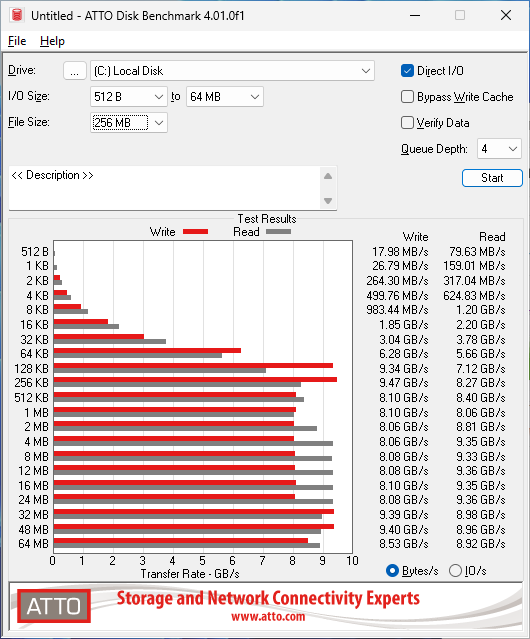
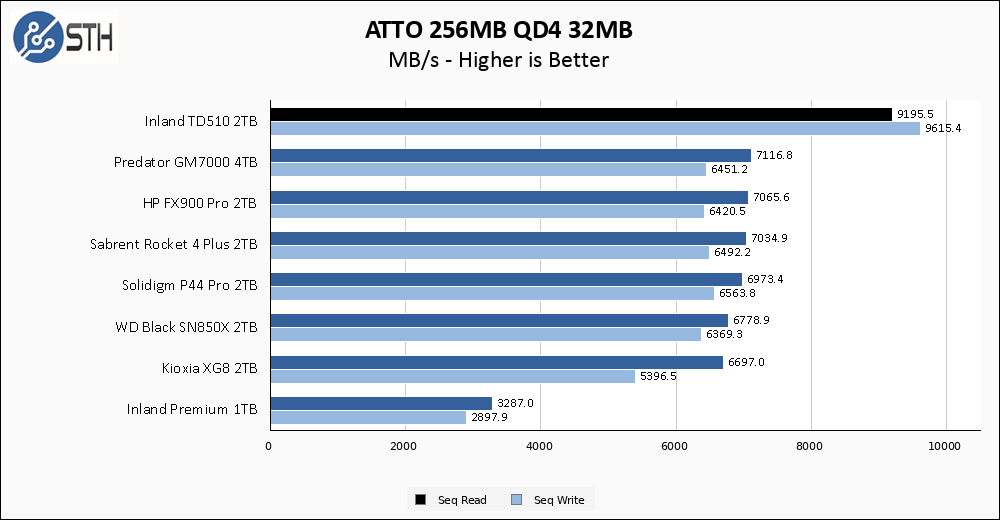
ATTO results are slightly more interesting for the TD510. Long-time readers may know that I take my data point from the 32MB file chunk result, and on the vast majority of drives I test performance tends to level out around the 4MB or 8MB chunk size and hold steady through the rest of the testing. The TD510 bucks that trend, with a sudden jump in performance when moving from 24MB to 32MB. Even without the jump the TD510 would still have topped this chart, but with that little jump, the lead looks all the more commanding.
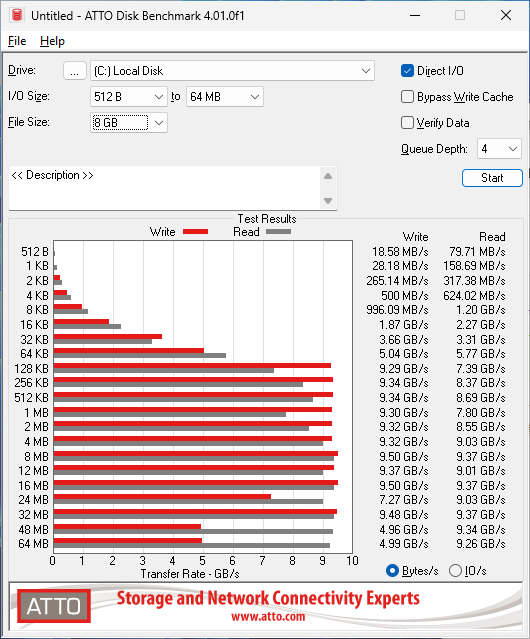
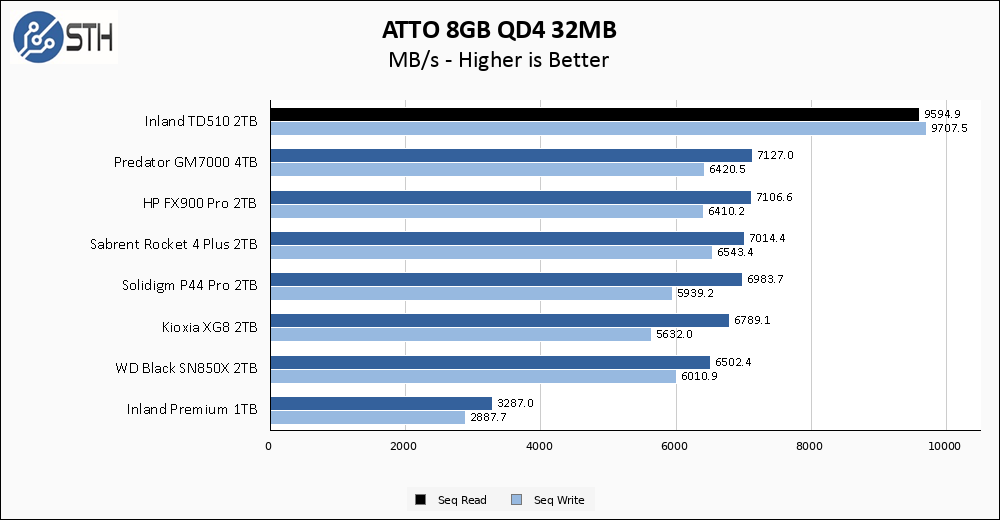
The larger ATTO test, however, shows a lot more variability in performance. Once again, I take my results at the 32MB line where the TD510 turns in a grand performance, but there is a lot more variability in write performance across the duration of this benchmark that is worthy of note.
Anvil’s Storage Utilities
Anvil’s Storage Utilities is a comprehensive benchmark that gives us a very in-depth look at the performance of the drives tested. This benchmark was run with both a 1GB and 8GB test size.
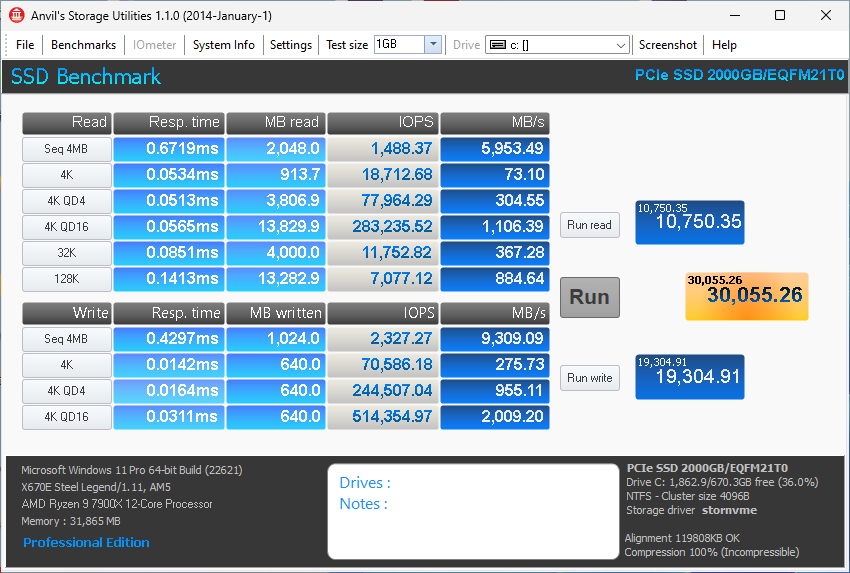
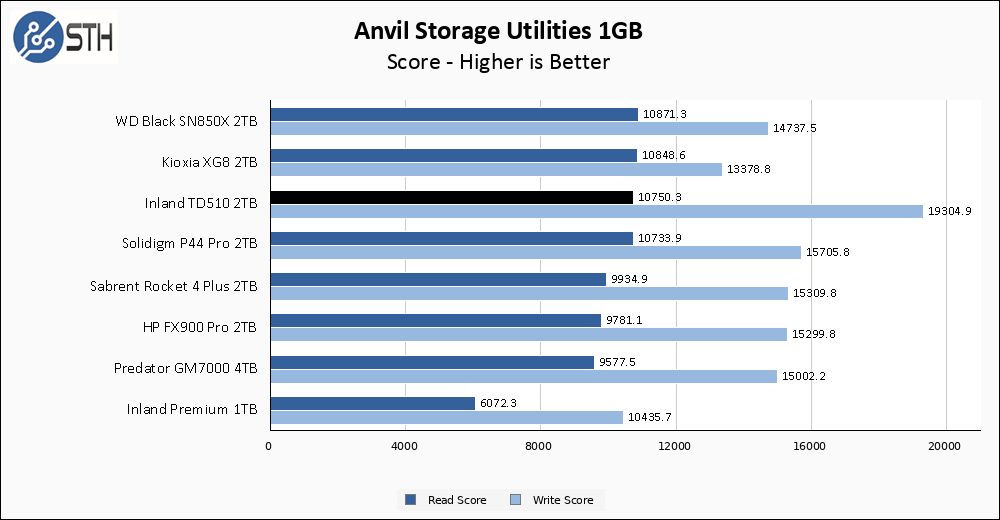
Anvil is my first test where the results I observe are not strictly based on sequential performance, and as a result the read score on the TD510 no longer puts it first place on my graph. Performance is still great, but the overall read score is in line with top-end Gen4 drives rather than blowing them out of the water. Read score, on the other hand, still shows the TD510 to hold a massive lead over competing drives.
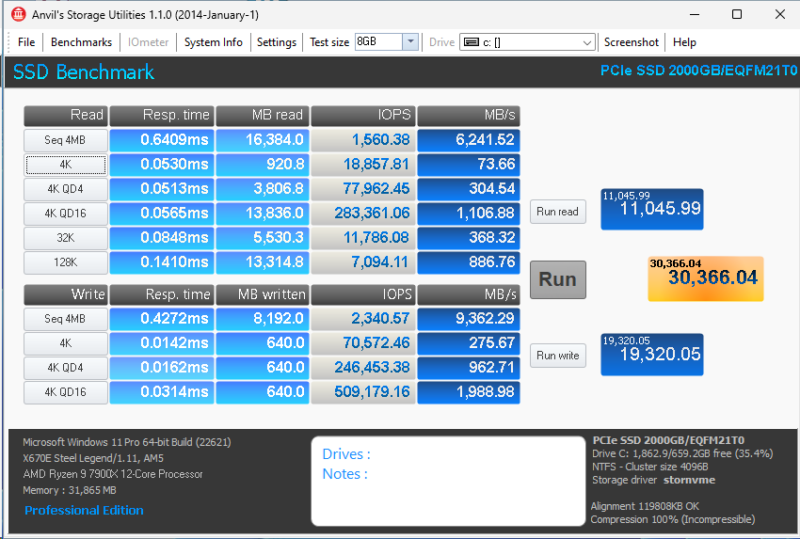
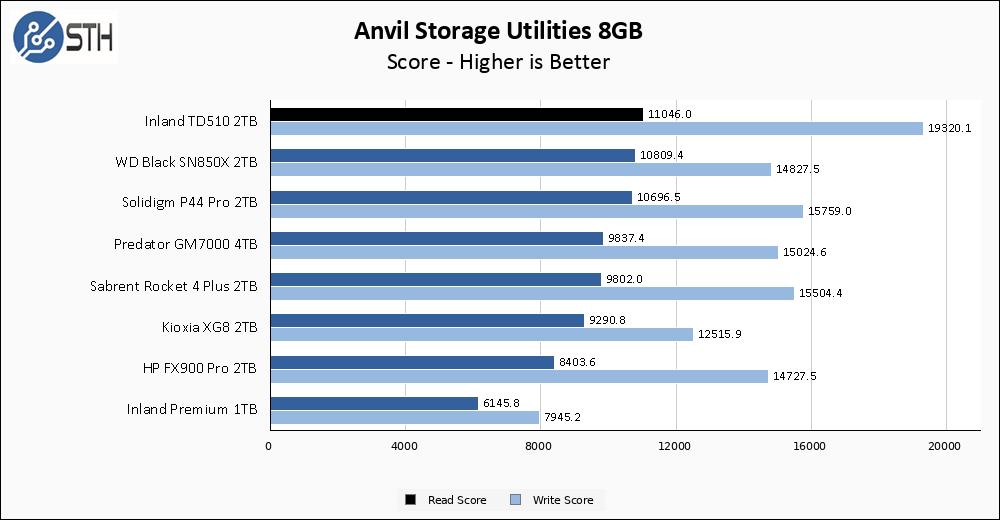
The larger Anvil test has the TD510 tells a nearly identical story to the smaller test set. Here the TD510 shows a read performance that tops the charts by just a hair versus the previous generation drives, but write score is again miles ahead of the competition.
AS SSD Benchmark
AS SSD Benchmark is another good benchmark for testing SSDs. We run all three tests for our series. Like other utilities, it was run with both the default 1GB as well as a larger 10GB test set.
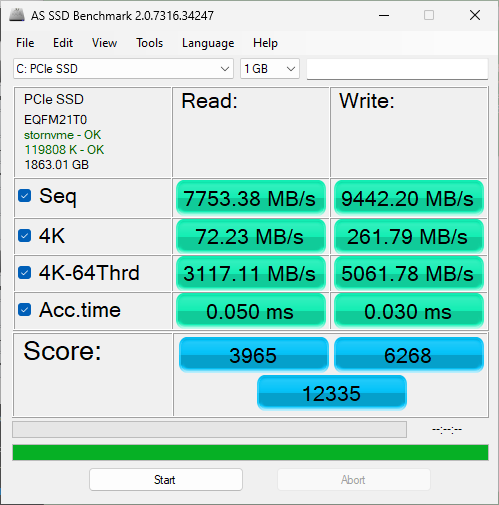
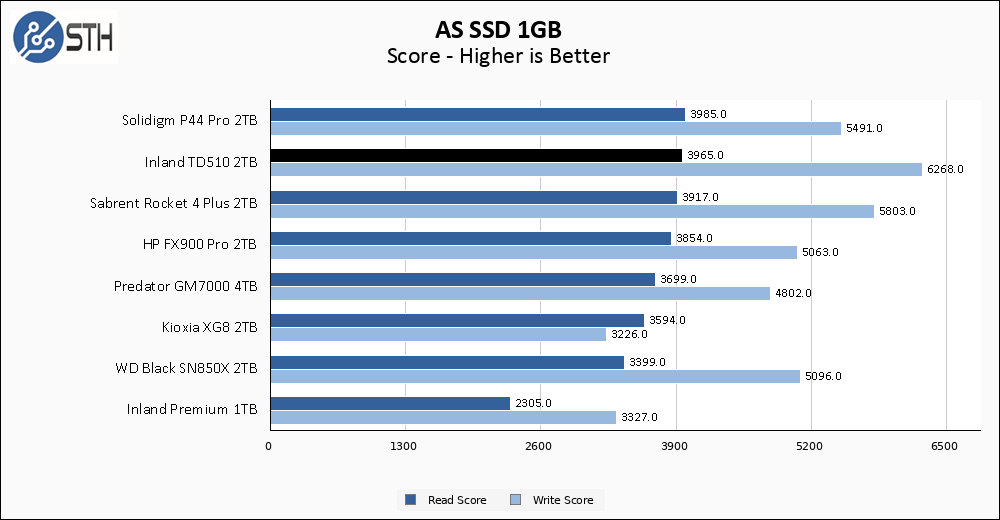
AS SSD results are much more similar to Anvil; the TD510 read performance is good, but its write performance is chart-topping. Highly threaded 4K random read performance on the TD510 seems to be very similar to Gen4 drives, with very similar access latency as well. Since AS SSD does not overly weight sequential performance compared to the other metrics, the Inland drive does not win this test for read score. On the other hand, write score is once again the best I have seen, though in this case not by quite as large a margin as we saw in Anvil.
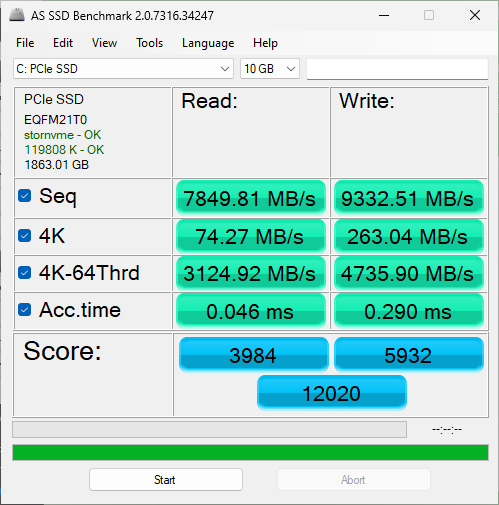
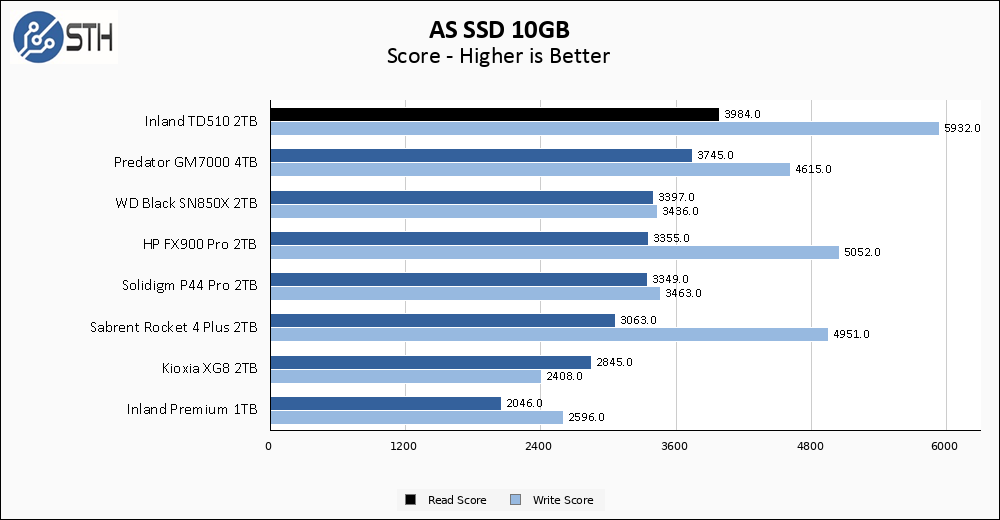
The larger AS SSD lets the TD510 stretch its legs, as it barely loses a step in the scoring. Compared to the other drives in my test set, which take a relatively larger performance hit with the larger test set, the TD510 once again finds itself at the top of my chart.
SPECworkstation, thermals, and our conclusion are up next.


It’s nice to see PCIe 5 SSD reviews here (looks like STH didn’t receive a Crucial T700 review unit).
The fan looks annoying and this power consumption necessitating a big heatsink makes me wonder:
Will we see fast PCIe 5 SSDs in laptops in the near future or are we hitting some kind of limit?
@Lasertoe it seems like that will be more up to the NAND side than anything else: 10-15w isn’t crazy power; but it’s enough that you probably can’t just give the m.2 slot a thermal pad and some chassis contact and call it good; and having to go with a more substantial heat spreader or an additional heatpipe running to the main heatsink is going to mean more cost and complexity, a bit more weight, and less convenient service.
Absolutely doable, generations of 13-15in laptops have had versions with or without a low end discrete GPU(like an MX450 or similar) with just a slightly different heatpipe assembly, no externally visible chassis changes) at TDPs of up to 30w or so; but enough disadvantages that you’d need to want it.
Current benchmarks of PCIe5 drives(at least the affordable ones in 2280 or 22110 sizes) just don’t seem to make a convincing case for going to that trouble: synthetic tests of how fast you can fill the cache show the additional bus speed; but sustained performance looks very, very, much like a PCIe4 drive.
Very interesting. Would have loved to see it compared to a high end Optane drive. Pitty there will never be a PCI 5.0 x4 Optane drive. As far as I know they still have the best access times and don’t slow down when the DRAM gets full like with NAND based SSDs.
Much like first-generation PCIe Gen4 drives, this rated performance does not fully max out an x4 interface in a Gen5 system, but it still represents a sizeable improvement in sequential performance over the very best that a Gen4 drive could offer.
https://www.servethehome.com/inland-td510-2tb-pcie-gen5-nvme-ssd-review/
Comments are closed.