Crucial P1 1TB Performance Testing
We are moving towards using larger test sizes on our benchmarks, but on several tests, we also used the smaller default-test sizes. This allows us to see the difference between lighter and heavier workloads.
CrystalDiskMark 7.0.0 x64
CrystalDiskMark is used as a basic starting point for benchmarks as it is something commonly run by end-users as a sanity check.
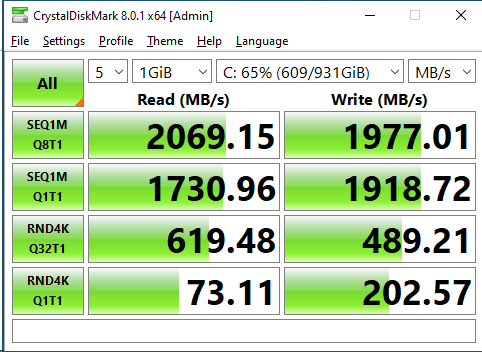
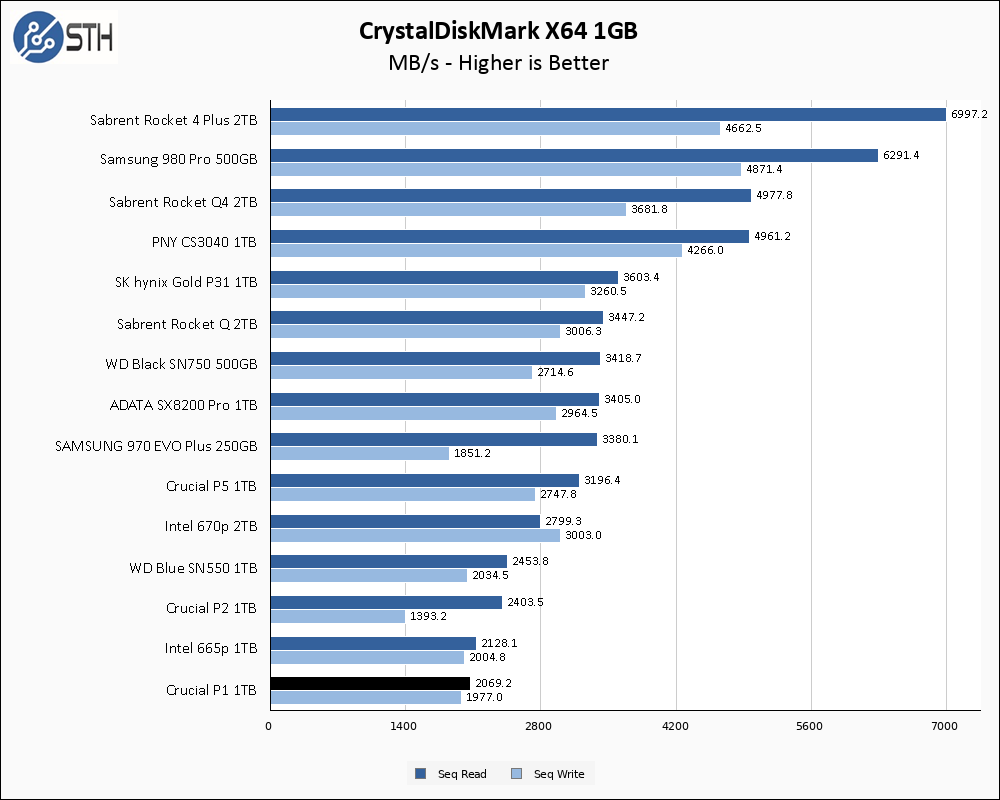
Right out the gate, the positioning of the Crucial P1 is near the bottom of our charts. This is to be expected given the modest rated performance numbers, and to the P1’s credit, it manages to exceed the advertised read and write specs. Of particular note is how much better the P1 performed on writes compared to the P2; that will be a recurring theme. Also worthy of note is the similarity to the Intel 665p 1TB, which is another QLC drive based on the SM2263EN.
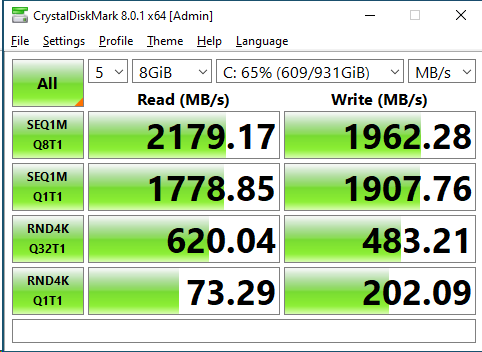
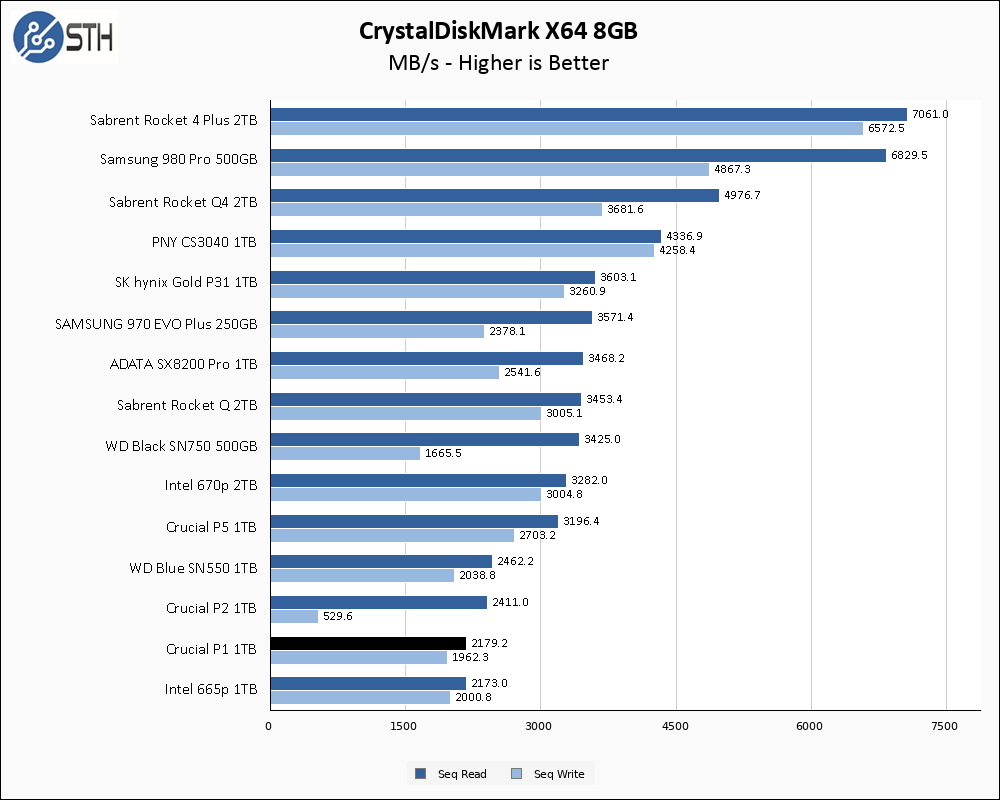
Moving to the larger 8GB, the P1 holds completely steady with its performance. This is in contrast to the Crucial P2, which fell to SATA territory when it comes to write performance. There is an impact to the DRAM-less drive trend and that is on display looking at the P1 and P2 drives here. Also, the P1 and Intel’s 665p are essentially in lockstep for performance, which is perhaps to be expected.
ATTO Disk Benchmark
The ATTO Disk Benchmark has been a staple of drive sequential performance testing for years. ATTO was tested at both 256MB and 8GB file sizes.
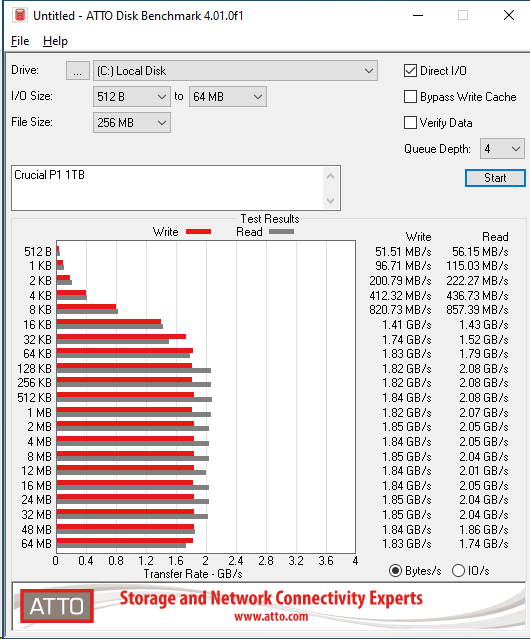
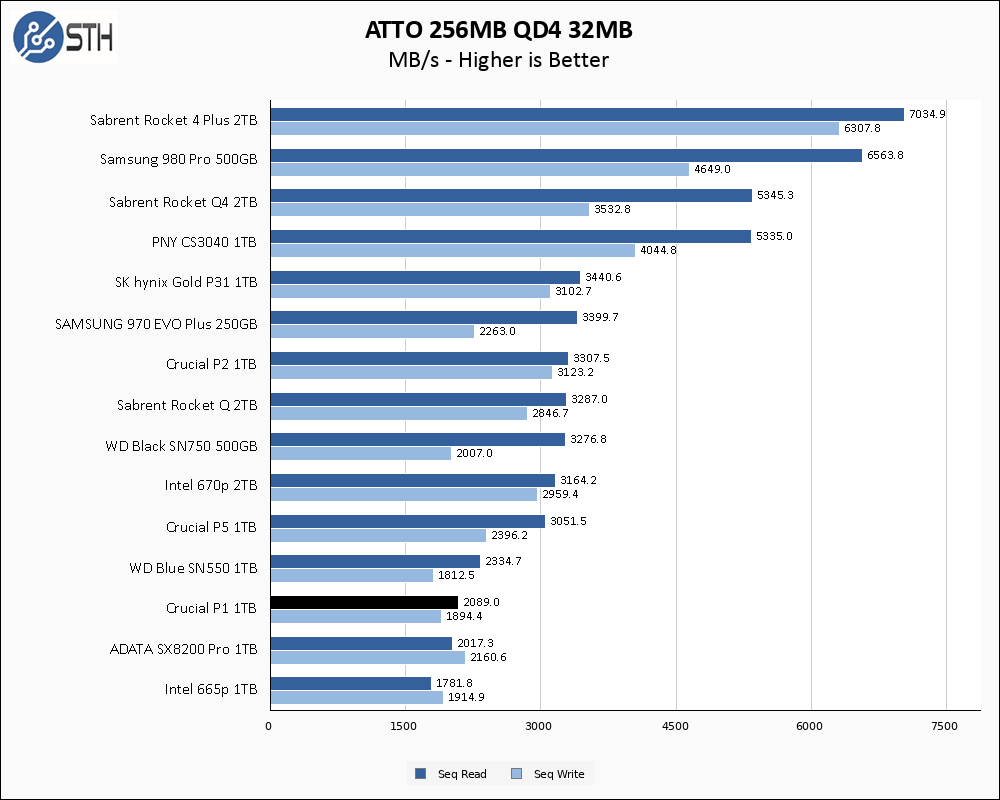
Performance in ATTO is a mirror of CrystalDiskMark; the Crucial P1 1TB is slightly exceeding its own rated read and write performance specifications. The Crucial P2 significantly overperformed in this benchmark, leaving the P1 behind. On the other hand, the P1 manages to put distance between itself and the nearly identical Intel 665p here, at least in terms of read performance.

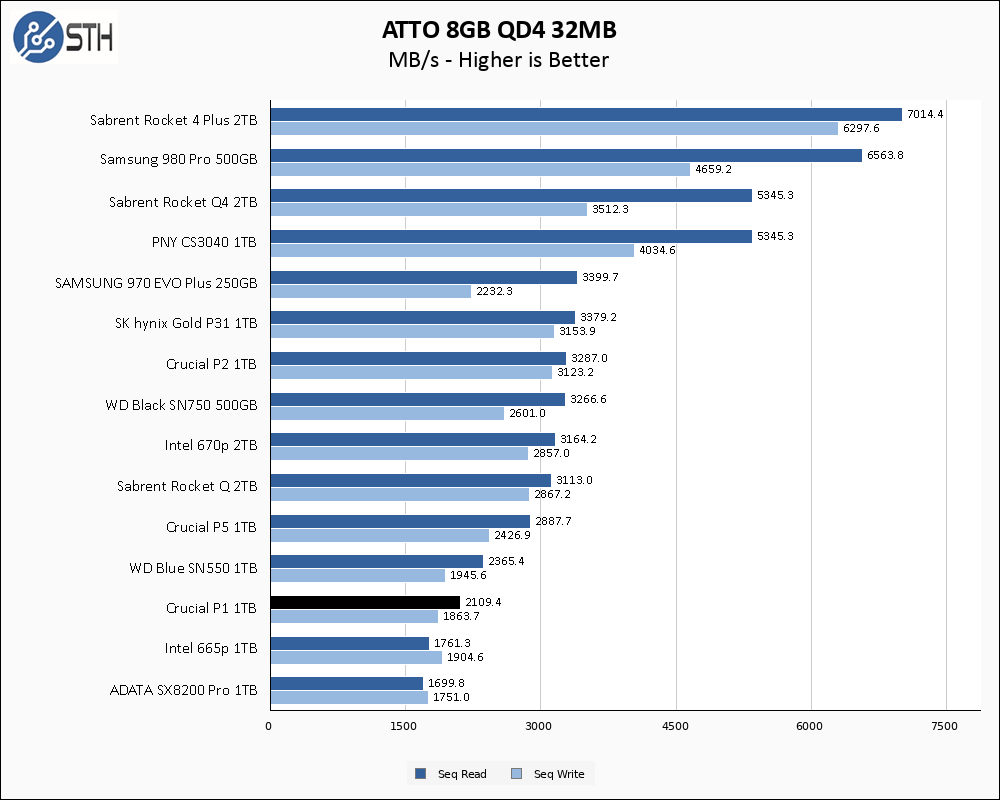
The larger test has no effect on the Crucial P1 1TB, and it continues to outperform its own specs. It also continues to hang onto a lead compared to the Intel drive.
Anvil’s Storage Utilities
Anvil’s Storage Utilities is a comprehensive benchmark that gives us a very in-depth look at the performance of drives tested. This benchmark was run with both a 1GB and 8GB test size.
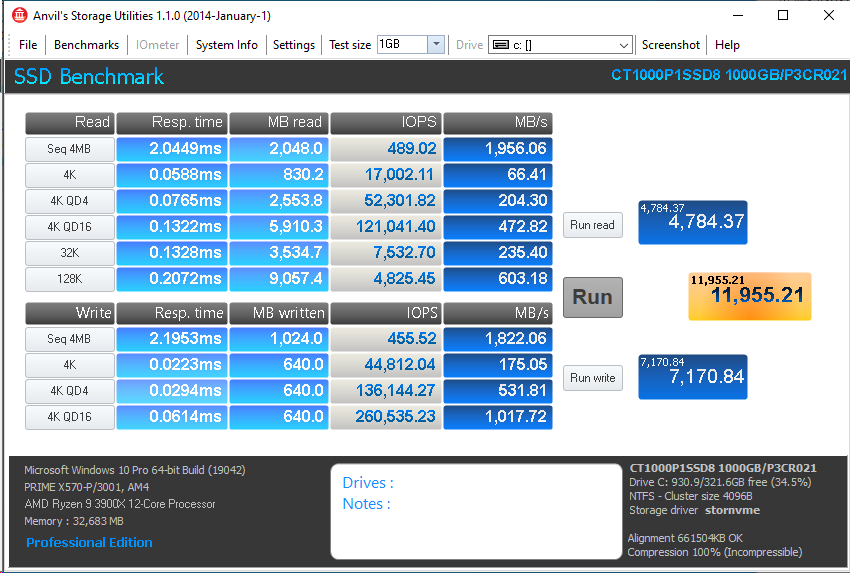
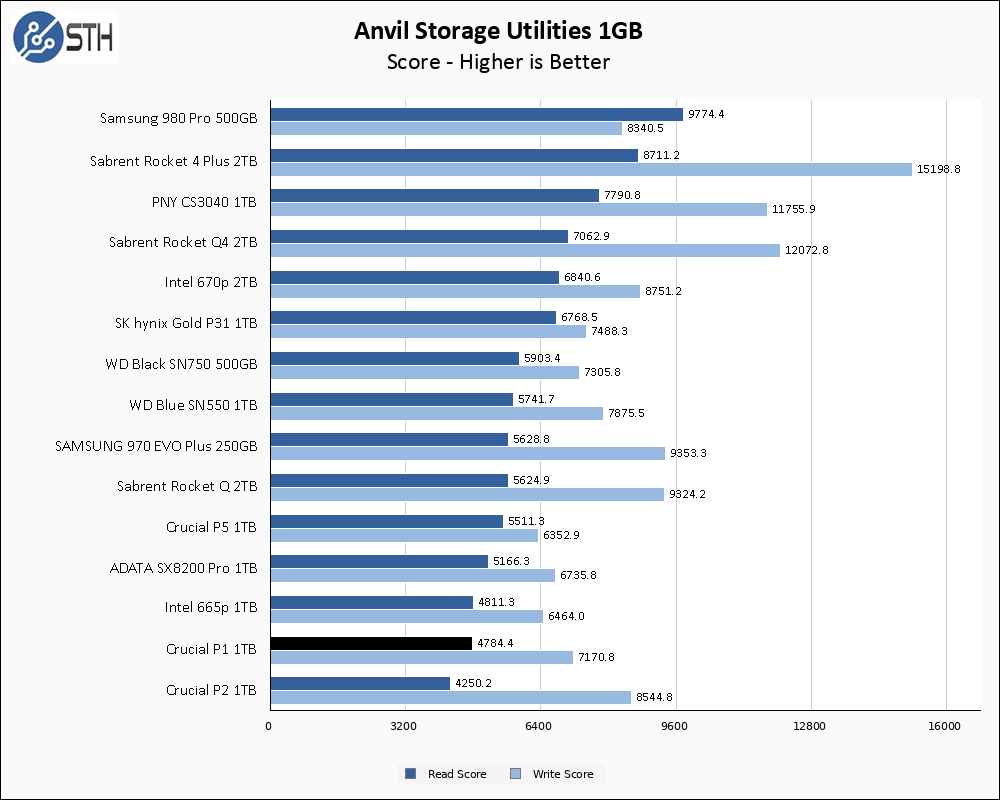
In Anvil, the P1 continues to slightly outpace the Intel 665p. More interestingly, read performance takes a lead over the P2.
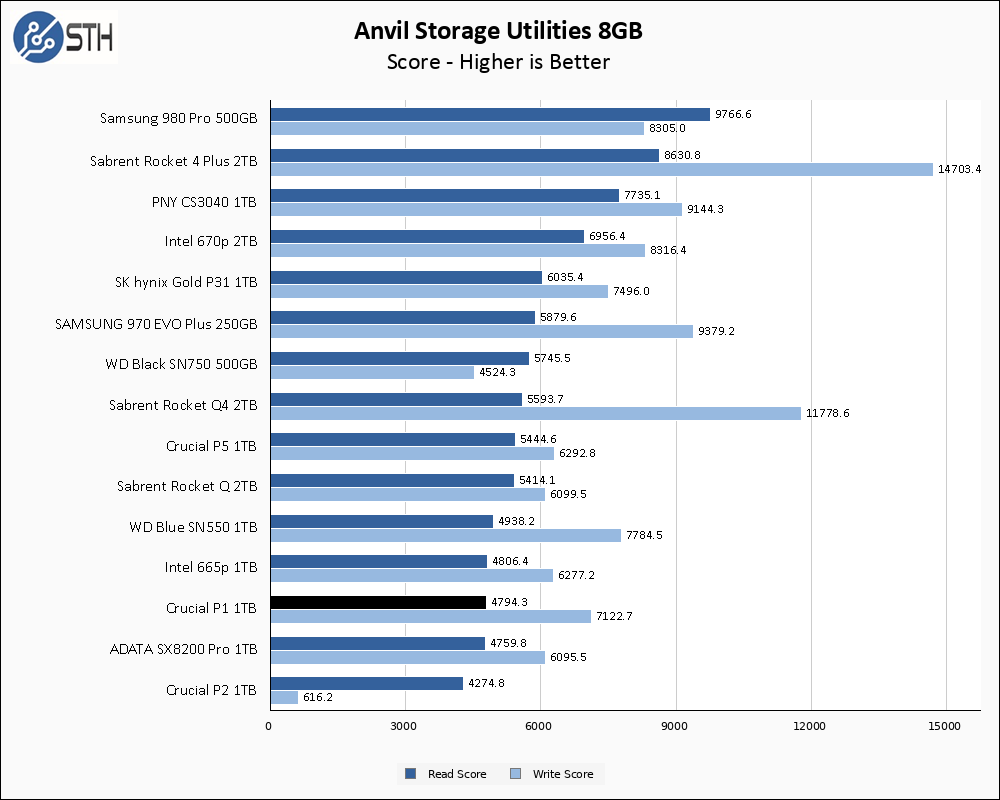
The performance between the 1GB and 8GB Anvil tests were so close to each other, I felt the need to double-check and make sure I had not made a mistake recording the data. That is certainly a positive in the P1’s favor. In addition, the P1 write performance does not crater like the P2 does.
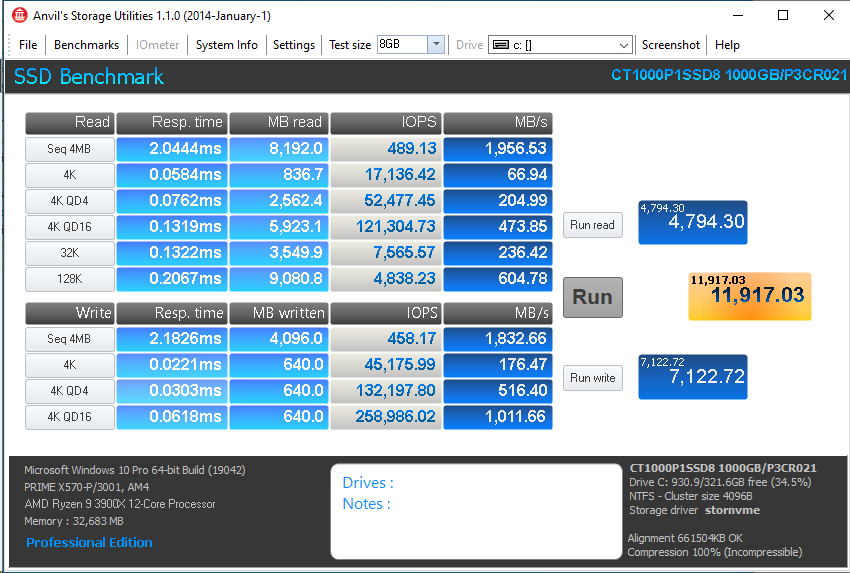
AS SSD Benchmark
AS SSD Benchmark is another good benchmark for testing SSDs. We run all three tests for our series. Like other utilities, it was run with both the default 1GB as well as a larger 10GB test set.
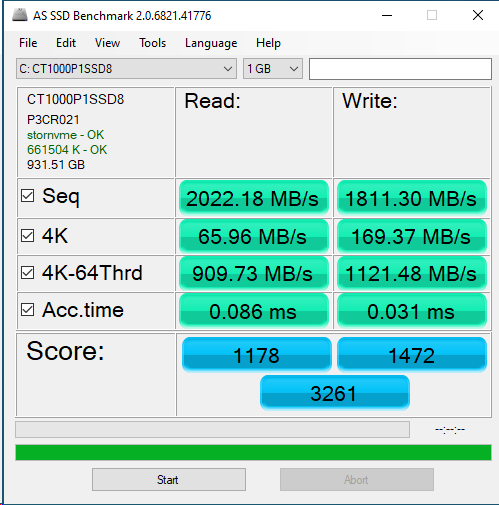
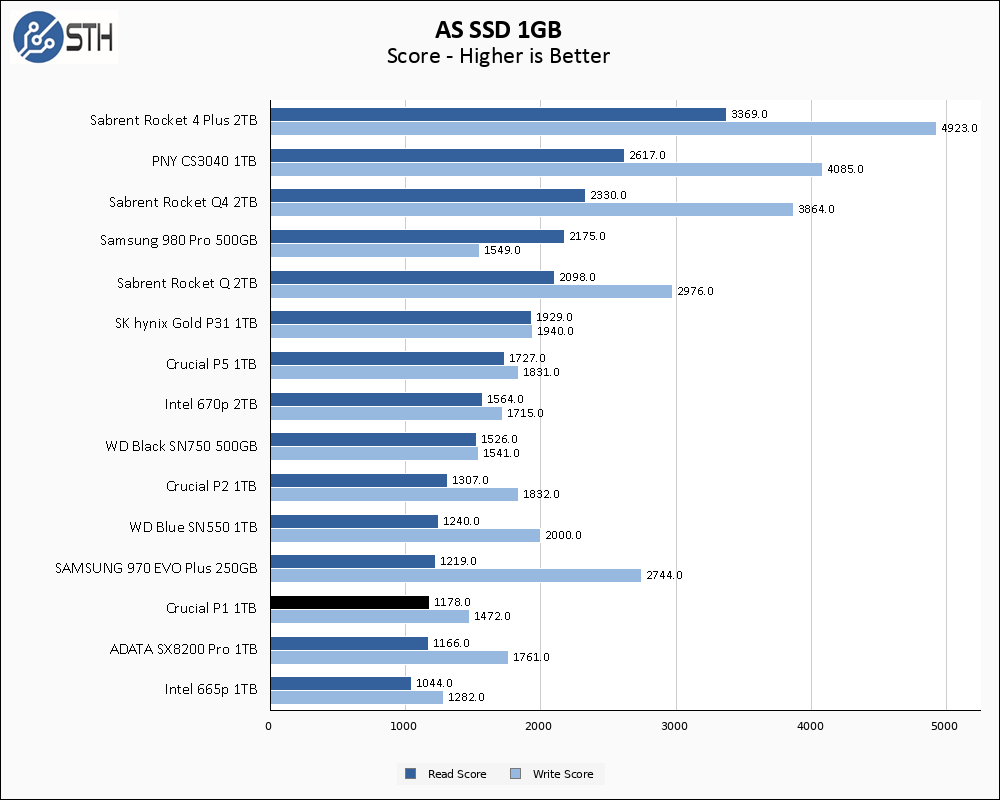
In AS SSD, the Crucial P1 1TB continues to impress, within the context of outperforming its own modest expectations. In addition, it continues the trend of being just a little bit faster than the Intel 665p.

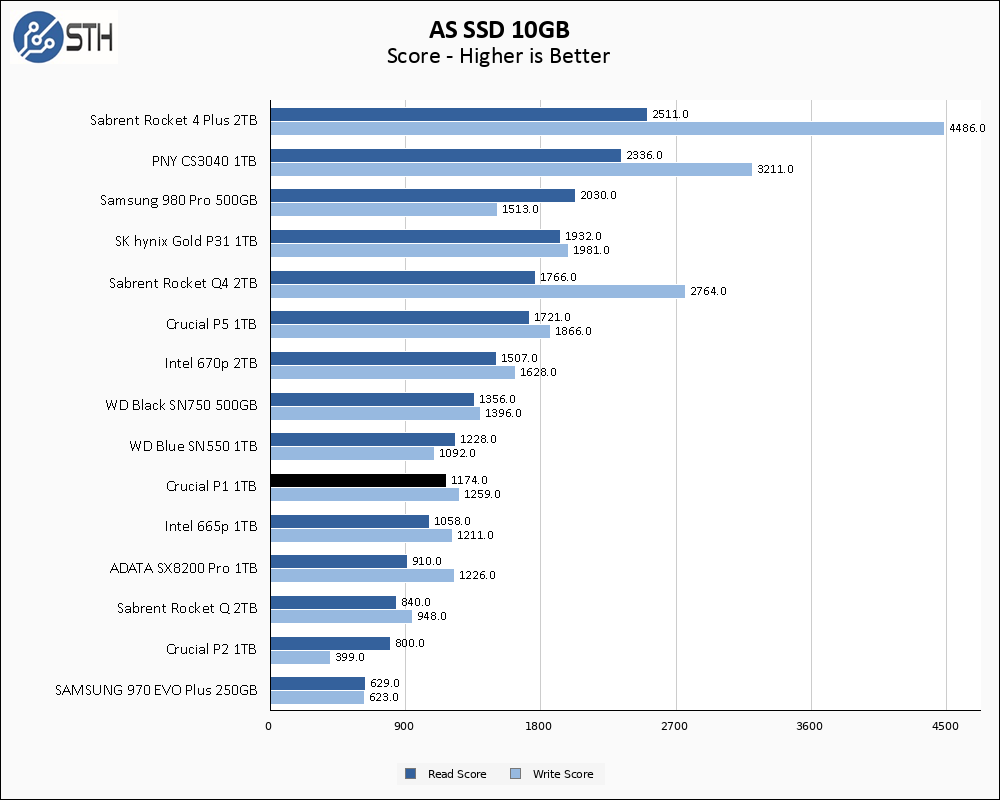
Our larger AS SSD benchmark represents the first and only time in our testing that the P1 showed a score differentiation between the small and large test sets; the write score went down by around 200 points on the larger test. This loss came from lower highly threaded random write throughput. The sequential and random write speeds held firm, so it was an extremely minor dip overall. Once again, this is a test where the Crucial P2 faltered, so the P1 commands a significant lead over its successor in this test.
SPECworkstation, direct comparisons, thermals, and our conclusion are up next.


Hi Will,
Those P1 when they get to thermal capacity around 70c throttle so much that they disconnect inside VMware ESXi, this requires a reboot to resolve.
So for any homelabbers, don’t use them inside your hosts.
Hi Will, kudos to your “Sustained Write Performance” test. It is an important thing for those of us with write heavy applications. Please keep this test in the future!
I’d caution people about using the P1. I had poor reliability with it.
I ordered one for my laptop, and it died within a few months. Completely dead, didn’t even complete POST. I returned it and got another, and it too died within a few months. Same thing, completely dead, didn’t even complete POST. After that I switched to a WD black and it has run non-stop for years. Maybe it was a fluke, but after two bad drives losing all my data, I wasn’t too big on trying again.
Comments are closed.