ASUS ROG STRIX RTX 3090 OC Compute Related Benchmarks
We are going to compare the ASUS ROG Strix NVIDIA GeForce RTX 3090 OC Edition to our growing GPU data set.
Geekbench 4
Geekbench 4 measures the compute performance of your GPU using image processing to computer vision to number crunching. This is getting older, but we have a large legacy data set.
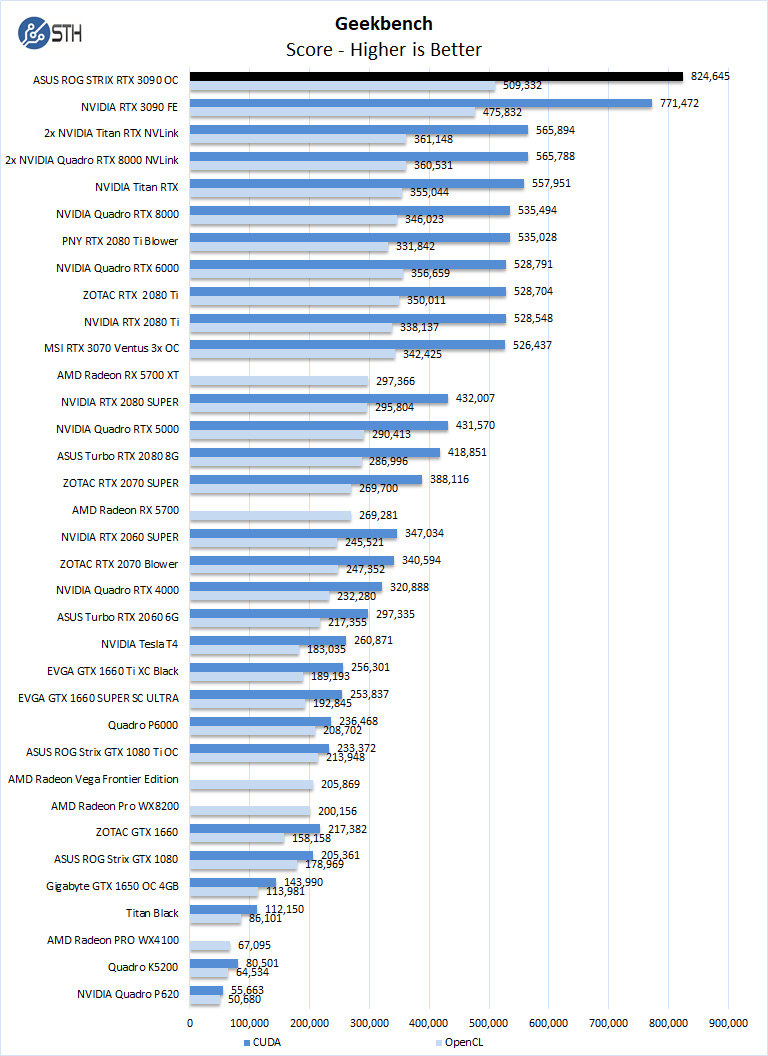
Our first compute benchmark, and we see the ASUS ROG STRIX RTX 3090 OC, we can see the OpenCL, and CUDA performance compares to last-gen RTX 2080 Ti. We also get a nice boost over the NVIDIA GeForce RTX 3090 FE.
LuxMark
LuxMark is an OpenCL benchmark tool based on LuxRender.
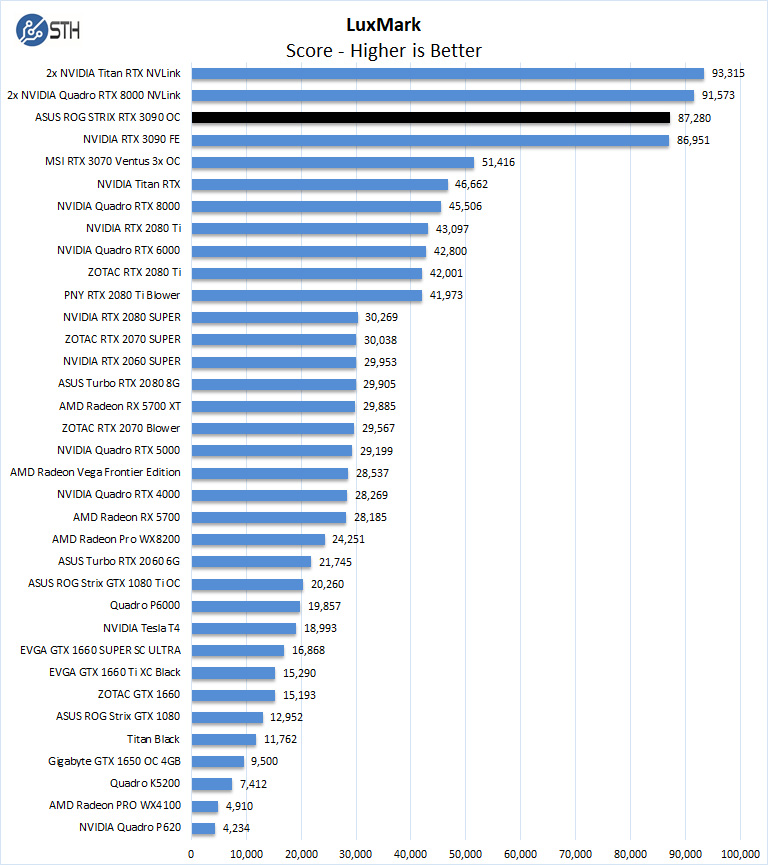
In LuxMark, a single ASUS ROG STRIX RTX 3090 OC can surpass our Titan RTX and Quadro RTX 8000. The figures are effectively even for the ASUS versus NVIDIA brand 3090’s here.
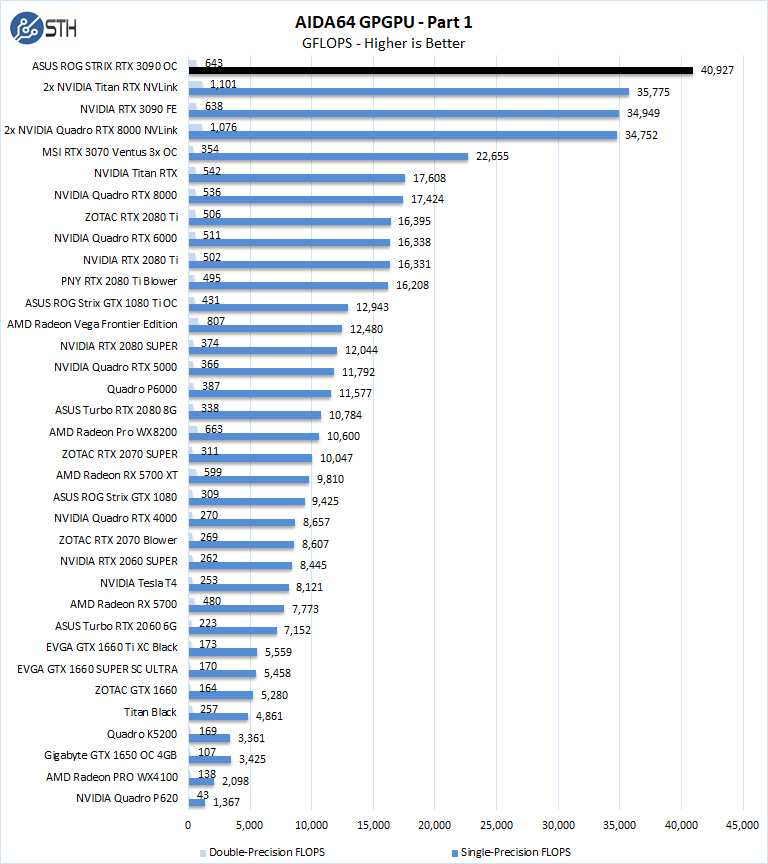
AIDA64 GPGPU
These benchmarks are designed to measure GPGPU computing performance via different OpenCL workloads.
- Single-Precision FLOPS: Measures the classic MAD (Multiply-Addition) performance of the GPU, otherwise known as FLOPS (Floating-Point Operations Per Second), with single-precision (32-bit, “float”) floating-point data.
- Double-Precision FLOPS: Measures the classic MAD (Multiply-Addition) performance of the GPU, otherwise known as FLOPS (Floating-Point Operations Per Second), with double-precision (64-bit, “double”) floating-point data.
The next set of benchmarks from AIDA64 are:
- 24-bit Integer IOPS: Measures the classic MAD (Multiply-Addition) performance of the GPU, otherwise known as IOPS (Integer Operations Per Second), with 24-bit integer (“int24”) data. This particular data type defined in OpenCL on the basis that many GPUs are capable of executing int24 operations via their floating-point units.
- 32-bit Integer IOPS: Measures the classic MAD (Multiply-Addition) performance of the GPU, otherwise known as IOPS (Integer Operations Per Second), with 32-bit integer (“int”) data.
- 64-bit Integer IOPS: Measures the classic MAD (Multiply-Addition) performance of the GPU, otherwise known as IOPS (Integer Operations Per Second), with 64-bit integer (“long”) data. Most GPUs do not have dedicated execution resources for 64-bit integer operations, so instead, they emulate the 64-bit integer operations via existing 32-bit integer execution units.
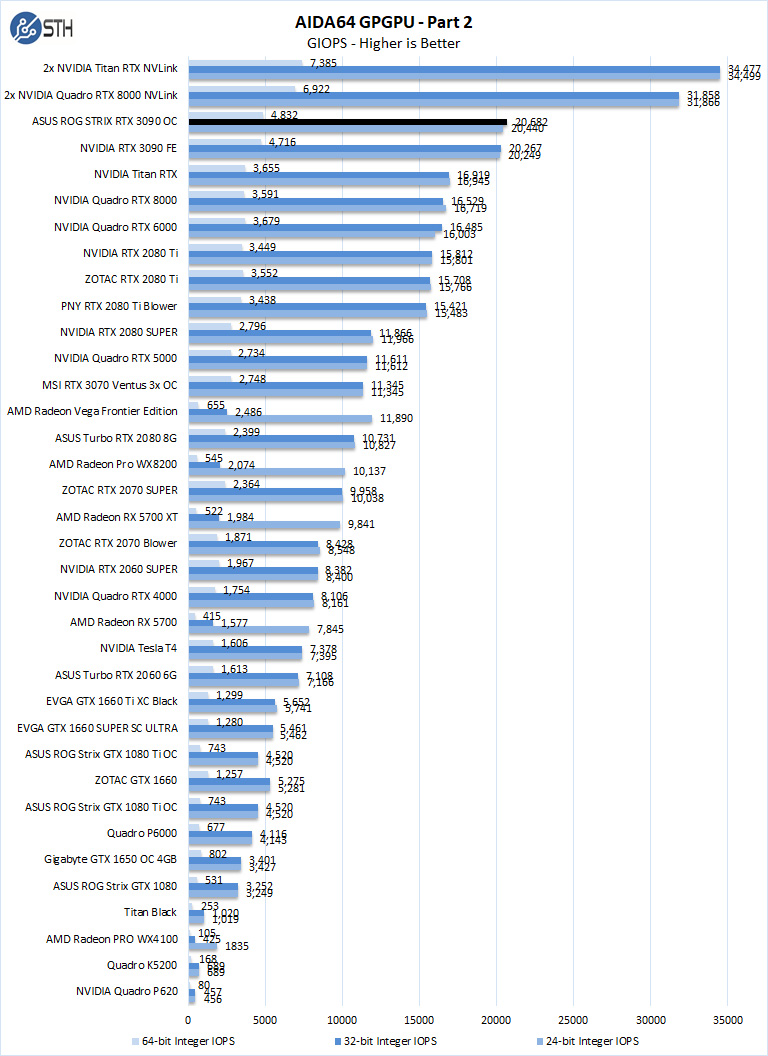
The take away here is the ASUS ROG STRIX RTX 3090 OC falls just above the cluster of RTX 2080 Ti scores. Again, this is slightly better than the NVIDIA branded version, but the numbers are very close.
hashcat64
hashcat64 is a password cracking benchmarks that can run an impressive number of different algorithms. We used the windows version and a simple command of hashcat64 -b. Out of these results, we used five results in the graph. Users who are interested in hashcat can find the download here.
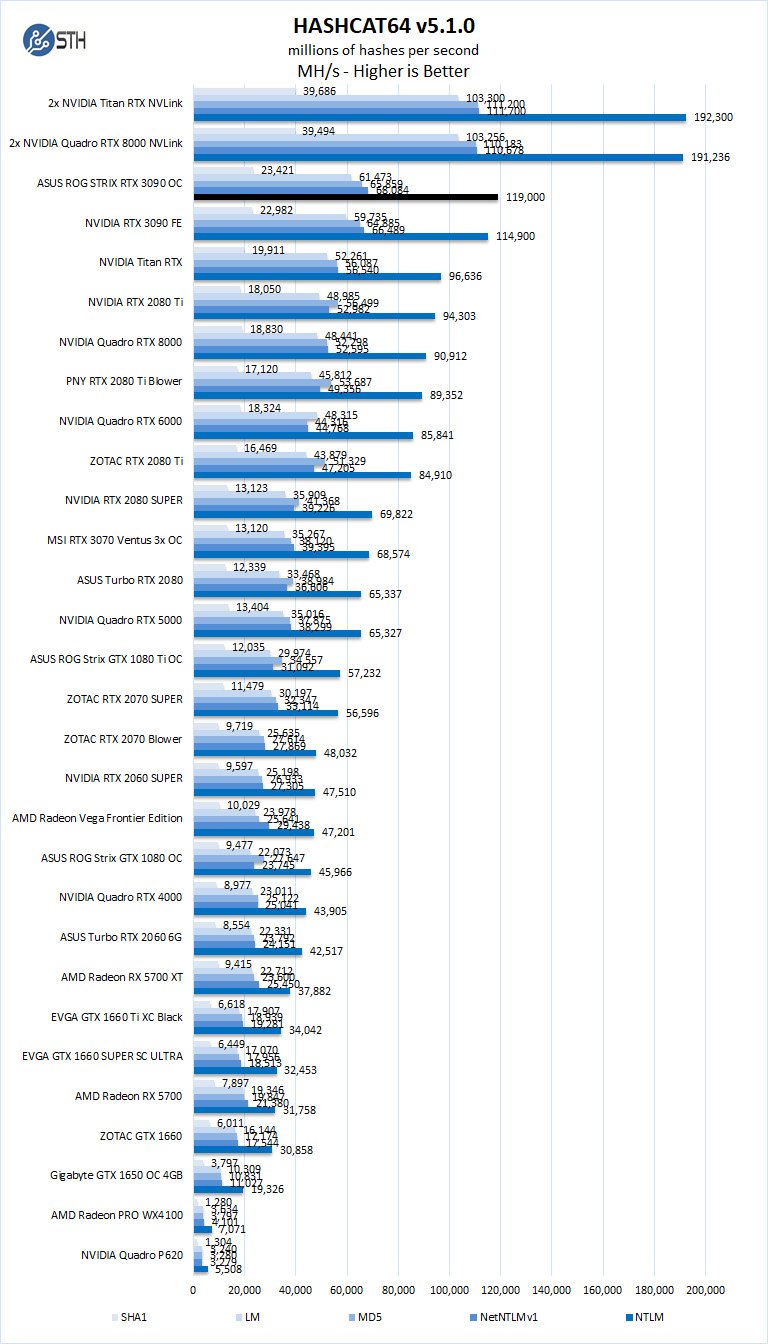
Hashcat can put a heavy load on GPUs. Again we see great GeForce RTX 3090 performance and the ASUS and NVIDIA cards are very close.
SPECviewperf 13
SPECviewperf 13 measures the 3D graphics performance of systems running under the OpenGL and Direct X application programming interfaces.
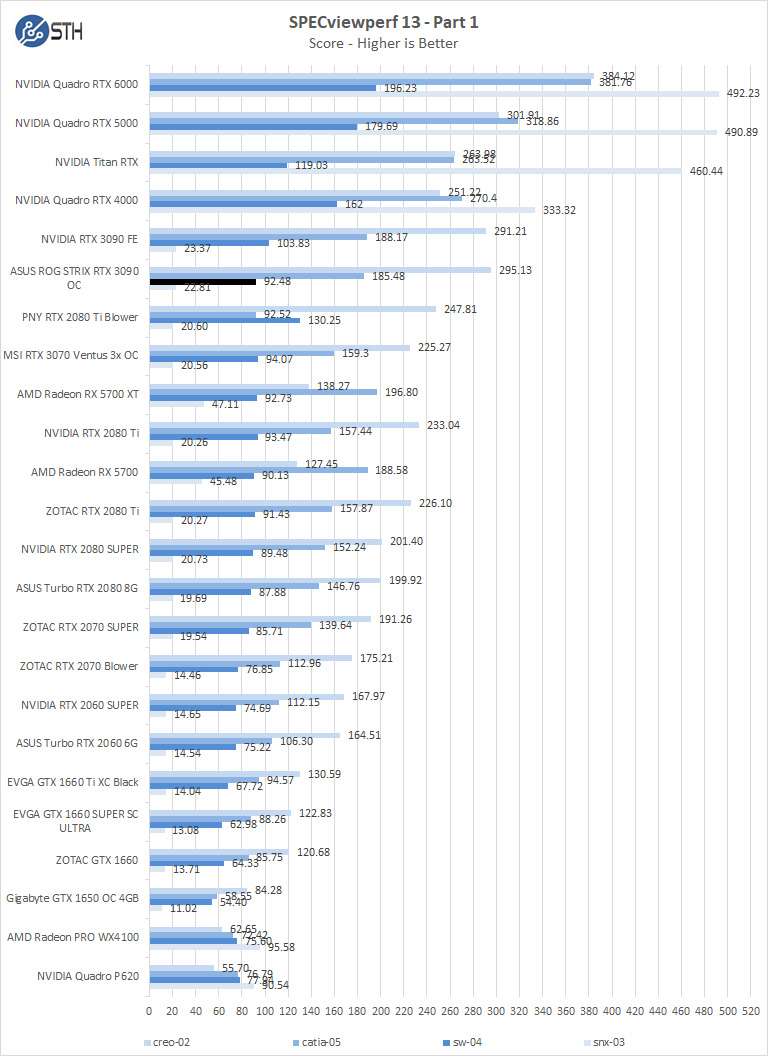
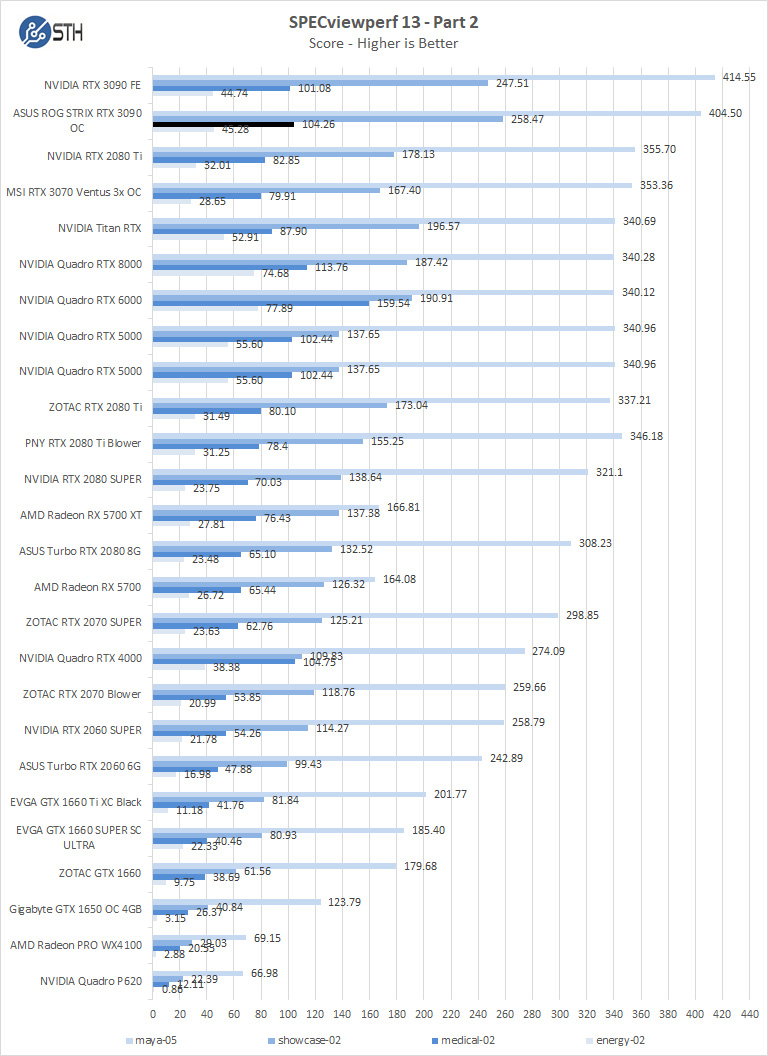
We were somewhat expecting either the ASUS or the NVIDIA GeForce 3090 card to pull ahead on SPECviewperf but instead, the cards were generally close and trading top spots depending on the test.
Let us move on and start our new tests with rendering-related benchmarks.


Great stuff, William! Thanks very much.
Thanks for the careful work! I would very much like to see how the Radeon VII, Radeon VII Pro and Titan V GPUs compare to the mix of performance numbers already obtained. These three graphics cards would have different performance characteristics compared to the others. It would be interesting to see the trade-off between fp64 and the 3D visualisation capabilities.
@Eric Olson, would be good to see the FP64 bars, certainly. VII Fp16 is not chopped liver either.
Comments are closed.