WD Red SN700 1TB Performance Testing
We test using both the default smaller test size as well as larger test sets on our benchmarks. This allows us to see the difference between lighter and heavier workloads.
CrystalDiskMark x64
CrystalDiskMark is used as a basic starting point for benchmarks as it is something commonly run by end-users as a sanity check.
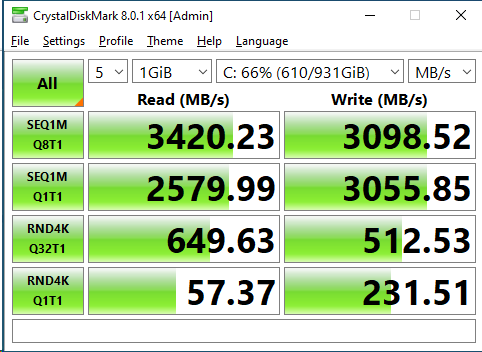
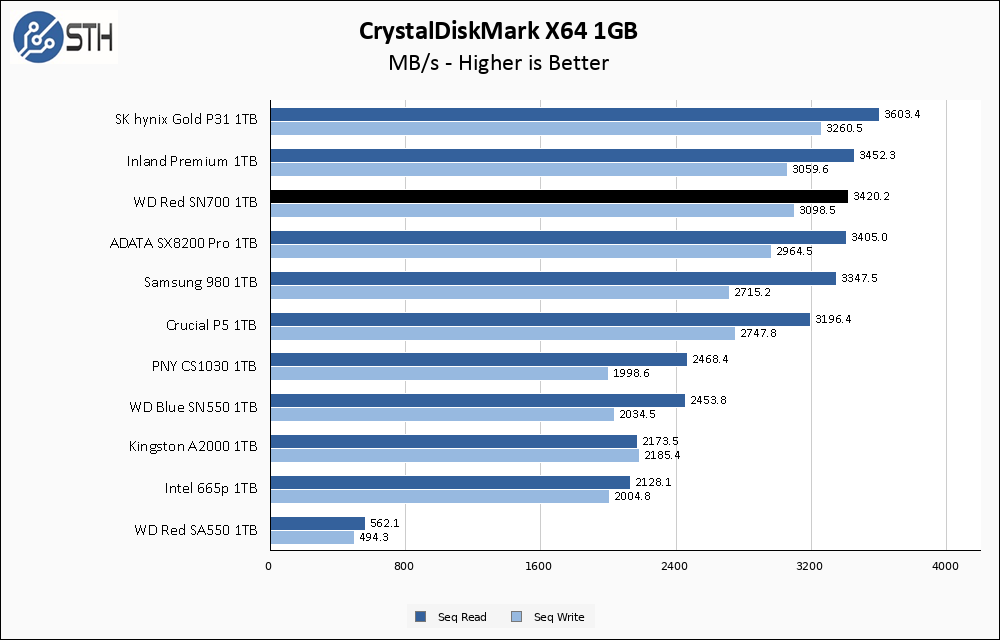
Right out of the gate, the WD Red SN700 almost exactly nails its advertised read and write performance numbers, and is in close contention with the best performing PCIe 3.0 we have tested. You will notice I have included the WD Red SA500 1TB in these results; this is purely to illustrate the generational improvement the move to PCIe has brought the Red line, and at no point do I expect the SA500 to be competitive.
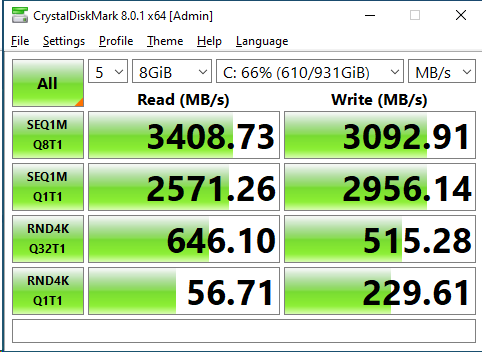
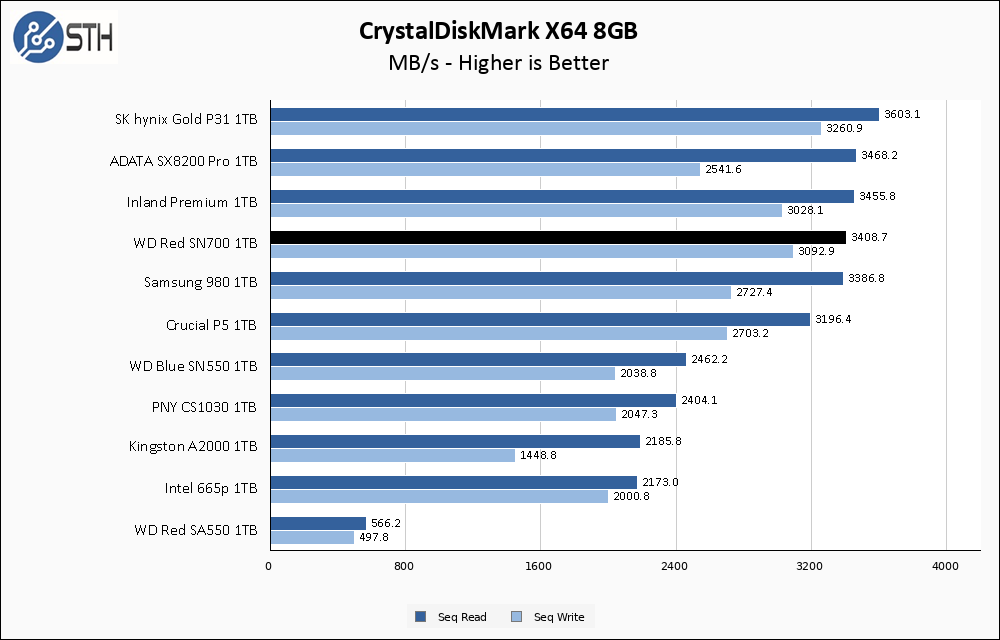
Performance drop on the larger CrystalDiskMark test is negligible.
ATTO Disk Benchmark
The ATTO Disk Benchmark has been a staple of drive sequential performance testing for years. ATTO was tested at both 256MB and 8GB file sizes.
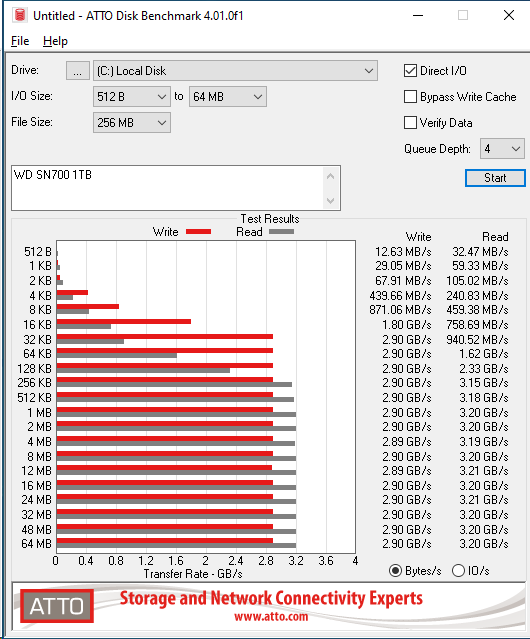
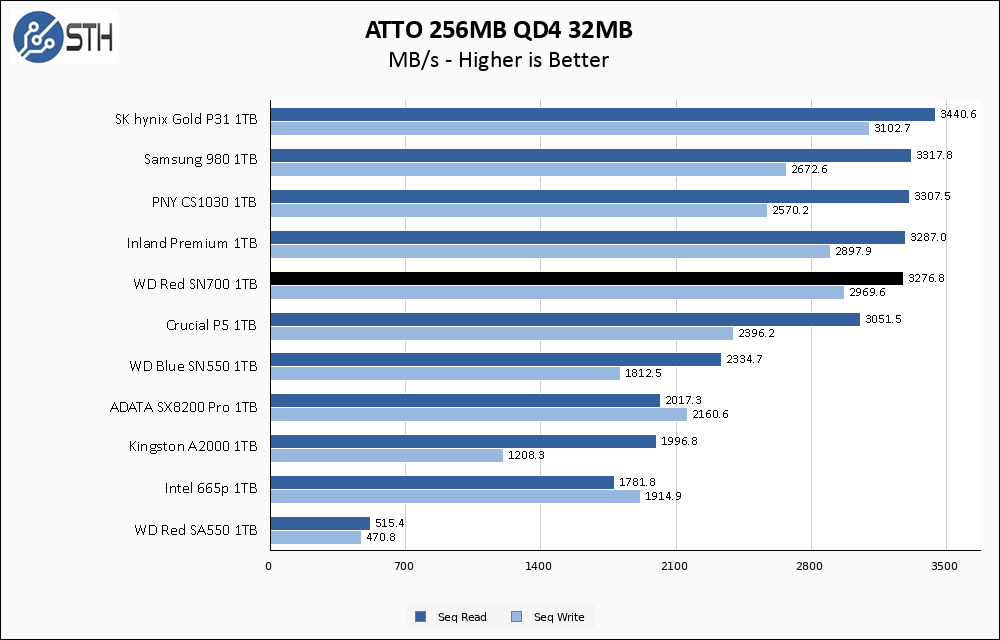
Lots of drives perform a tiny bit worse on ATTO’s sequential testing than they do in CrystalDiskMark, and the WD SN700 follows that pattern. With that said, performance is still very good among PCIe 3.0 SSDs and close enough to its advertised specs. Write performance, in particular, is very strong on this drive with only the SK hynix Gold P31 managing to top it.
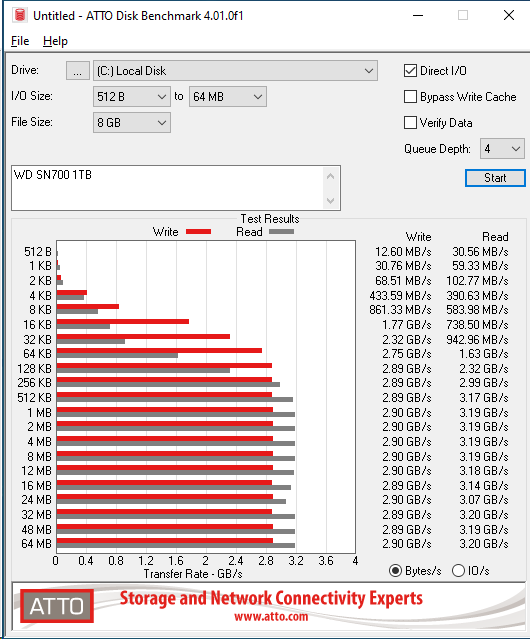
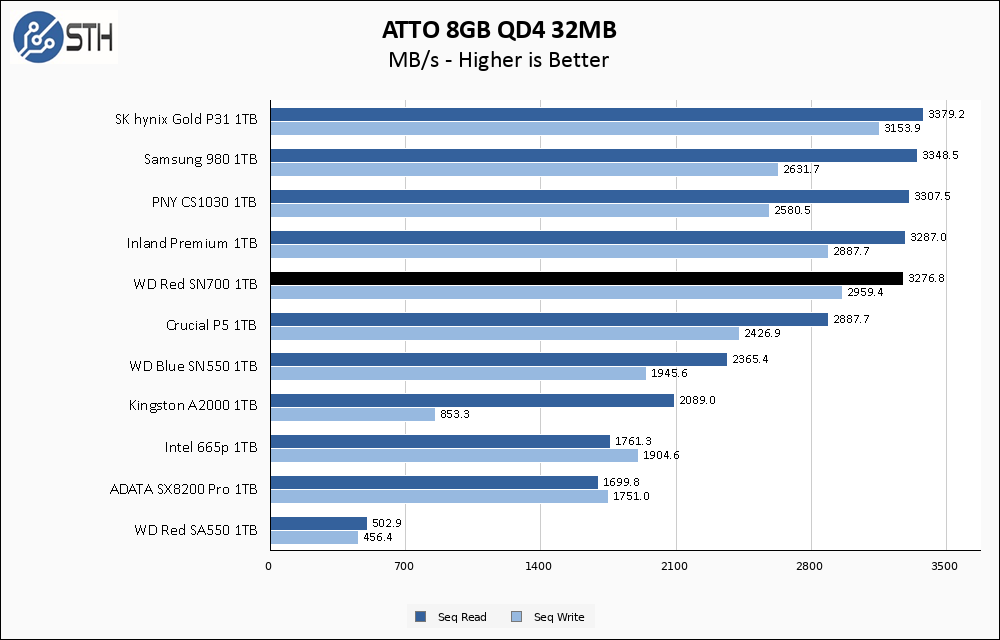
Once again, the WD Red SN700 does not lose any performance when moving to the larger test set. This is a good pattern for any drive, and especially one that is intended for more intense use like a a NAS cache drive.
Anvil’s Storage Utilities
Anvil’s Storage Utilities is a comprehensive benchmark that gives us a very in-depth look at the performance of drives tested. This benchmark was run with both a 1GB and 8GB test size.

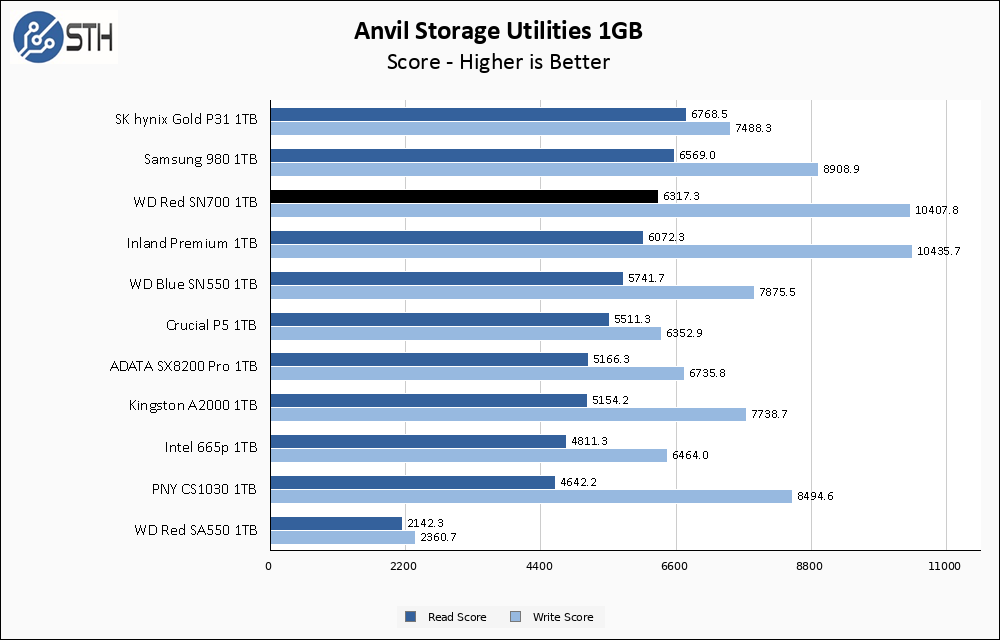
The WD Red SN700 1TB performance in Anvil is great; read performance is strong, and write performance is class-leading. Anvil write testing has long been an area where Phison based drives have come out on top, and the non-Phison SN700 managing to keep up is a big win.
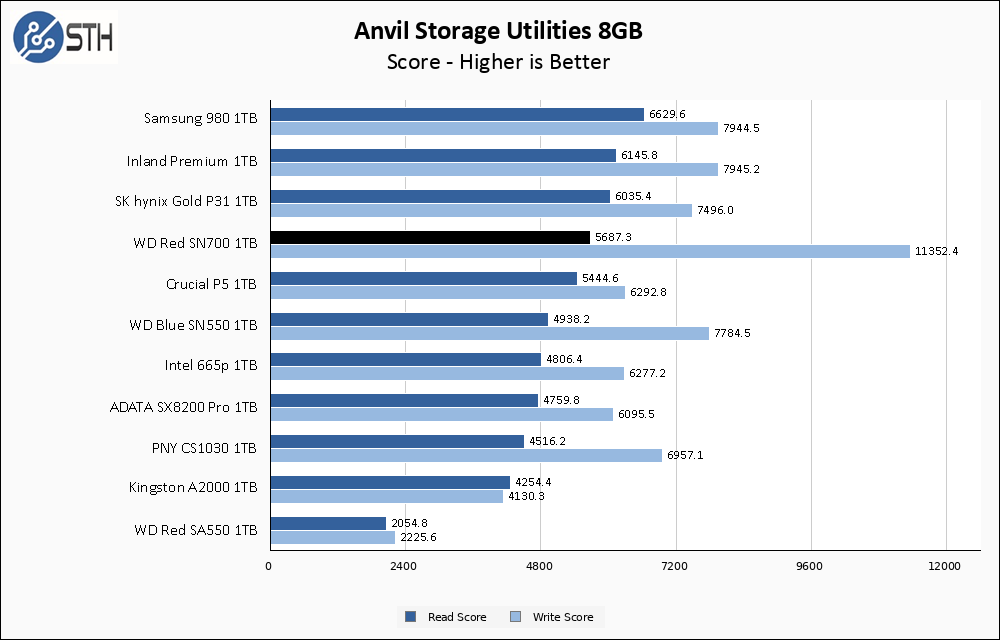
Just look at that write score. While the WD Red SN700 dropped a small amount in the reads department, performance on the larger Anvil test actually improved over the smaller test, placing the SN700 as the clear winner for write performance.
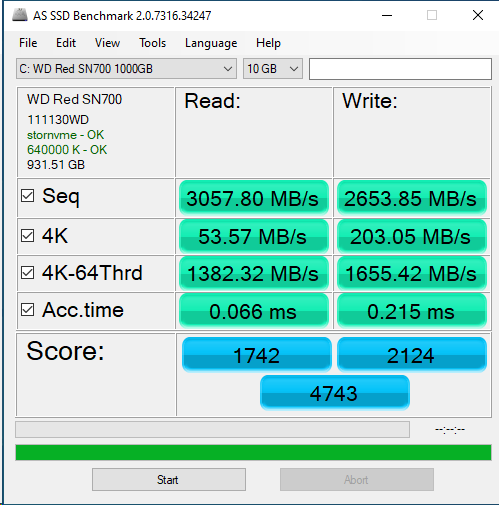
AS SSD Benchmark
AS SSD Benchmark is another good benchmark for testing SSDs. We run all three tests for our series. Like other utilities, it was run with both the default 1GB as well as a larger 10GB test set.
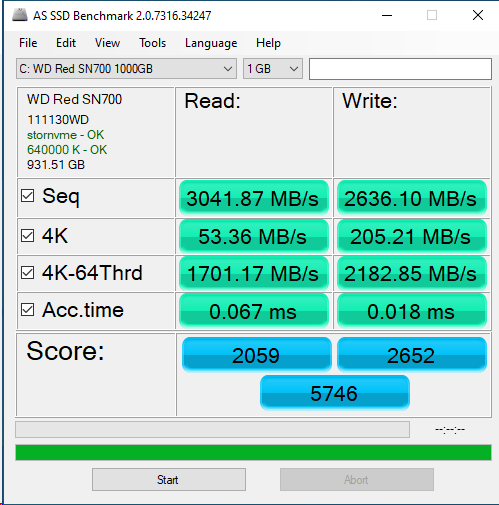
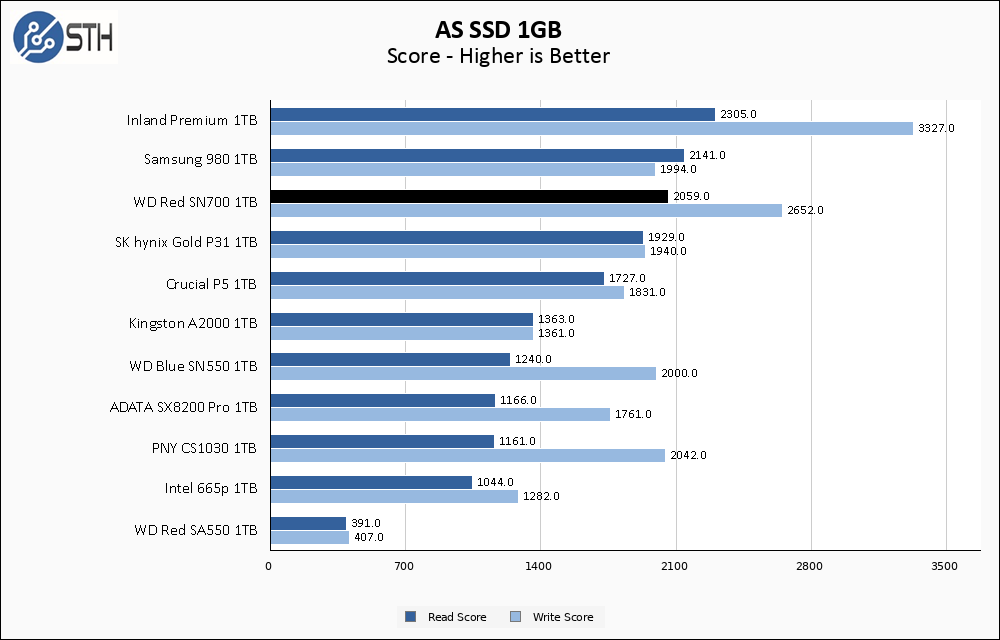
AS SSD presents yet another benchmark where the WD SN700 is competing for the top of the PCIe 3.0 charts for both read and writes.
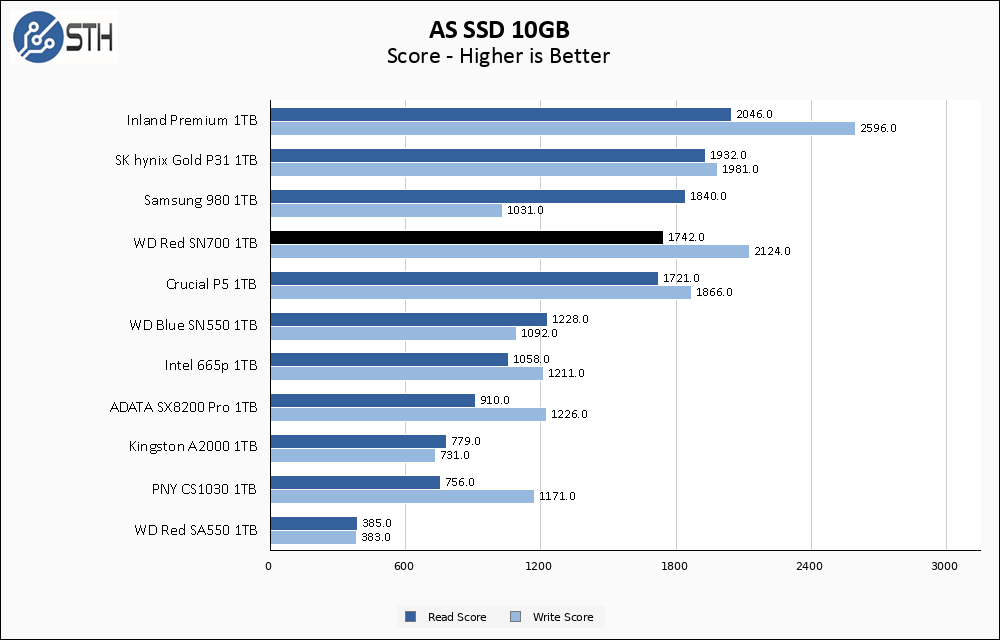
The larger AS SSD test finally manages to put a small dent in the SN700, and represents essentially the only test where there is a significant negative performance differential between the smaller and larger test sets. Performance is still good, and write performance is still second place on our graph.
SPECworkstation, thermals, and our conclusion are up next.


How about testing SSD @STH with fio@linux?
Windows could be to slow for modern SSDs, and nobody needs the fastest SSDs with windows.
Very interesting product.
but MAN that runs hot. and it only lists 70C as the max operating temp on the data sheet. That’s worrisome, especially if it’s in a cramped NAS.
I paid same amount of a regular pcie 3.0 on a PNY XLR8 CS3040 which is pcie 4.0.
The write and read speeds I got to reach 3500MB each on benchmark.
My system is an i5 8600k with z370i asus strix, which is pcie 3.0. The results are amazing for the price. I paid R$1490,00 on the cs3040 2tb version.
Comments are closed.