WD Blue SN550 1TB Performance Testing
We are moving towards using larger test sizes on our benchmarks, but on several tests, we also used the smaller default test sizes. This allows us to see the difference between lighter and heavier workloads. Unfortunately, our entire backlog of SSD reviews did not include this testing methodology, so we are doing the best we can with generating comparison charts.
BlackMagic Disk Speed Test
This is a popular speed test in the video community. It shows whether a storage device is suitable for throughput required at a given video format.
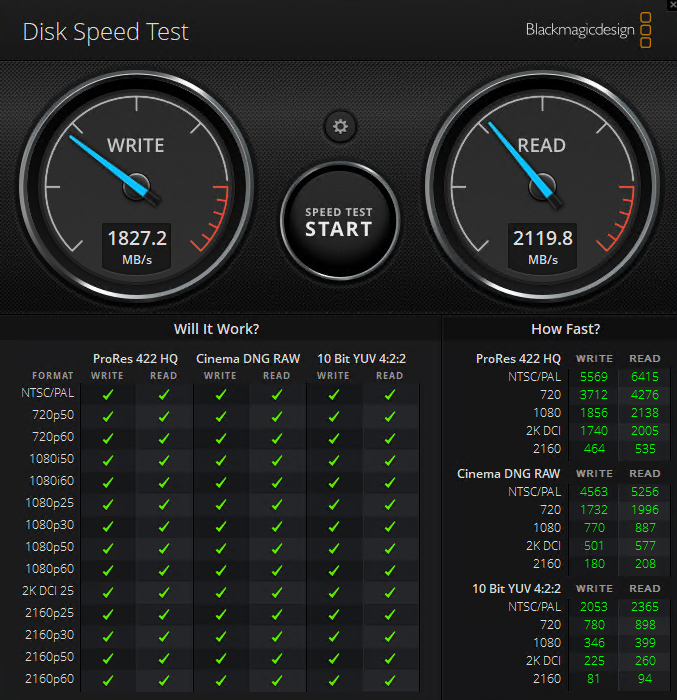
As a PCIe 3.0 NVMe SSD, the WD Blue SN550 1TB has a good showing here and handles every format this benchmark can test for. Some previously tested QLC-based PCIe 3.0 SSDs do not pass all these tests, and no SATA based drive can do so.
CrystalDiskMark 7.0.0 x64
CrystalDiskMark is used as a basic starting point for benchmarks as it is something commonly run by end-users as a sanity check.
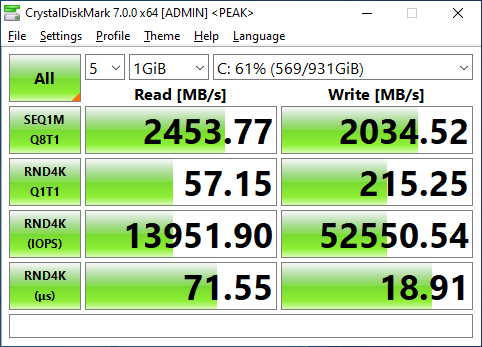
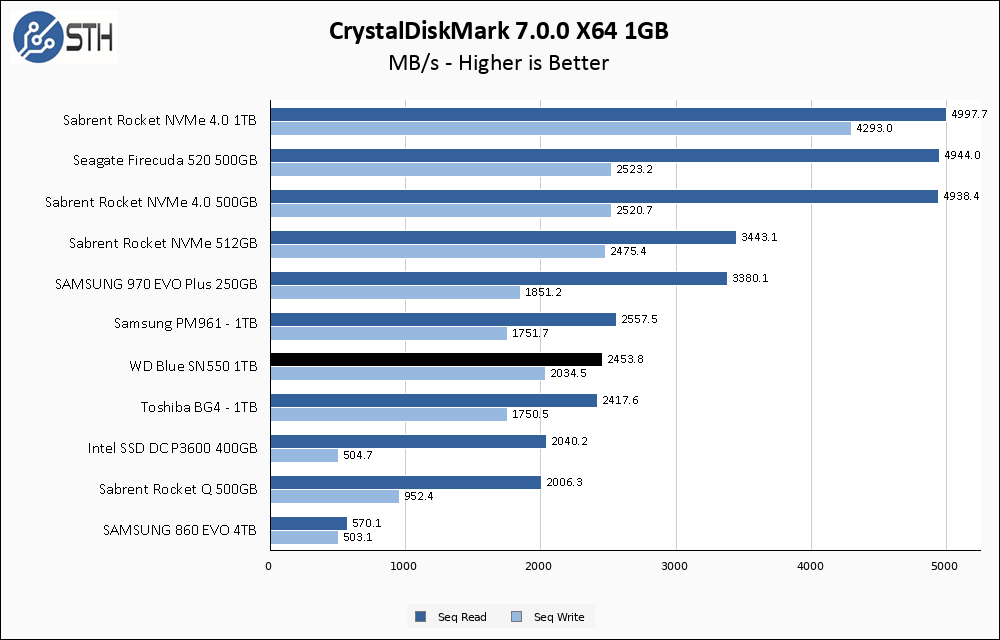
Using the 1GB test set, the WD Blue SN550 1TB is right on target and slightly exceeding the advertised 2400 MB/s read and 1950 MB/s write specs. With that said, this drive is obviously targeting middle-of-the-road performance overall.

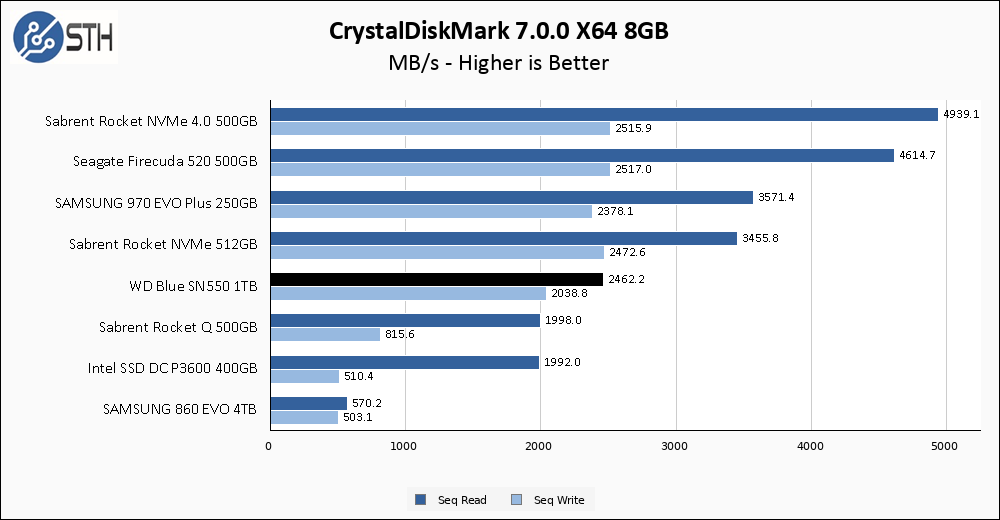
WD Blue SN550 1TB CrystalDiskMark 8GB ChartMoving to the 8TB test set has a negligible impact on the WD Blue SSD, which is encouraging.
ATTO Disk Benchmark
The ATTO Disk Benchmark has been a staple of drive sequential performance testing for years. ATTO was tested at both 256MB and 8GB file sizes.
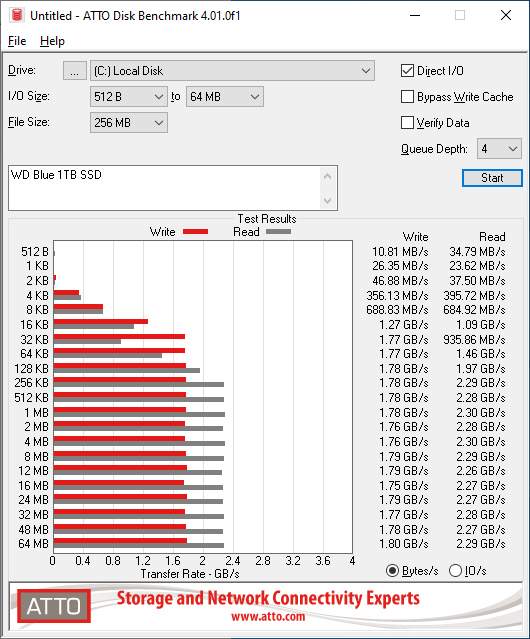
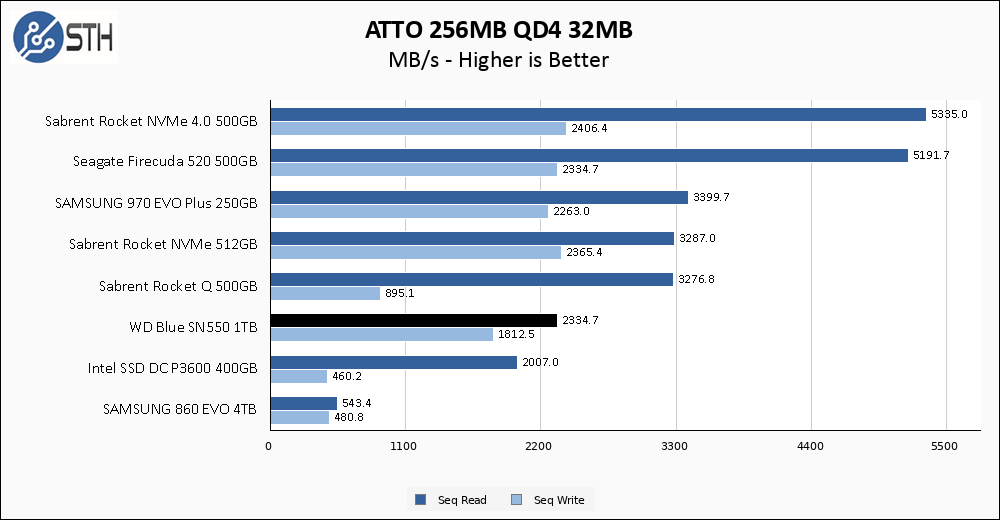
Similar to CrystalDiskMark, ATTO performance is close to the advertised specs and in no way competing for the high end of NVMe drive performance. Unlike CrystalDiskMark, the drive comes in slightly below the advertised performance rather than slightly above.
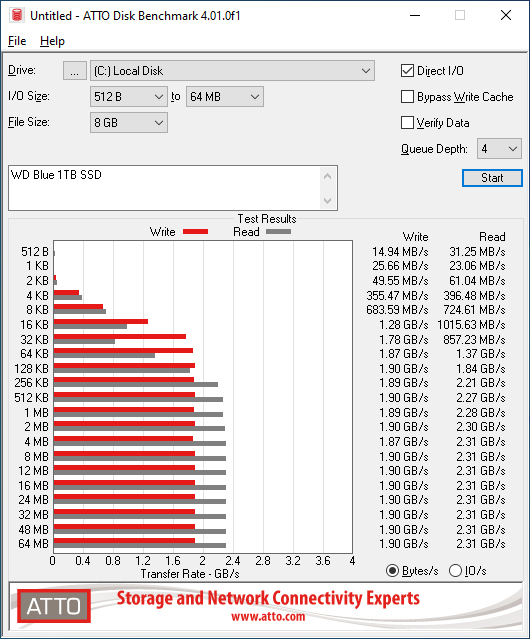
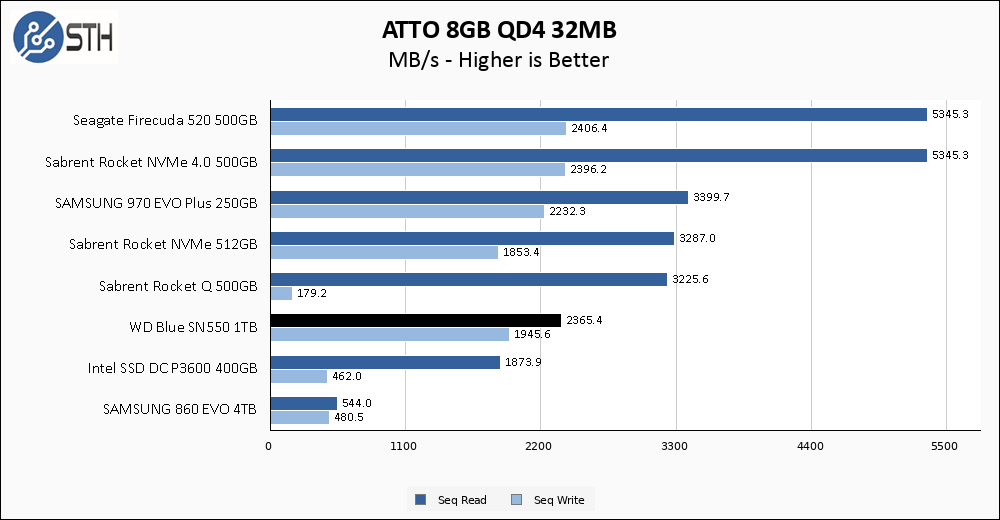
In the positive column for this drive is that, once again, the larger test set has no negative impact on performance; the ATTO 8GB test set is nearly indistinguishable from the 256MB one.
Anvil’s Storage Utilities
Anvil’s Storage Utilities is a comprehensive benchmark that gives us a very in-depth look at the performance of drives tested. This benchmark was run with both a 1GB and 8GB test size.

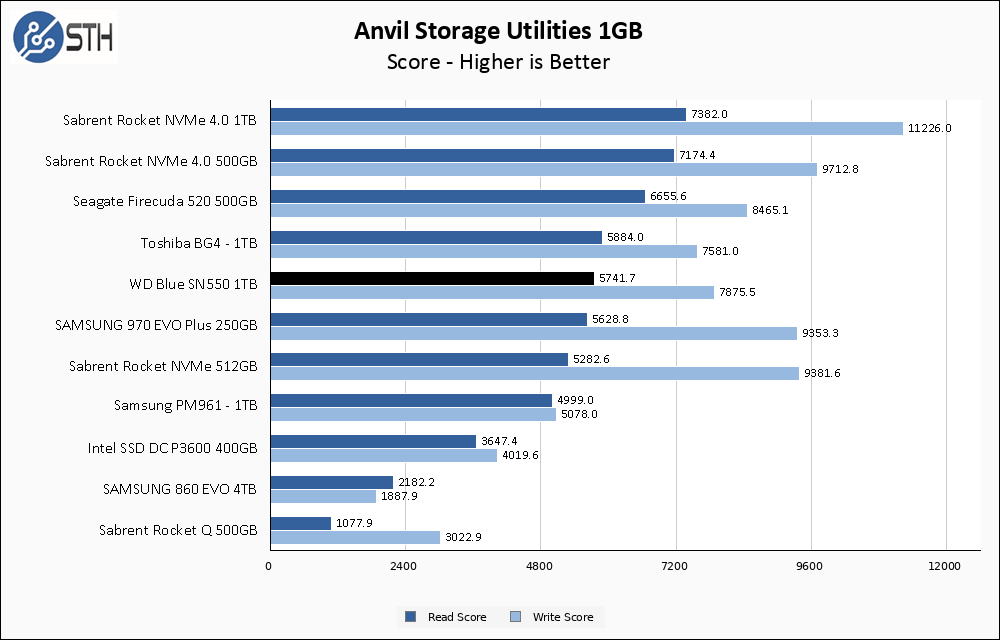
With Anvil running a 1GB test size, the read speeds are lower than with CDM or ATTO, while the write speeds remain higher. In terms of relative performance though, the WD Blue SN550 1TB has a better result here than in some of the previous benchmarks.
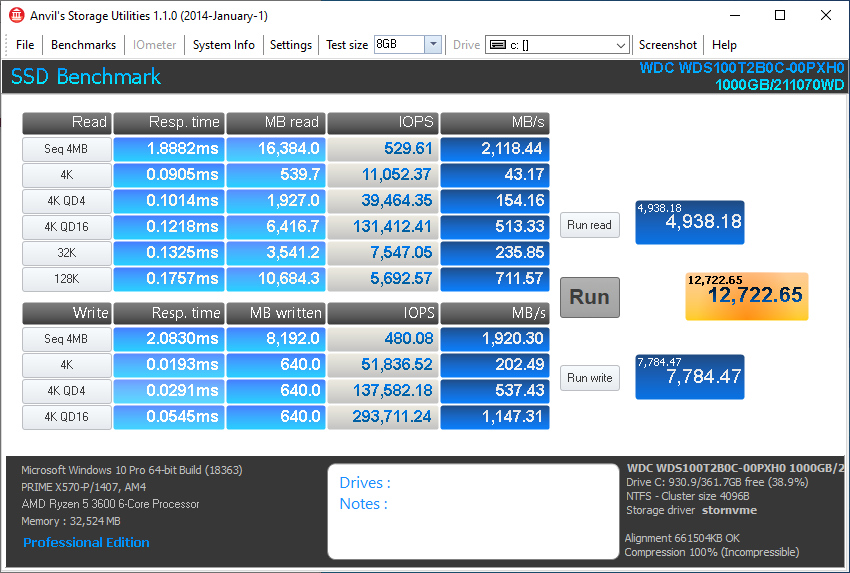
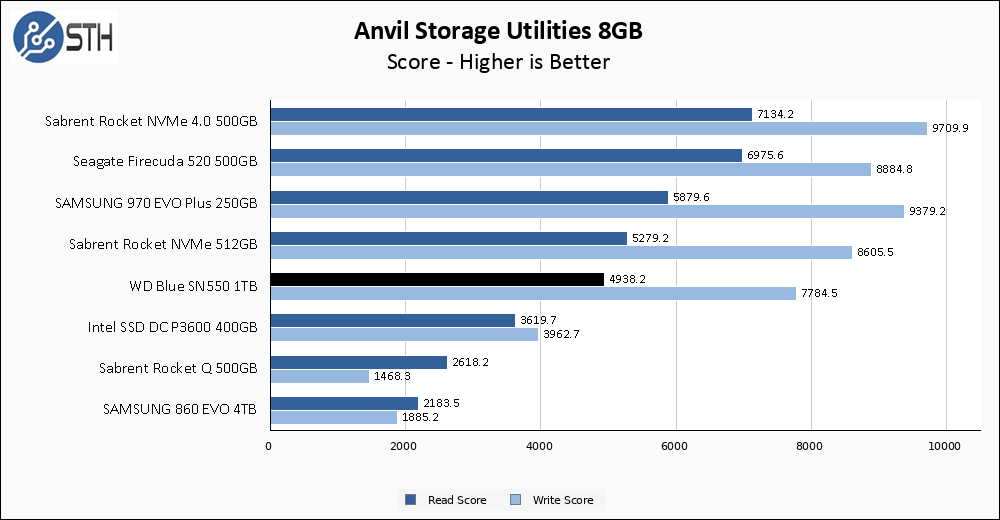
With 8GB test size, there is a very minor dip in the results relative to the 1GB results, but not much.
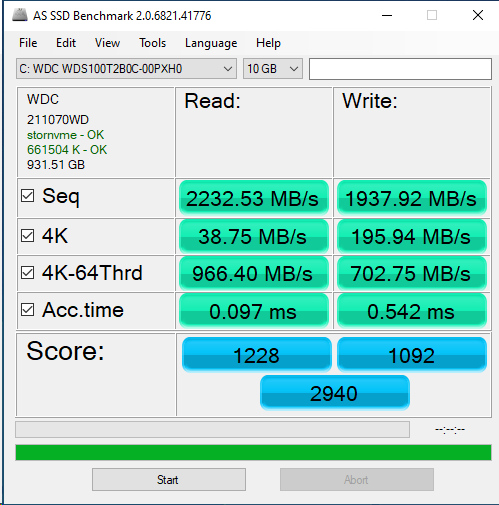
AS SSD Benchmark
AS SSD Benchmark is another good benchmark for testing SSDs. We run all three tests for our series. Like other utilities, it was run with both the default 1GB as well as a larger 10GB test set.
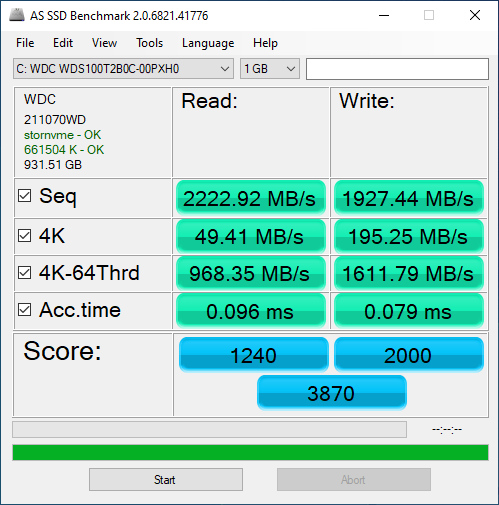
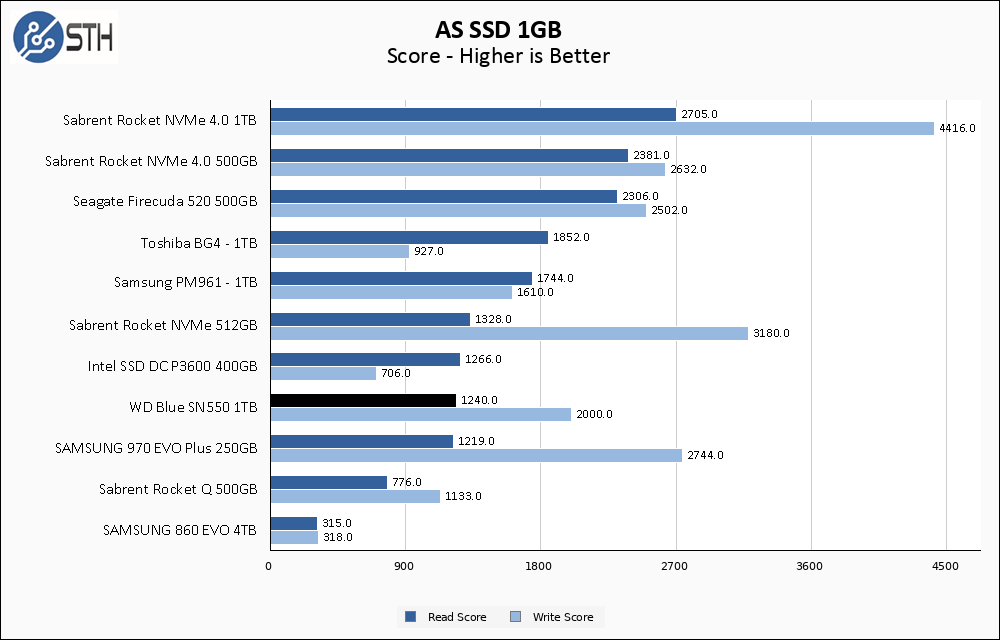
With the smaller test set, read performance continues to be a bit below the rated specs while writes are consistently close to the 1950 MB/s target. Obviously the WD Blue SN550 continues targeting the middle of the pack and mostly succeeding.
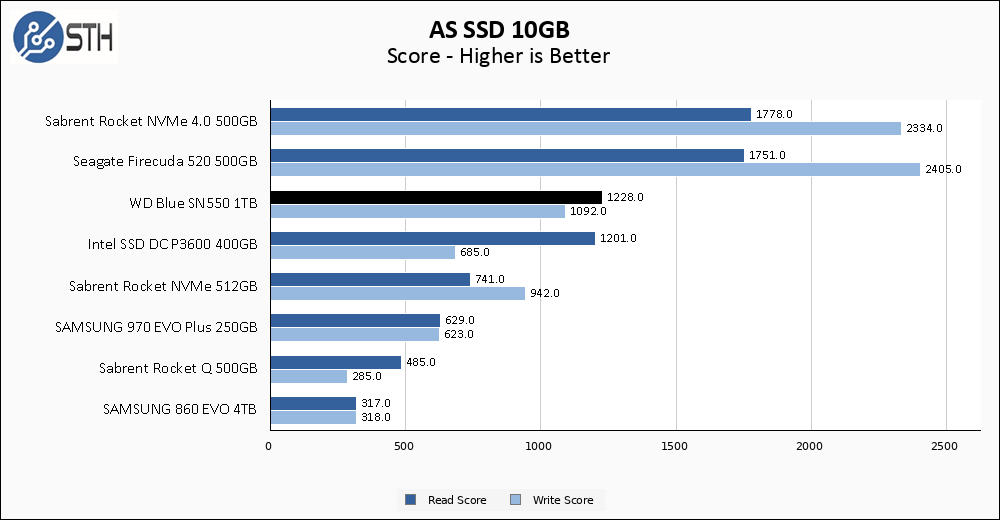
With the larger AS SSD test set, read performance is functionally identical to the smaller set. For writes, the WD Blue SN550 1TB holds up better than some of the other consumer drives in our benchmark set but is still impacted by the larger test set. The 4K-64Thread write numbers drop by ~50% compared to the performance on the smaller test set, but other drives in our testing library suffer even more severe drops. As a result, the WD Blue performs well overall here.
PCMark, SPECworkstation, and our conclusion are up next.


Thanks for the review!
One suggestion: 10GB may be even to small.
Others for example also review with copying a specific 100GB set of mixed files, and this is where the performance is truly showing.
Even though 10GB is enough to fill most DRAM buffers, it is not enough to fill the pseudo SLC buffer on TLC or QLC drives, only if the whole drives are nearly totally full anyway.
So what you are mesuaring is only the pseudo SLC buffer, which has nothing to do with how the drive performs when that buffer is filled.
Usually most drives only offer about 1/3 of the adverstised speed (DRAM and/or pseudo SLC buffer speed, the same as you benchmarked), if not much less.
To the topic of the SN550: It is IMHO the best value SSD right now. Much faster than QLC, only a bit slower than TLC in the 160€+ price range, and now for sale here often even as low as 90€ for 1TB!
Have in running 24/7 in my main server (KVM/Docker/SAMBA) without problems.
Steven,
In some cases, I’m limited by the tools I’m using for the benchmarks. However, some of the utilities use a bit more data than they indicate. CrystalDiskMark, for example, at its 8GB setting like I use is also set to 5 passes for a total of 40GB. It then runs 4 tests and both read and write for each, for a total of about 320G total read/write traffic. ATTO is like this as well; it reads and writes 8GB of data, but does so with that data in 20 different chunk sizes. Eventually, and specifically for more server oriented SSDs, I would like to develop my own benchmark scripts that better simulate a client/server transactional workload, but I’m not there yet.
@Will: Thanks for your (fast) reply!
I must make clearer that your approach certainly deserves praise for the extensiveness, as you use a wide selection of benchmarks and not only Crystal Disk Mark (the worst offender) and Atto like most. And its great to hear that you are planning to even write a custom bechmark script!
Maybe a cheap workaround for the time being would be to copy the method of using a predefined fixed set of mixed files of e.g. 100GB?
Another suggestion: Maybe you could reuse some of the work Michael Larabell does at Phoronix? Phoronix Test Suite is FOSS, and has already implemented a wide array of server workload as benchmark scripts.
Thanks again for your reply, and have a nice remaining Sunday!
My problem with using a predefined simple set of files for basic copy operations is multifold. Firstly, you have to copy from somewhere to somewhere. I could do everything within one drive, but then it makes it difficult to differentiate between read and write performance. If I copy from some other source, I have to ensure that the source of the files is having as little impact upon the copy process as possible. Additionally, the OS in play (Windows currently) can have buffers and caches and things that interfere in standard file copying processes. Lastly, a big file copy of a bunch of files just isn’t a particularly stressful I/O operation.
My idea of a good server style test would likely involve a small array of actual physical clients performing a scripted set of operations against a file server using the test SSD as its volume. Obviously networking would be an impact in this kind of scenario, and bypassing that bottleneck is a significant impediment to testing via this methodology. But it’s something I would like to eventually work towards!
Western Digital Hard Drive life only two years after there if you guys call Customer Service they did not reply correct information i have 2TB MY BOOK LIVE external hard drive after two years one day its did not start like there is no green light appeared on device so customer service representative advice buy Ac/Dc cable from amazon after buy cabel its not work than i call customer service they tell me pay some dollar and get your data from my cloud. So just think before buy products life cycle only two year if once warrenty finish than you have to pay more dolllar for download.
Steven,
We have some benchmarks that are similar to what Michael uses. We tend not to use it at STH as it has the possibility of breaking embargo with data. I know PTS has a feature to disable this, but even Michael broke the Rome embargo last year by publishing his results on the online PTS viewer. Most vendors do not care, but our tooling (even beyond this) is designed to never have that happen. Very conservative.
I do think longer and more extensive benchmarks are good. There is always the question of what makes sense for a consumer workload as well. All good questions and ones worth considering.
Looking at NVMe SSDs in this segment, it would be nice to have the ADATA XPG SX8200 Pro in future charts, too. Even though it has been available for quite some time, and there are many of reviews of it, it would be nice to have it as a reference to compare newcomers against, based on the same benchmarks and settings.
I think the course of action is clear: switch to Linux, mount with sync, and use a Ramdisk when possible. :D
Anyway, how a drive functions when mostly full is something important to know. For instance, I know to underprovision Intel 660p/665p drives because they get cranky when filled up.
Also, thermal limits. How do drives act when hot? One of my particular consumer cases is using them as external drives (backup, etc.) in Orica M.2 cases.
@Will and Patrick:
Wow, thanks for both of your replies!
If my critique came of as anything but positive and constructive, i have to apologize; My only gripe has been that the transfer rate without RAM+SLC-cache was not visible; And i do now understand that my proposition of using a mixed set of files is hardly useable for the reasons Will mentioned.
And when the in-development new testing scripts will be here eventually, they should put you to the top of SSD benchmarks easily!
And thanks to Patrick, those insights are one of the main reasons i am reading here and recommend your site wholeheartly. Did not know about the Embargo breaking issue, so another thing i have learned.
Much, much apprieciated! Both answering at all (which of course is not a given in this field) and for the insightful answers (which is even more rare)! :)
Comments are closed.