
Lately we have been testing the new Linux Benchmark Suite mentioned here with Amazon EC2 instances. Specifically we have been using the first generation t1.micro, m1.small, m1.medium and m1.large instance types. We have been working across several AWS EC2 instances because the underlying hardware does change quite a bit. One thing we are not doing with this benchmark suite is testing disk I/O. This is because we are working on the Linux CPU benchmark suite. Expect the disk I/O suite to roll out later this year. While this is still a work in progress, Amazon AWS EC2 instances allow us to quickly spin up new test instances and test some variables. We also have a dozen or so servers that are going through the same benchmarks under bare metal conditions as a point of reference. Today we are starting to share the results. The big ask below is that you share feedback on how to run these benchmarks before we set the Linux Benchmarking suite.
Amazon AWS EC2 Benchmark Environments
For these tests we used the Ubuntu 12.04 LTS Amazon AMI which is a fairly popular installation.
- Amazon AWS EC2 t1.micro – Intel Xeon E5430
- Amazon AWS EC2 m1. small – Intel Xeon E5645
- Amazon AWS EC2 m1.medium – Intel Xeon E5645
- Amazon AWS EC2 m1.large – Intel Xeon E5507
Each test was done at least five times on each new EC2 instance. We spun up instances until we had five instances with the same CPU type for each instance type (e.g. when we had five m1.small instances on a Xeon E5645) and ran the benchmarks on that. More to come when looking at different CPUs for each instance type but it is well known that the underlying architecture does have an impact.
Setting the System Up for Benchmarking
A few commands are needed to take a base Ubuntu 12.04 LTS installation and get it ready for benchmarking. Here are the basic commands one needs to run in order to run the benchmarks:
sudo apt-get update
sudo apt-get upgrade -y
sudo apt-get install build-essential libx11-dev libglu-dev hardinfo crafty phoronix-test-suite -y
sudo reboot
The installation command should not include crafty for the Amazon Web Services distribution because that command will fail as described below. For most systems, that will prepare the Ubuntu Linux machine for benchmarking.
Hardinfo Performance
hardinfo is a well known Linux benchmark that has been around for years. If you have Ubuntu 12.04 LTS, you can install this easily with:
sudo apt-get install hardinfo -y
It has a number of tests and has a GUI component as well. The first test is Blowfish encryption which is probably a bit better of a CPU than AES encryption at this point since modern CPUs with dedicated AES functions can push many GB/s of AES encrypted bandwidth making AES more academic at this point. Other tests include CPU CryptoHash, CPU Fibonacci, CPU N-Queens, FPU FFT and FPU Raytracing. Here is what we saw:
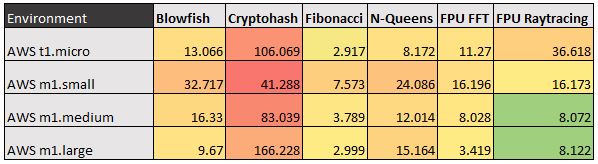
These benchmark results show the general trend but one can see the burst powers of the t1.micro creep up again. Not much explanation around the N-Queens benchmark and the m1.small instance. At first this seemed wrong but did a sanity check using a CentOS installation (significantly harder to run) and received a result within 1% of the Ubuntu average.
UnixBench 5.1.3 Performance
UnixBench may be a defacto standard for Linux benchmarking these days. There are two main versions, one that tests single CPU performance on that tests multiple CPU performance. UnixBench segments these results. During the process of benchmarking, we did find some errors with systems >16 cores. The man behind Centmin mod pointed us to the patch to get multi-threaded tests working on these larger systems. The logic for running the tests looks something like this:
wget https://byte-unixbench.googlecode.com/files/UnixBench5.1.3.tgz
tar -zxvf UnixBench5.1.3.tgz
cd UnixBench
time makeif CPU threads >16 {
wget http://forums.servethehome.com/pjk/fix-limitation.patch
patch Run fix-limitation.patch
}
./Run dhry2reg whetstone-double syscall pipe context1 spawn execl shell1 shell8 shell16 | tee UB513.txt
That runs all of the CPU benchmarks in the suite and saves a good amount of time not running the filesystem I/O benchmarks. One can also note that we are testing the compile time of UnixBench. Not overly exciting but an interesting data point.
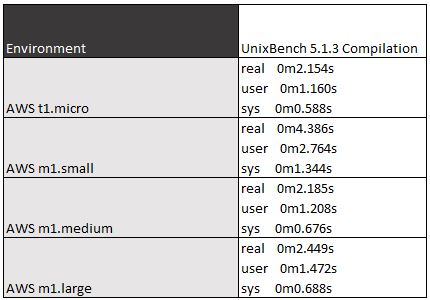
Again the t1.micro burst speed helps a lot here starting the compile from scratch. An interesting note here is that the time make results favored the t1.micro instance. Looking at the full UnixBench results:
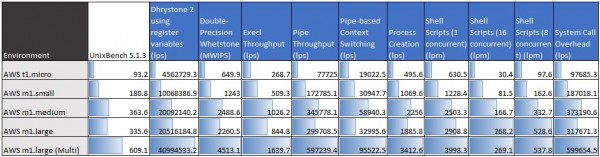
One can see that the EC2 m1.medium instance did well but once the m1.large instance could take advantage of multiple cores, it pulled away. UnixBench does run tests long enough that the burst speed of the t1.micro instance is not a major benefit. There is also a significant set of variances between the m1.medium instances (E5645 based) and the m1.large instances (E5507 based) in terms of single threaded performance.
c-ray 1.1 Performance
c-ray is a very interesting ray tracing benchmark and provides both consistent results and some clear separation. Originally we were using a large 7500×3500 simple scene. that worked well for the low end machines but the dual Intel Xeon E5-2690 systems were running it in about a second. We then built a benchmark around a 1920×1200 but more complex scene. This worked well but yields a fairly big swing on different systems. As a hint, times now range from over 15 seconds on fast dual processor systems to a few hours on the Raspberry Pi’s poor ARM chip. Here are the commands to get up and running.
wget http://www.futuretech.blinkenlights.nl/depot/c-ray-1.1.tar.gz
tar -zxvf c-ray-1.1.tar.gz
cd c-ray-1.1
make
cat scene | ./c-ray-mt -t 32 -s 7500×3500 > foo.ppm
cat sphfract | ./c-ray-mt -t 32 -s 1920×1200 -r 8 > foo.ppm
That will download, install and run the two tests. Here are the results:
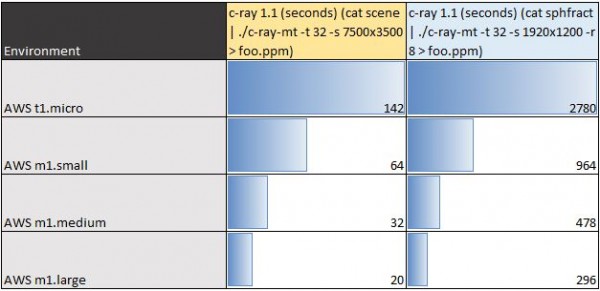
As one can see, the sustained compute required of c-ray 1.1 in both renderings is too much for the t1.micro burst speed to handle. Also as two extremes on the sphfract test, the m1.large may seem fast at 296 seconds, but a dual Intel Xeon E5-2690 system will do the task in about 19 seconds. Conversely the t1.micro may seem slow at 2780 seconds but a Raspberry Pi takes over 7240 seconds on average to run that test.
Crafty Chess Performance
Crafty is a well known chess benchmark. It is also one were we saw issues last time with the Phoronix Test Suite and running on ARM CPUs. Another key consideration is that running on the default Amazon AWS AMI for Ubuntu 12.04 LTS will not install crafty from default Amazon repos. This one may end up getting removed from the final suite. To run crafty (assuming repos are aligned) one can simply use:
crafty bench
Doing so will yield two results one in terms of raw nodes per second and one in elapsed time. Chess benchmarking fans are usually interested in the former.
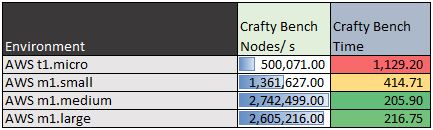
The default crafty settings are not testing multi-CPU effectively hence why we are seeing similar m1.medium and m1.large results. Also interesting we would expect the m1.small to be about 1/2 of the m1.medium and m1.large in this type of benchmark and that is directionally what we see. This is one where we will likely change the methodology.
Phoronix Test Suite Performance
We are using four tests from the Phoronix Test Suite: pts/stream, pts/compress-7zip, pts/openssl and pts/pybench.
pts/Stream Triad Performance
STREAM by John D. McCalpin, Ph.D. is a very well known benchmark. So much so that the benchmark is highly optimized when results are presented. Vendors use the STREAM benchmark to show architectural advantages. Needless to say, oftentimes these results are hard to reproduce unless one is trying to squeeze every ounce of performance from a machine they are optimizing for. Since the rest of the industry does that, we are taking a different approach. One installation run across all systems. For this we are using the Phoronix Test Suite version pts/stream. Specifically we are using the lowest bandwidth figure Triad test to compare memory throughput. This can be run with:
phoronix-test-suite benchmark pts/stream
For those wondering we will report on the Triad results (option 4) but you may want to look at all results (option 5.)
pts/compress-7zip Performance
We have long used 7-zip compression benchmarks in our Windows suite so we are including it again on the Linux side. The command to run the benchmark is simply:
phoronix-test-suite benchmark pts/compress-7zip
The benchmark will run and give performance figures in terms of MIPS. The higher the better.
pts/OpenSSL Performance
The pts/openssl benchmark is one we found a small issue on with the Amazon AWS EC2 t1.micro instance earlier. The micro instance had nice burst speed but fell off dramatically after that. Looping the test gave consistent results. To run the benchmark simply issue the command:
phoronix-test-suite benchmark pts/openssl
That will run the OpenSSL benchmark for you and give performance in terms of signs per second. Again, the higher the better.
pts/pyBench Performance
Python is a widely used scripting language. In fact, it is arguably becoming even more popular these days so we decided to include a pyBench benchmark in the results. To run the benchmark use:
phoronix-test-suite benchmark pts/pybench
pyBench results are expressed in milliseconds so lower is better.
Phoronix Test Suite Benchmarking Results
Here are the results of the pts benchmarks:
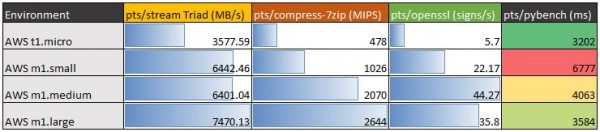
Here we see an interesting pattern emerge as the Amazon EC2 m1.large instance generally wins but is not the clear winner.
Conclusion
This is the initial list after going through thousands of benchmark runs across very different platforms. Hopefully this look at the Amazon AWS EC2 first generation t1.micro, m1.small, m1.medium and m1.large instance types will help others evaluate performance. For those wondering, the Raspberry Pi 512MB falls just below the t1.micro steady state. The m1.small is more akin to an Intel Atom Centerton S1260 platform. More to come on that. This is also yet another case where we see the t1.micro’s burst compute capabilities skewing results. Likely this is why so many tests on the web do not include the t1.micro instance. It does show more testing is needed to get to a good set of results. One other interesting thought from these benchmarks, if doing AES encryption, the m1.small instances tested should be significantly faster than the m1.large because of the underlying CPU architectures (E5645 v. E5507.) The major positive is that we ran these benchmarks on bare metal outside of Amazon EC2 instances so we have an idea of what the results should look like. More to come on that. For now, take these as a data point and progress update while we develop the benchmark suite.
The Ask: If you do have a set of results, or have a great command to replace the commands above, please let us know. We have a thread on the Forums on the topic.


Hi Patrick, these are certainly interesting benchmarks. I seem to be having problems displaying the phoronix-test-suite benchmark images. Is the link for them broken?
thanks
Rich
Hi Rich,
I just summarized them in the bottom table after the pts/pybench results. Thanks for the feedback and let me know if you have any other ideas for the suite.
Comments are closed.