Synology SAT5200-960G Performance Testing
We are moving towards using larger test sizes on our benchmarks, but on several tests, we also used the smaller default test sizes. This allows us to see the difference between lighter and heavier workloads.
A word of warning before you see the benchmarks; unfortunately, I do not have many SATA drives in my testing database, as up to this point I have focused mostly on consumer-class PCIe SSDs. As a result, the Synology SAT5200-960G will be making many appearances near the bottom of the benchmark comparison chart.
BlackMagic Disk Speed Test
This is a popular speed test in the video community. It shows whether a storage device is suitable for throughput required at a given video format.
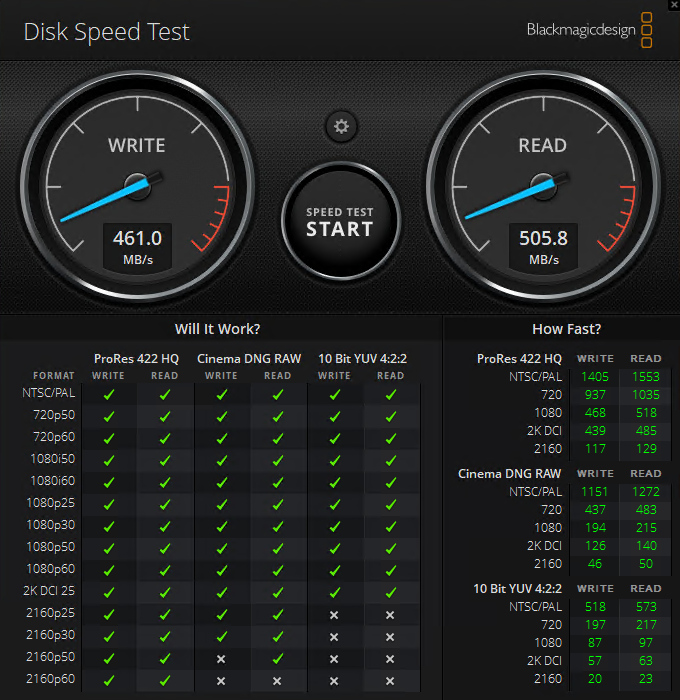
The SAT5200-960G is limited to a SATA interface, and so a number of these formats were simply never going to be within reach of this drive.
CrystalDiskMark 7.0.0 x64
CrystalDiskMark is used as a basic starting point for benchmarks as it is something commonly run by end-users as a sanity check.
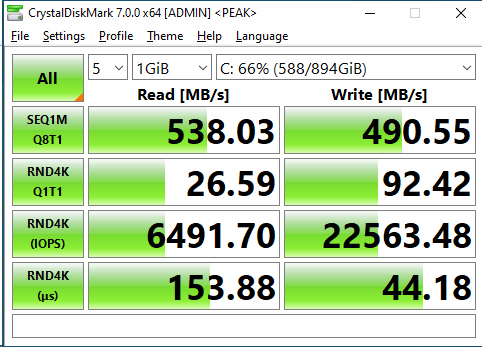
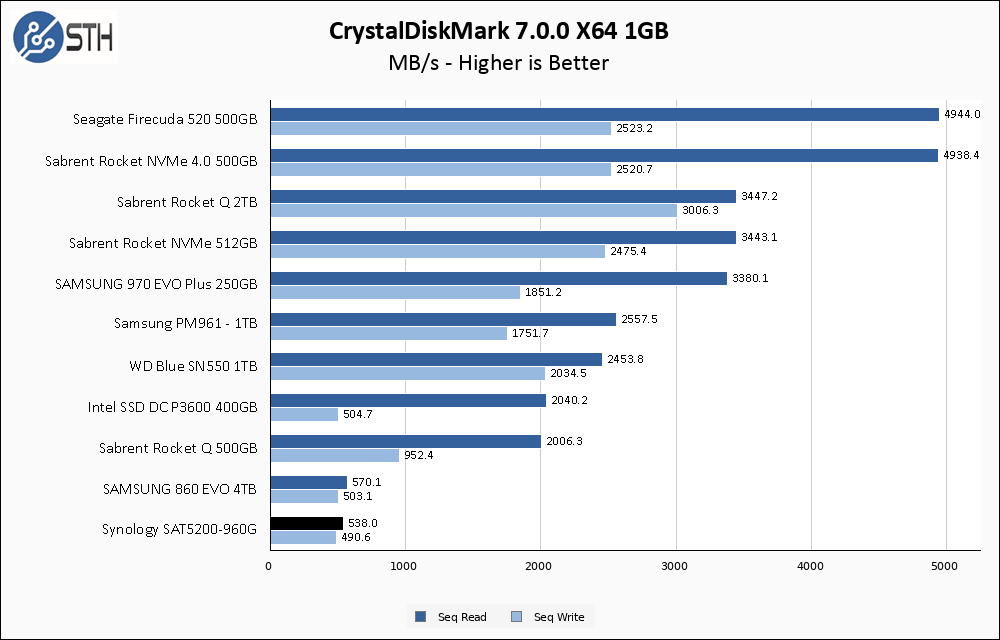
The only other SATA based drive on my list is the Samsung 860 EVO, and the SAT5200-960G more-or-less keeps up with that drive. The rated specs for this drive are 530 MB/s read and 500 MB/s write, so it is essentially hitting the advertised performance.
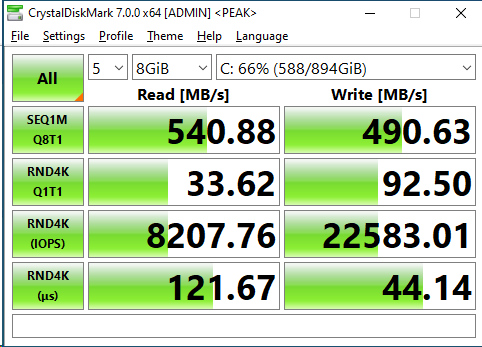
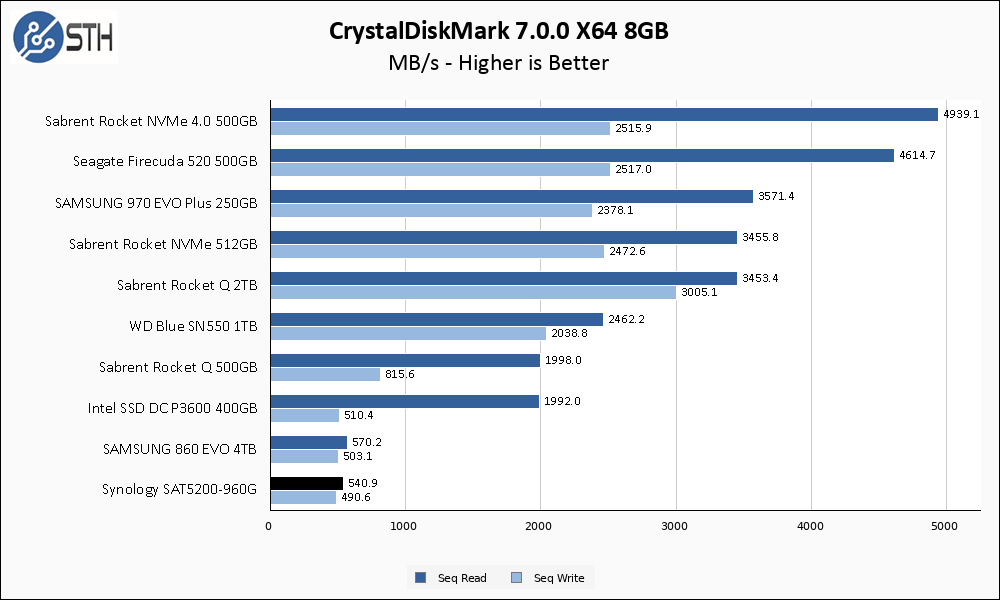
Moving to a larger test set did not affect the SAT5200-960G in any way. This is what we would expect since this drive is marketed on its consistency of performance.
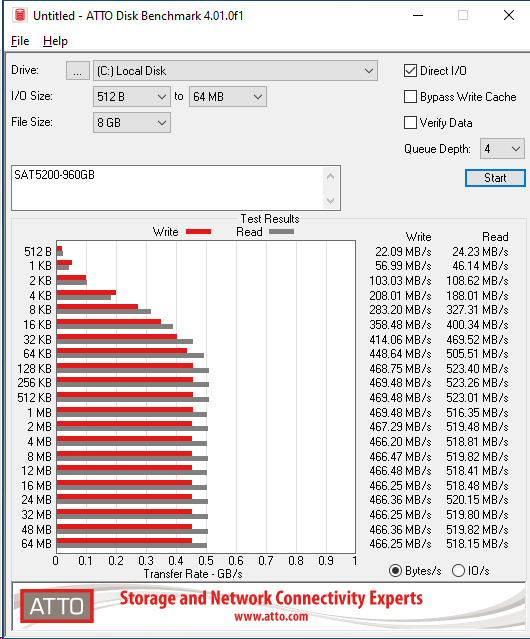
ATTO Disk Benchmark
The ATTO Disk Benchmark has been a staple of drive sequential performance testing for years. ATTO was tested at both 256MB and 8GB file sizes.

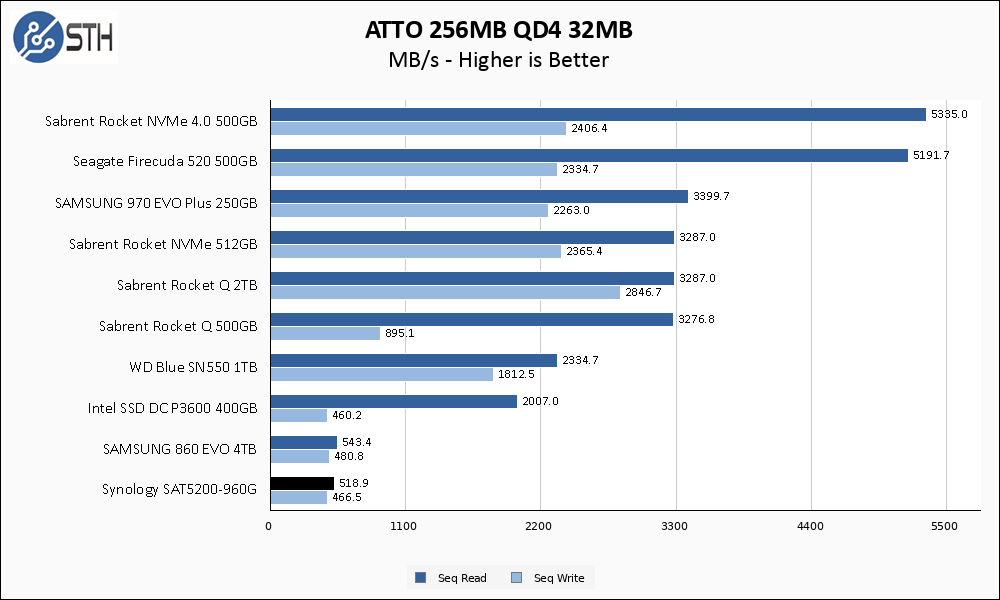
Similar to CrystalDiskMark, ATTO performance is close to the advertised specs and is a near dead heat with the Samsung drive.
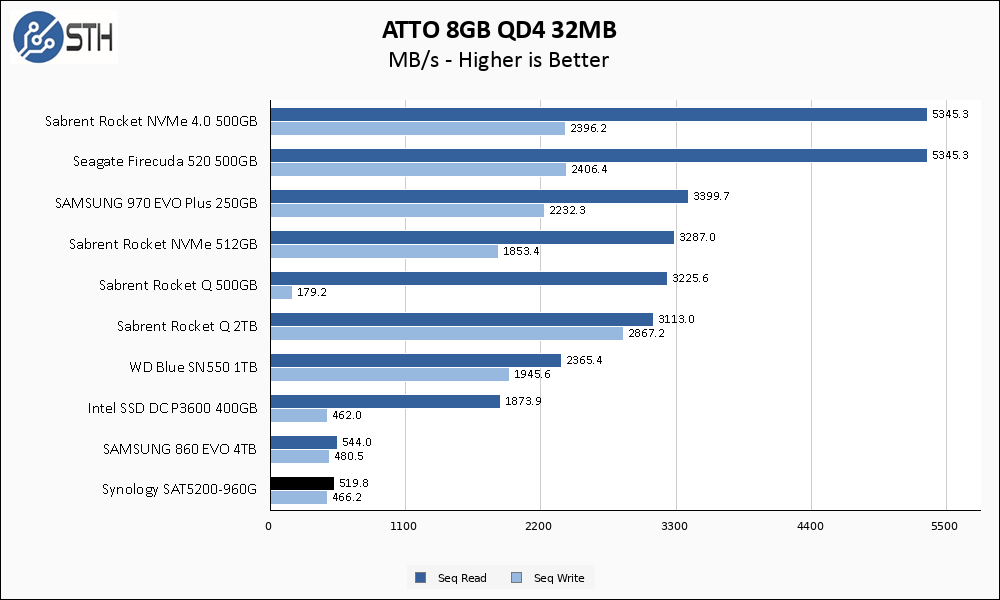
Once again the larger test set has no negative impact on performance; the ATTO 8GB test set is nearly indistinguishable from the 256MB one.
Anvil’s Storage Utilities
Anvil’s Storage Utilities is a comprehensive benchmark that gives us a very in-depth look at the performance of drives tested. This benchmark was run with both a 1GB and 8GB test size.
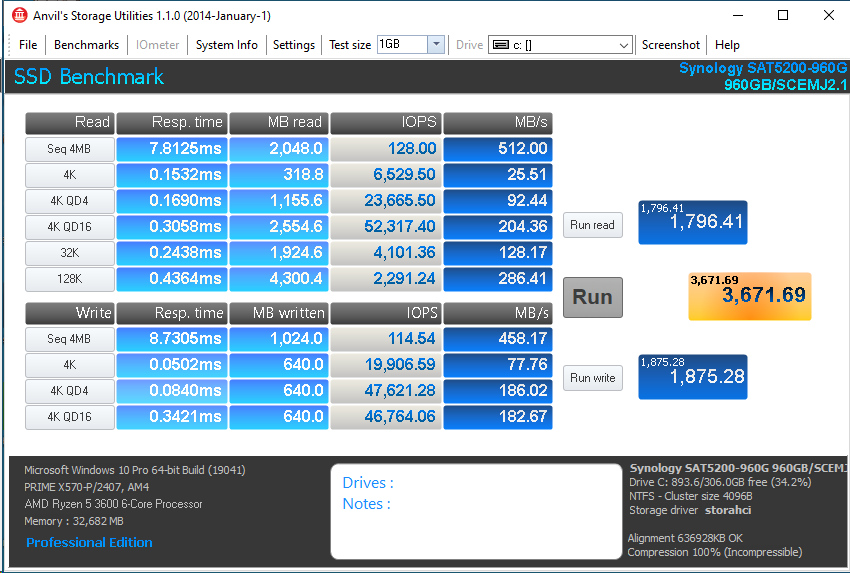
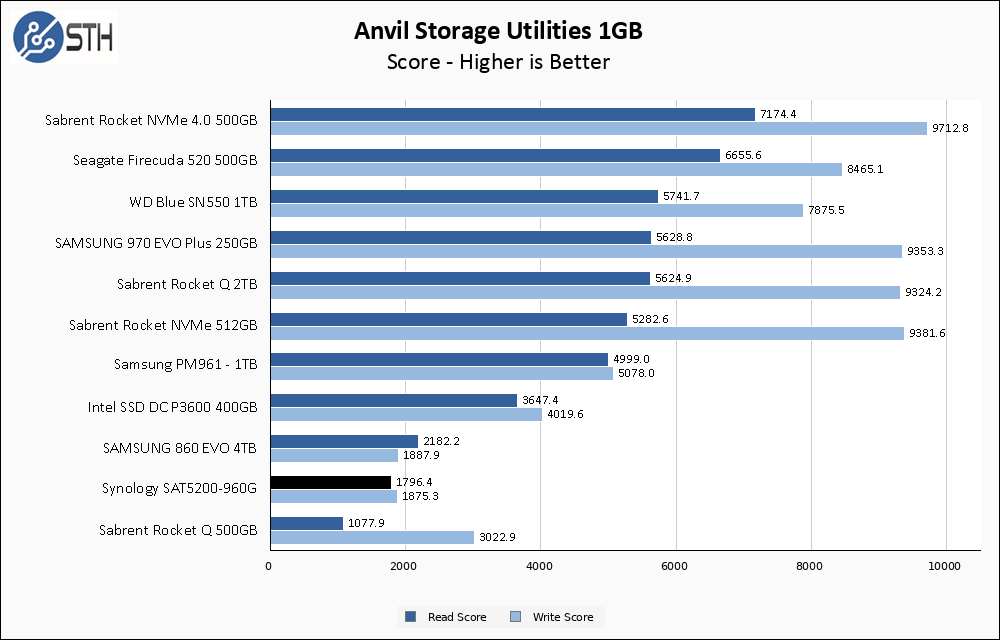
With Anvil running a 1GB test size, neither read nor write speeds have moved much compared to ATTO and CrystalDiskMark. The Synology drive manages to best the NVMe-based Rocket Q 500GB drive; this is thanks to significantly better read latency performance on the random workload portions of this test.

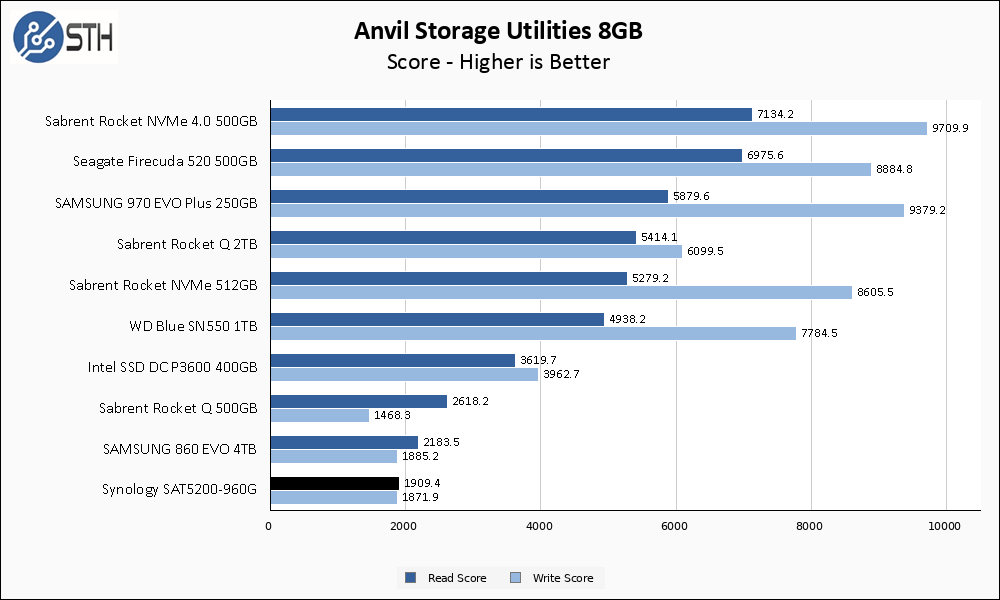
Keeping to the trend, the SAT5200-960G is unaffected by the larger test set. Here though it manages to beat the Rocket Q 500GB in write performance by a somewhat significant margin, again thanks to lower and more consistent latency.
AS SSD Benchmark
AS SSD Benchmark is another good benchmark for testing SSDs. We run all three tests for our series. Like other utilities, it was run with both the default 1GB as well as a larger 10GB test set.
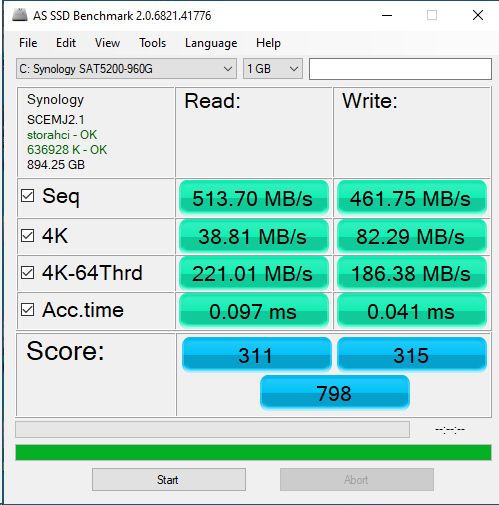
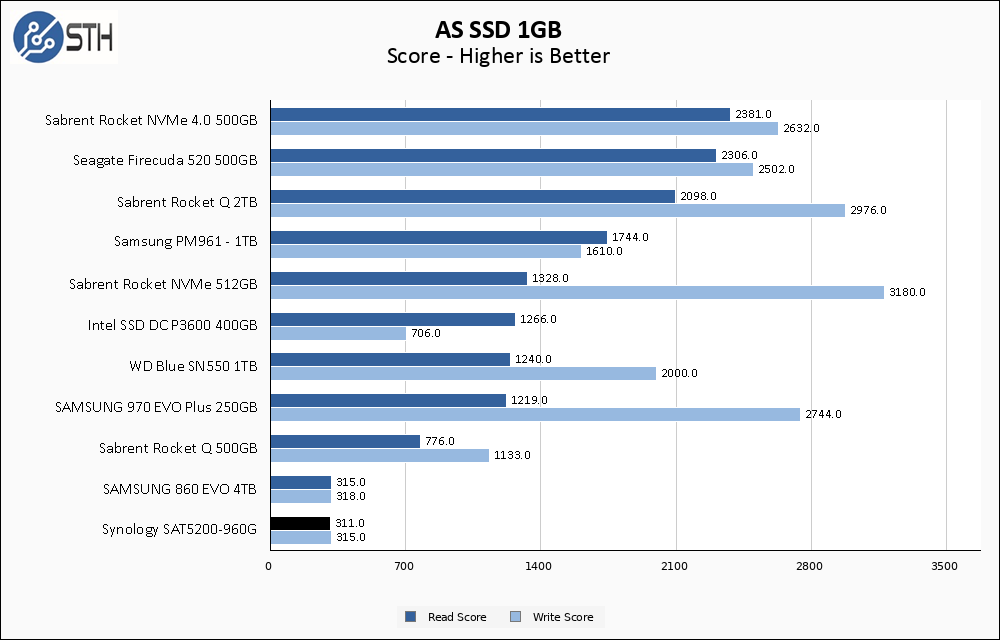
AS-SSD again presents a functional tie with the Samsung 860 EVO for performance.

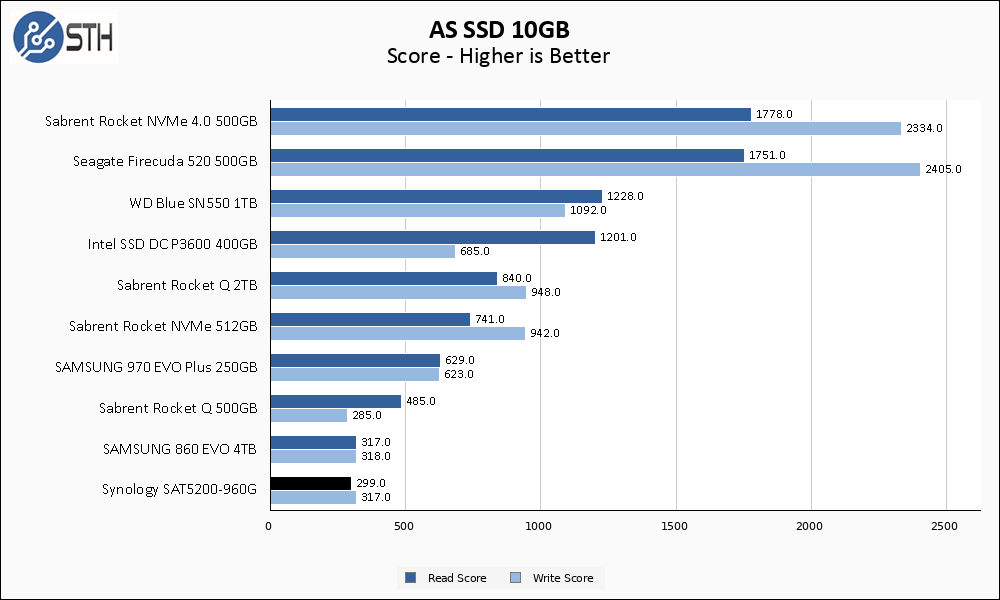
One last time, the SAT5200-960G is unaffected by the move to the larger 10GB test set. The Rocket Q 500GB falters, here again, allowing both our SATA drives to squeak out small wins in the write performance metrics.
SPECworkstation, and our conclusion are up next.


To avoid a race to the bottom in which manufacturers lower the quality of their products while optimising a simple metric used for performance comparisons, it would be nice to devise a way to test power-loss protection as well as compare how much flash really is reserved for wear leveling and endurance. Power consumption under various loads and heat generation would also be useful.
“Our testing uses the Synology SAT5200-960G as the boot drive for the system, installed in the M.2_1 slot on the motherboard.”
That must have been quite a feat.
WTH,
Indeed :) I’ve fixed it, it’s supposed to be SATA6G_1. Thanks!
Eric,
Patrick and I went back and forth a bit on the reserved area of flash. While we felt pretty confident with the 128GB NAND packages resulting in 320GB of spare area, we were unable to get official confirmation from anyone. Call it an educated guess.
As for power, the power usage of almost any single SSD is unfortunately within the margin of error of my ability to measure it, especially if I intend to distinguish load power of the drive from the rest of the power in use on my system. For SATA drives, I could in theory attach them to their own separate power supply and measure them independently from the rest of the system, but I do not review many SATA/SAS SSDs so it is not a path I took.
Thank you to STH for doing storage. I saw other reviews of this drive that didn’t mention the 10 NAND packages. That’s a great insight that you’ve covered.
@Will Thanks for the clarification and quick response.
I think a good 3rd-year electrical engineering student could wire up a harness with an inline amp meter to accurately measure the power draw of a SATA SSD. A similar device should be possible for m.2 as well. While the depth of reporting on Serve the Home is always good, this would be a way to improve it and in my opinion quite interesting.
On first impressions, this SSD looks like a very nice upgrade for an old laptop with an aging 160 GB hard drive in need of TLC, although frankly it’s probably far too expensive for my lacking income given that its intended use case is in NASes. I noticed a sizable number of unpopulated chip positions and was wondering why, but then I saw your chart showing capacities up to 1.92 TB and that would explain that. It would be neat to see future ones go up to 4 TB without compromising on what looks to be a fairly rock-solid design reliability-wise.
Stephen,
This drive is likely very much overkill for a simple client laptop drive. I would look at more consumer oriented drives for sure. You can spend 1/3 the money for the same capacity since you will not be paying for the features you don’t need.
Will,
as some of us know, this SSD is targeted primary to NAS environment.
Why those useless tests, without an added value for the NASes?
Why not:
– ext4/btrfs based FS tests?
– diff RAID scenarios (regular or SHR)?
– RANDOM I/O only tests? Because sequential outputs you can put into trash.
– virtualized environment (VMM, Docker) … one of the target for this SSD
– real test bunch ( mixed file sizes wit near to regular size)
Then this review will be useful. Otherwise you can write just = this is an expensive drive for such benchmark eaters.
Price is ridiculous even for high-end DWPD and PLP.
At U$350 (two places) it’s less than the Ironwolf, vote with your wallet.
Will Taillac,
Thank you for replying to my comment. Perhaps you’re correct in the points you made. However, my idea of a decent reliable SSD would kind of include having a really long lifespan. I’m not certain that consumer grade SSDs are able to deliver that. I’ve read about the use of MLC, TLC and now QLC technology and how the life in write/erase/rewrite cycles is significantly lower than that for the earlier SLC technologies. Also, they have been billed as being not as fast, performance-wise, as the SLC-based SSDs. Maybe I’m behind the curve. I just think it would be nice to be able to have an SSD with both huge capacity AND a lifespan at least equal to that of a traditional spinning-platter drive.
Stephen,
For most common, consumer-level use case scenarios, a quality consumer-grade SSD made today should outlast its usable lifetime. An example, the 970 EVO 250GB drive I have as my personal workstation boot drive is around 1 year old, and on my computer where I work and play 12+ hours a day it currently has 12.4TB of total writes in that time. At my current pace, after the 5 year warranty is completed I will have written ~62TB of data to the drive, while its rated endurance in those 5 years is 150TB. Meanwhile, by the time 2024 comes around, a 250GB drive will be puny in size (it already almost is).
Unless a drive is subjected to what I would describe as ‘intense’ or ‘server-like’ workloads, common consumer uses of SSD drives for boot volumes and games and such are unlikely to run afoul of endurance limits of most modern SSDs.
Comments are closed.