Seagate FireCuda 530 1TB Performance Testing
We test using both the default smaller test size as well as larger test sets on our benchmarks. This allows us to see the difference between lighter and heavier workloads.
CrystalDiskMark x64
CrystalDiskMark is used as a basic starting point for benchmarks as it is something commonly run by end-users as a sanity check.
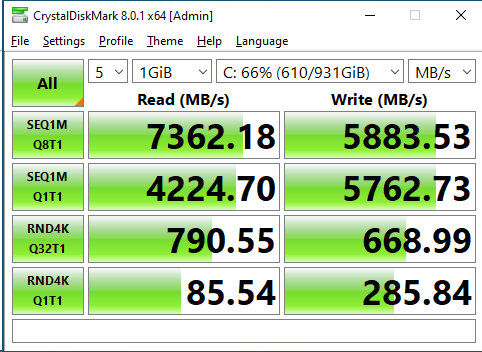
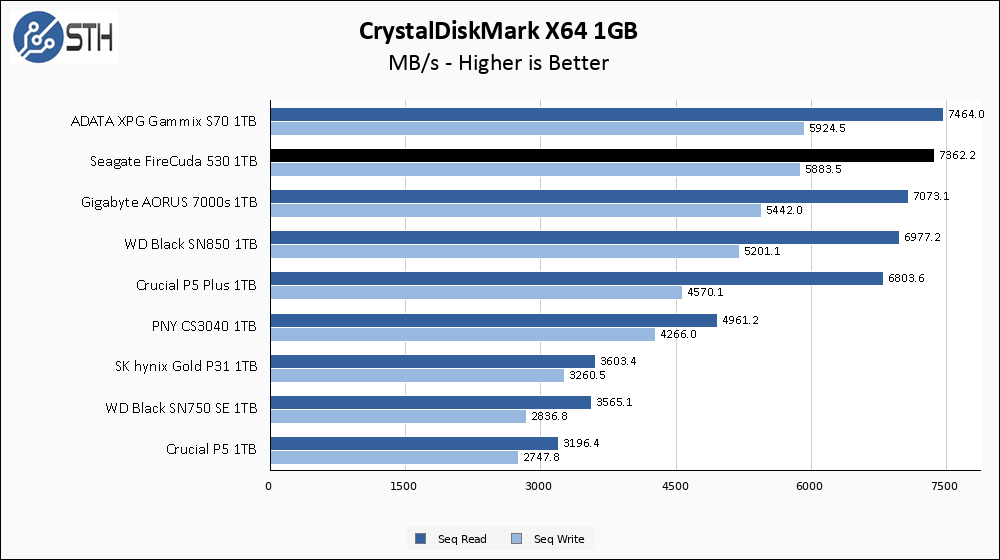
Starting out fairly strong, the Seagate FireCuda 530 1TB finds itself pretty close to its rated specs. It falls a tiny bit short in write speed compared to the 6000 MB/s rating, but it is only off by around 2% which is forgivable. Compared to the rest of the drives on the graph, the FireCuda 530 is vying for the top spot.
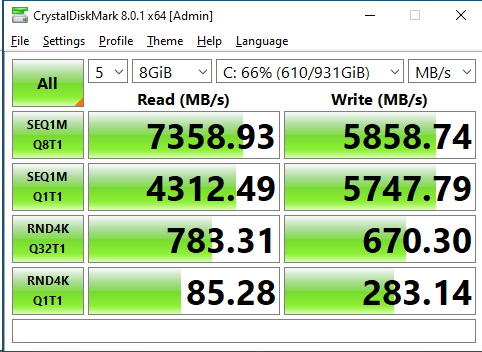
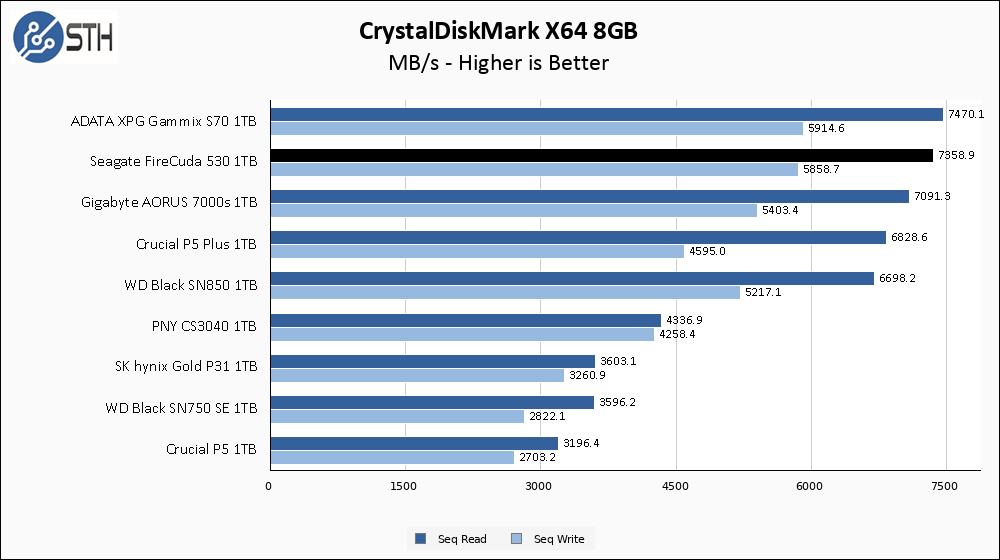
Performance drop on the larger CrystalDiskMark test is negligible, which is always welcome. As a result, the FireCuda 530 is once again only narrowly edged out by the XPG Gammix S70.
ATTO Disk Benchmark
The ATTO Disk Benchmark has been a staple of drive sequential performance testing for years. ATTO was tested at both 256MB and 8GB file sizes.
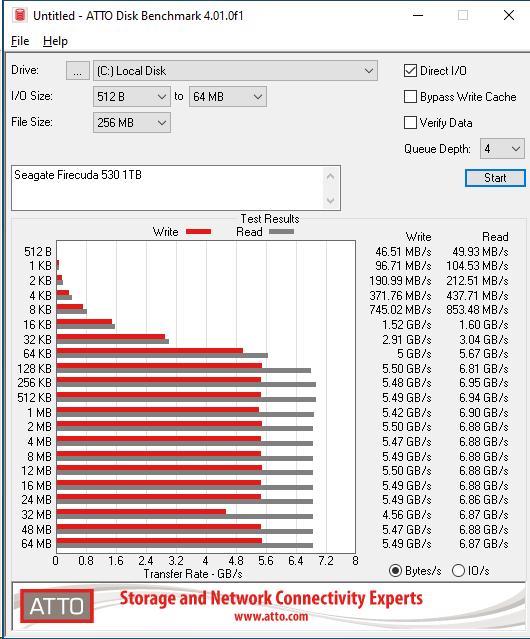
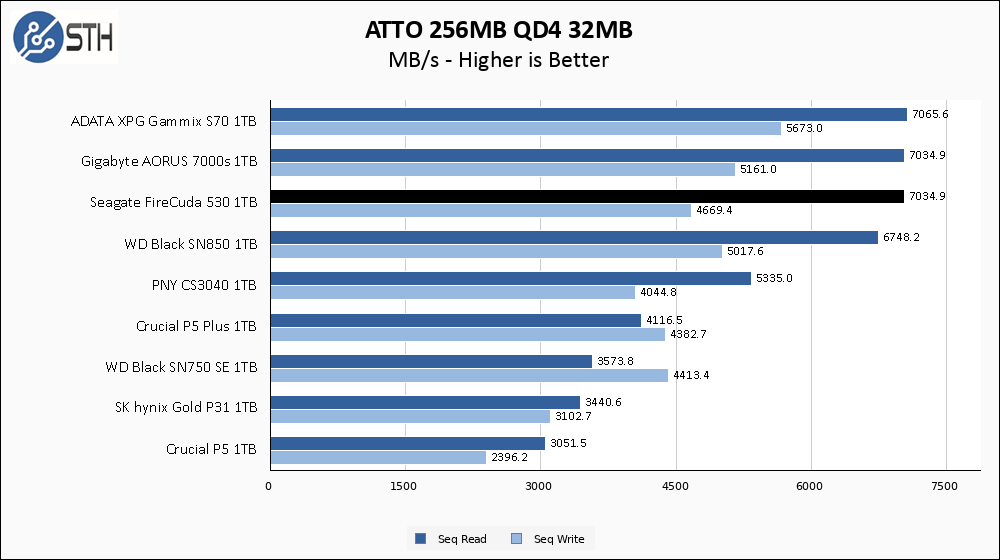
We take our ATTO results at the 32 MB data point, and if you look at the full ATTO 256 MB file size results you will notice the 32 MB result is anomalous compared to the rest of the graph. In truth, additional runs of this test on the FireCuda 530 put the 32 MB write results right in line with the other chunk sizes at around 5.49 GB/s. I am not holding this lower result against the FireCuda 530; every drive has variability. I specifically kept this result to show that despite controlling for as many variables as possible in my testing environment there is still room for seemingly random variability in the testing and to demonstrate that no single benchmark or benchmark result should ever be considered fully representative for a drive.

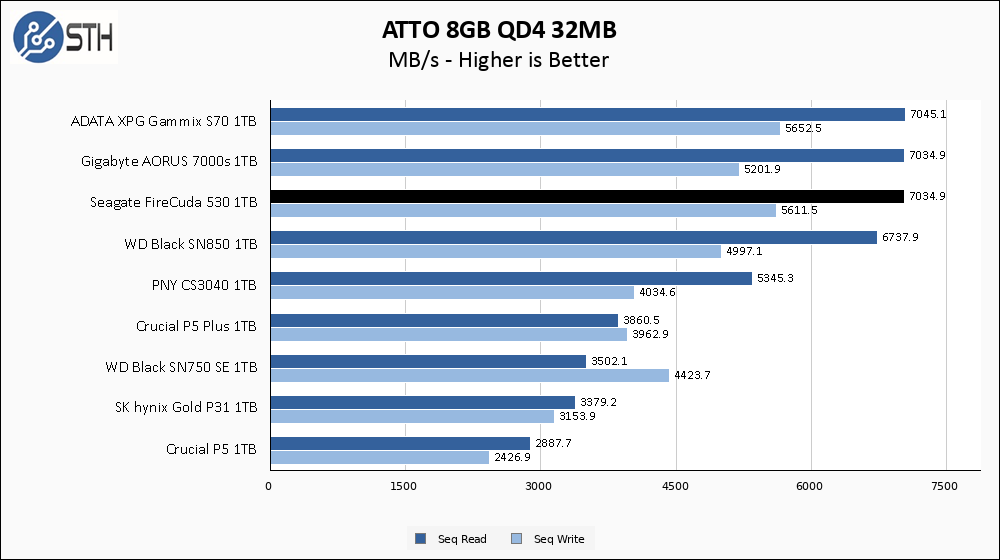
Thanks to not randomly hiccupping in the larger 8GB ATTO test, the results fall right back in line with the best PCIe 4.0 drives we have tested.
Anvil’s Storage Utilities
Anvil’s Storage Utilities is a comprehensive benchmark that gives us a very in-depth look at the performance of drives tested. This benchmark was run with both a 1GB and 8GB test size.
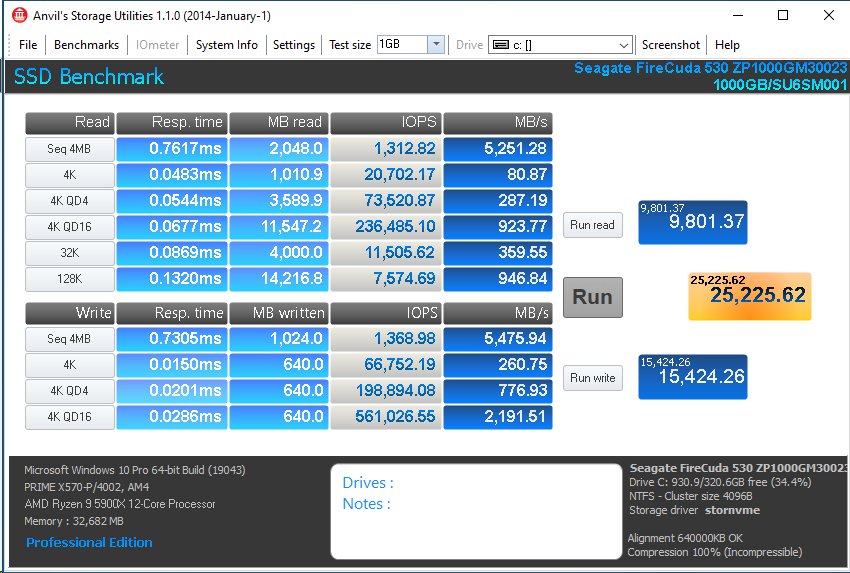
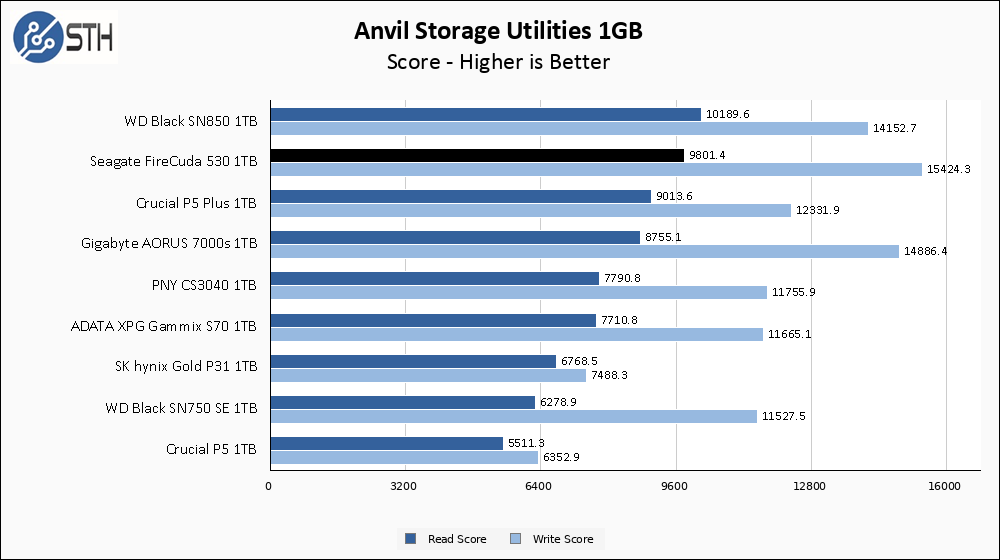
Anvil keeps the Seagate FireCuda 530 near the top of our result set, combining a very good read score with chart-topping write scores.

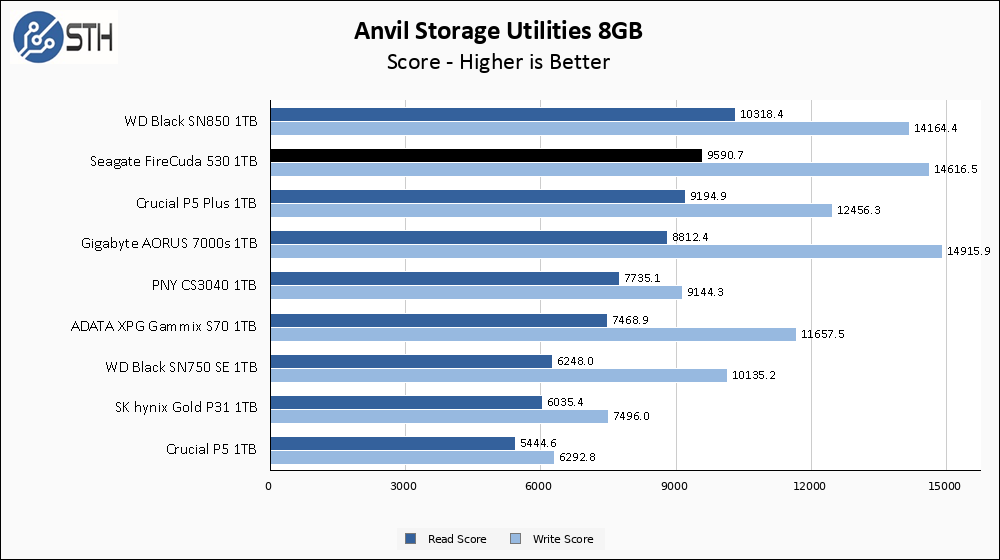
The Seagate FireCuda 530 1TB also performs very well in the larger Anvil test. It only suffers a minor performance dip, though that is just enough to let the Gigabyte AORUS 7000s to edge past the FireCuda 530 in write score.
AS SSD Benchmark
AS SSD Benchmark is another good benchmark for testing SSDs. We run all three tests for our series. Like other utilities, it was run with both the default 1GB as well as a larger 10GB test set.

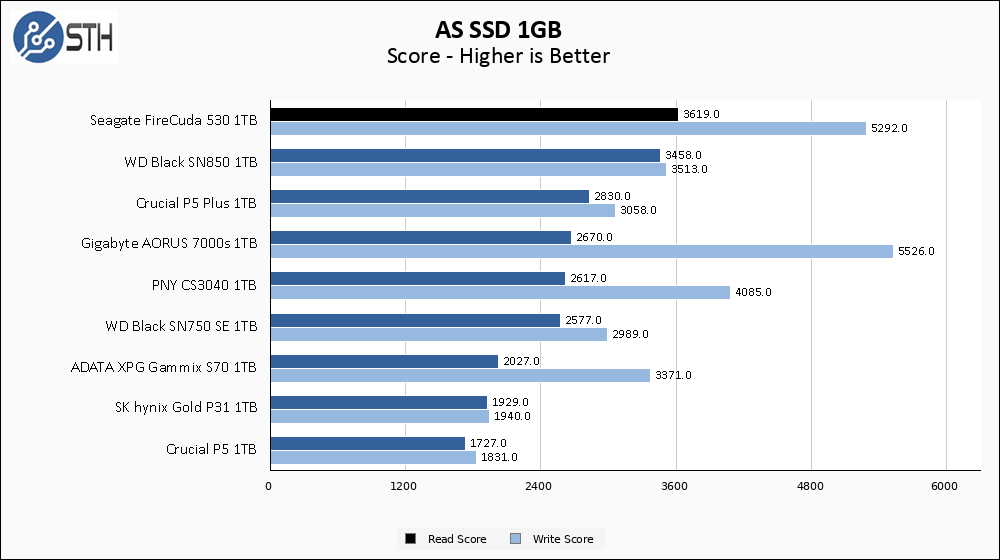
AS SSD gives the Firecuda 530 its first read victory in my testing. Write score is also very good, once again narrowly losing to the AORUS 7000s.
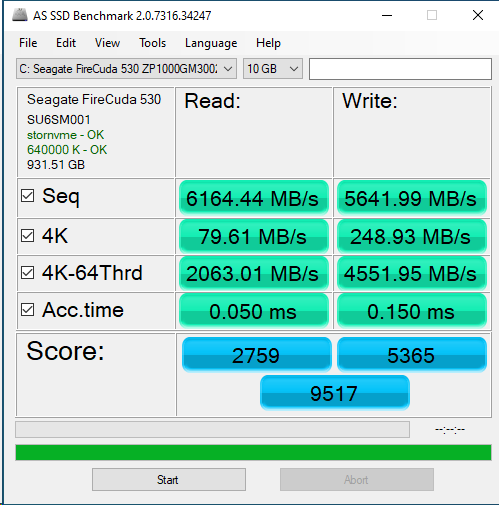
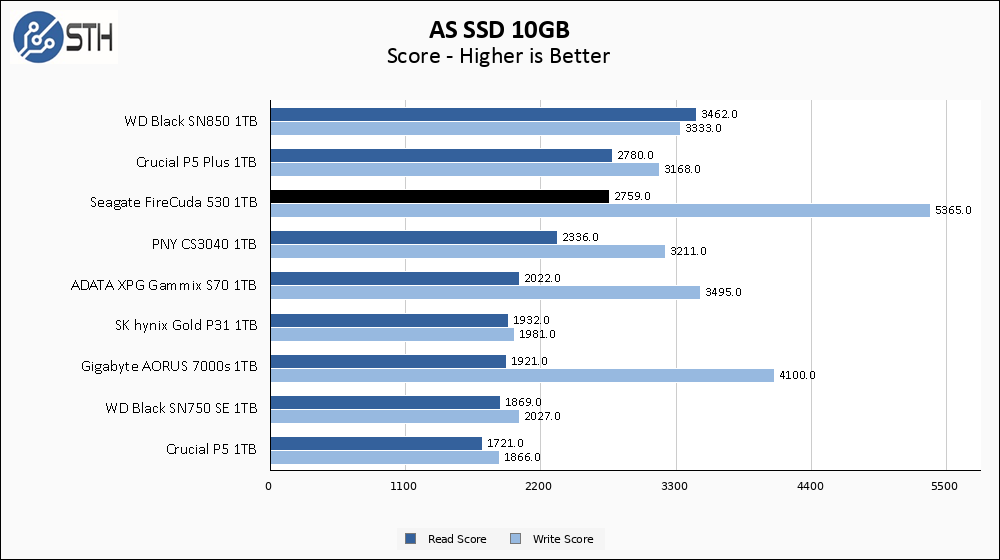
The larger AS SSD test is is a bit of a mixed bag. On the one hand, the FireCuda 530 loses a step in the read score department and falls to third on our graph. Write speed, on the other hand, turns in an astounding result and actually improves compared to the smaller test. More on this write speed later on in the review.
SPECworkstation, thermals, and our conclusion are up next.


I have the WD SN850 in a couple of computers, I noticed that the sequential performance deteriorated quite a lot over time. The drive now delivers less than 1600MB/s sequential read (tested with dd in linux)
Frankly, I am more impressed by the 4k Q1T1 performance. This thing delivers more than 21,000 tps in the worst case scenario!
Thanks Will for testing sustained performance!! And congratulations to Seagate, seems the hype is justified!
Echoing Steven: thanks for testing sustained write!
Weak article not at the level we expect from STH.
Benchmarking a Storage is much more complex than just run few doubtfull software and show some ridiculous windows task manager screenshot.
Running a full spectrum of disk test while you generate a controlled “noise” in the system is the way to go. Then you need to filter the results with some statistics math tool and filtering to remove uncontrolled noise on the system . No existing “commercial” benchmark doit properly.
Real case scenario must be simulated with a bit of knowledge and not just pressing start button on a benchmarking suite.
I really hope you do a more serious test when you deploy hight performance big network storage than the one you showed here.
They’re doing something different controlling noise with something that isn’t a commercial benchmark.
Diogene da Samo you just read that online and tried to copy/ paste but failed. Maybe you’re a bot and that would make more sense with your reply.
Where are Corsair models?
I’d like to see the Corsair MP600 Pro, maybe Pro XT comparison included.
I have 2 x Corsair MP 510 currently, will be upgrading MB very soon so I’m trying to decide on 2 x PCIE 4.0 M.2 drives to replace my boot and games drive.
I’ve narrowed it to either Seagate FireCuda 530 or Corsair MP600 Pro. The 530 claims tiny increase in read/write speeds whereas MP600 Pro claims up 1,200,000 IOPS vs 1,000,000 for 530.
I’m already leaning towards 530 because of higher TBW. I have decades of experience with Seagate storage drives and consider them most reliable.
Hey everyone nice forum :)
The real drive this competes with is the Samsung 980 pro, as these other drives are not in the same class. Seems like the 980 pro still has the edge on latency but the 530 has endurance and burst speed. This reflects Samsung poor choices for the 980pro so assuming a stronger competitor will be launched soon
May I ask what system you used to test this on? And what cache settings on Windows? I get half the 4k random 32Q1T speeds as you.
Comments are closed.